Various network performance monitoring tools have been developed and .... mrtg
-ping-probe, NetMRG, NetworkActiv Scanner, Web Server Stress Tool, ...
Survey of Network Performance Monitoring Tools Md Jahangir Alam
[email protected]
Abstract This survey paper focuses on introduction of Network Performance Monitoring tools that have been developed and implemented over the last few years. In this paper, I have made every attempt to list most of the well known tools and organize the taxonomy of tools based on some criteria that will help you to decide whether you choose such tools or not. In addition to I briefly discuss some tools that can be used in some wide area of network performance measurement. I hope this paper will enable people working on computer networks to choose appropriate tools to meet their goals. Back to Prof. Raj Jain'a Homepage
Table of Contents 1 Introduction 2 Monitoring Tools 2.1 Tools Developed Between 1996 and 2006 2.2 Types of Tools 3 Overview of Some Popular Tools 3.1 BBMonitor 3.2 CommView 3.3 Advanced HOstMonitor 3.4 GFI Network Server MOnitor 3.5 Argus 3.6 SmokePing 3.7 Axence NetVision 4 Summary References List of Acronyms
1. Introduction Computer networks are connecting millions of computers and computer users throughout the world. The network has become an infrastructure for many applications that affect our daily lives. It is very important that the computer network needs to be managed properly. Management of networking requires monitoring. Network monitoring is a set of mechanisms that allows network administrators to know instantaneous state and long-term trends of a complex computer network [Chiu92] Various network performance monitoring tools have been developed and implemented over the last few years. These tools allow us to test different aspects of network performance and they are developed by individuals, commercial companies, non profit organizations, and government organizations. Some of them are free, open source, while some of them are not.
http://www.cse.wustl.edu/~jain/cse567-06/ftp/net_perf_monitors2/index...
1 of 10
Various network performance monitoring tools have been developed and implemented over the last few years. These tools allow us to test different aspects of network performance and they are developed by individuals, commercial companies, non profit organizations, and government organizations. Some of them are free, open source, while some of them are not. The rest of the paper is organized as follows. Section 2 lists Monitoring tools developed from 1996 to 2006, from most recent to old tools. Section 3 briefly discusses some selected popular tools. Section 4 concludes the report. Back to Table of Contents
2. Monitoring Tools In this section,first I have tried my best to list all available tools used in monitoring network performance. Then I organize the taxonomy of them based on some criteria. So people can find their appropriate tools from this list easily and efficiently.
2.1 Tools developed between 1996 and 2006 The following table lists network performance monitoring tools that have been developed and implemented between 1996 and 2006 [Cortell06][Zeadally03]. Table 1: Network performance tools developed between 1996 and 2006 Year Name of Tools 1996 mrtg, NetNow, NetraMet, Network Probe Daemon, InterMapper, Lachesis, Optimal Networks, Digex 1997
INS Net Perf Mgmt survey, tcpspray, Mapnet, Keynote, prtraceroute clflowd flstats, fping, tcpdpriv, NetMedic Pathchar, CAIDA Measurement Tool Taxonomy, bprobe & cprobe
1998 NetOps, Triticom, Maple, PV-Wave, S-Plus, VisualRoute. Cheops, Ganymede, hping2, Iperf, JetMon, MeasureNet, MatLab, MTR, NeoTrace, Netflow, 1999 NetLogger, Network health, NextPoint, Nmap, Pchar, Qcheck, SAA, SafeTP, Sniffit, SNMP from UCSD, Sting, ResponseNetworks, Tcpshow, Tcptrace WinTDS. Analyzer, bbftp, Big Brother, Bronc, Cricket, EdgeScape, Ethereal (now renamed Wireshark), gen_send/gen_recv, GSIFTP, Gtrace, Holistix, InMon, NcFTP, Natas, NetAlly, NetScout, Network 2000 Simulator, Ntop, PingGraph, PingPlotter, Pipechar, RRD, Sniffer, Snoop, StatScope, Synack, View2000, VisualPulse, WinPcap, WU-FTPD, WWW performance monitoring, Xplot. AdventNet SNMP API, Alchemy Network Monitor, Anasil analyzer, Argent, Autobuf, Bing, Clink, DSLReports, Firehose, GeoBoy, PacketBoy, Internet Control Portal, Internet Periscope, ISDNwatch, 2001 Metrica/NPR, Mon, NetPredict, NetTest, Nettimer, Net-One-1, Pathrate, RouteView, sFlow, Shunra, Third Watch, Traceping, Trellian, HighTower, WCAT, What��s Up Gold, WS_FTP, Zinger. ANL Web100 Network Configuration Tester, Anritsu, aslookup, AlertCenter, Alertra, AlertSite, Analyse-it, bbcp, BestFit, Bro, Chariot, CommView, Crypto-Pan, elkMonitor, DotCom, Easy Service Monitor, Etherpeek, Fidelia, Finisar, Fpinger, GDChart, HipLinkXS, ipMonitor, LANExplorer, 2002 LinkFerret, LogisoftAR, MGEN, Netarx, NetCrunch, NetDetector, NetGeo, NEPM, NetReality, NIST Net, NLANR AAD, NMIS, OpenNMS PageREnterprise, PastMon, Pathprobe, remstats, RIPmon, RFT, ROMmon, RUDE, Silverback, SmokePing, Snuffle, SysOrb, Telchemy, TCPTune, TCPurify, UDPmon, WebAttack, Zabbix.
http://www.cse.wustl.edu/~jain/cse567-06/ftp/net_perf_monitors2/index...
2 of 10
AbwE, ActivXpets, AdventNet Web NMS, Analyse It, Argus, Big Sister, CyberGauge, eGInnovations, Internet Detective, Intellipool Network Monitor, JFF Network Management System, LANsurveyor, LANWatch, LoriotPro, MonitorIT, Nagios, NetIntercept, NetMon, NetStatus, Network 2003 Diagnostic Tool, Network Performance Advisor, NimBUS, NPS, Network Probe, NetworksA-OK, Sniff��em, Spong, NetStat Live, Open NerveCenter, OPENXTRA, Packeteer, PacketStorm, Packetyzer, PathChirp, Integrien, StableNet PME, TBIT, Tcptraceroute, Tping, Trafd, Trafshow, TrapBlaster, Traceroute-nanog, Ultra Network Sniffer, Vivere Networks. MonitorMagic, N-central, N-vision, Netmeter, CleverEye, CueVision, D-ITG, Network Physics, FastCopy, internetVista, IPCheck Server, OSSMon, H.323 Beacon,Monitor,FREEping,NetMechnica, NetVizor, Observer, Overseer, ZTI Network Monitor, Orca, PRTG Traffic Grapher, QOVIA, Qradar, 2004 Wombat, Route Explorer, Scriptroute, Server Nanny, SNMP Explorer, Ganglia, GFI Network Services Monitor, Little:eye, STAB a Linux tracepath, SolarWinds Orion, Vantage, Vigilix, VitalNet, WatchTower Website Monitoring, WindowsNetworking.com, ServerFiles.com, SNMP Informant, bulk, BWCTL, Caligare Flow Inspector, Cittio, ClearSight, Distinct Network Monitor, EM7, EZMgt, GigaMon, Host Grapher II, HPN-SSH, Javvin Packet Netcool, netdisco, Netflow Monitor, NetQoS, Pathneck, OWAMP, RANCID, SiteMonitor, STC, SwitchMonitor, SysUpTime, TansuTCP, thrulay, 2005 Torrus, Tstat, VSS Monitoring, WebWatchBot, WildPackets, ZoneRanger, Advanced HostMonitor, Just-ping, LinkRank, MoSSHe, mturoute, N-able OnDemand, Scamper, SCAMPI, Simple Infrastructure Capacity Monitor, Spirent, Alvias, Airwave, AppMonitor, BitTorrent, PingER, Analyzer, Cacti, CSchmidt collection, Cymphonix Network Composer, Darkstat, Ey-on Bandwidth, SNM,Etherape, EZ-NOC, IPTraf, Jnettop, Zenoss, Gigamon Uni- versity, LITHIUM, mrtg-ping-probe, NetMRG, NetworkActiv Scanner, Web Server Stress Tool, NimTech, NPAD, 2006 Nsauditor, Nuttcp, OpenSMART, Plab, WatchMouse, Pandora FMS, PIAFCTM, PolyMon, PSentry, Rider, Sysmon, SpiceWorks,SftpDrive, SpeedTest, TruePath, Unbrowse, Unsniff, Webalizer, RSP, Pktstat
2.2 Types of Tools Different types of tools allow us to test different metrics: throughput, packet loss, bandwidth, delay, jitter and so on. This section organizes the taxonomy of tools based on some criteria that surely will help you to make an appropriate decision on which tools you need to pick up to meet your goal. The table 2 shows taxonomy of tools [Zeadally03]. Table 2: Taxonomy of Network Performance Monitoring Tools Name
Type
Performance Metrics
OS
Test Mode
GUI License
BBMonitor
Application Monitoring
Bandwidth usage and speed
Windows
Active
Yes Commercial
Advanced Monitoring
Application Monitoring
Network traffic and Window sever's availibility
Active
Yes Commercial
CommView
Analyzer
Internet and LAN activity
Active
Yes Commercial
Axence NetVision
Application monitoring
applications, TCP/IP services and All major OS SNMP devices
Active
Yes Commercial
http://www.cse.wustl.edu/~jain/cse567-06/ftp/net_perf_monitors2/index...
Windows
3 of 10
Pchar
Path Characterization
Bandwidth, throughput, latency, Unix/Linux packet loss
Active and passive, UDP, No ICMP
Chariot
Application
Throughput, jitter, delay, packet loss
Windows
Active TCP/UDP
Traceping
One-way availability/ latency Packet loss tests
VAX/ VMS
Active, ICMP No
Free
SYNACK
Path characterization
Latency
Solaris, Linux
Active, TCP
Free
SmokePing
Path characterization
Latency, packet loss Unix
Active, ICMP Yes Free
PathChar
Path characterization
Bandwidth, FreeBSD, throughput, latency, Solaris, Linux packet loss
Active, Yes Free Passive, UDP
MGEN
Traffic generator
Packet loss, delay, jitter
Linux/Unix
Active, UDP
Gtrace
Forward path probe
Node name,IP location, latency
Solaris/Linux/ FreeBSD
Active, UDP, Yes Free ICMP
MTR
Patch characterization
Packet loss, delay, jitter
Linux/Unix
Active, ICMP Yes Free
Gen_send, gen_recv
Traffic generator
Bandwidth, packet loss
Linux/Unix
Active
No
Free
BBFTP
FTP
TCP goodput
Linux/Unix
Active
No
Free
Argus
Flow monitoring
Track and report Unix network transaction
Active
Yes Free
free
Yes Commercial
No
Yes Free
Back to Table of Contents
3. Overview of some popular tools Due to the space limitation, I will not cover all the tools listed in Table 1. This section presents brief introduction of the some popular tools used for monitoring network performance.
3.1 BBMonitor BBMonitor[BBMonitor06] is a commercial tool for Windows. It monitors bandwidth usage and internet connection speed test. BBMonitor displays all bandwidth going in and out of the computer, so you can know that all the internet usage is done by you and not either harmful software or hacker. It can test bandwidth easily and efficiently and stores test data into database. You can improve your bandwidth using database result. Also you can create charts using the data in the database. Internet connection behavior can be seen in the display graph. It will display upload and download speed real in time. Figure 3-1 from [BBMonitor06] shows display graph of BBMonitor.
http://www.cse.wustl.edu/~jain/cse567-06/ftp/net_perf_monitors2/index...
4 of 10
Figure 3-1: Screen shot of BBMonitor
3.2 CommView CommView [CommView02] is a commercial tool that runs on any Windows. It monitors Internet and Local Area network activity and captures and analyzes network packet. It collects information about data that passing through the dial-up connection or Ethernet and decodes them. It lists all network connections, local IP and remote IP and examines all individual packets. Figure 3-2 shows result produced CommiView program.
http://www.cse.wustl.edu/~jain/cse567-06/ftp/net_perf_monitors2/index...
5 of 10
Figure 3-2: Result of CommView
3.3 Advanced HostMonitor HostMonitor [HostMonitor05]is anetwork administrator software. It monitors network traffic, Web, FTP, Mail, DNS servers, and file/folder size. It also checks TCP services, disk space, CPU usage, SQL servers and many other things. It put test result in log files and reports. Figure 3-3 shows a result produced by HostMonitor.
http://www.cse.wustl.edu/~jain/cse567-06/ftp/net_perf_monitors2/index...
6 of 10
Figure 3-3: Screen shorts of HostMonitor
3.4 GFI Network Server Monitor GFI Network Server Monitor[GFI04] monitors network for failures or irregularities. It maximizes network availability by monitoring all aspects of Windows and Linux servers, workstations and devices such as routers. When it detects a failure, GFI Network Server Monitor can send alerts via SMS, pager, email or a network message. GFI Network Server Monitor consists of a network monitoring service and a separate management interface. No agent software needs to be installed on the machines you wish to monitor. The Network Monitor Engine is multi-threaded and can run 40 checks at a time. This software architecture allows for high reliability and scalability to monitor both large and small networks. GFI Network Server Monitor can check the status of a terminal server by actually performing a complete login and checking if the session is established correctly. GFI Network Server Monitor can check the availability of all leading database applications. GFI Network Server Monitor includes extensive checks for monitoring Linux servers. All CPU usage, printer availability, file existence, process running, folder size, file size, users and groups membership, disk partition check and disk space can be monitored by GFI Network Serve. GFI Network Server Monitor allows you to store monitoring data to either an SQL Server or MS Access database backend. SQL Server is more appropriate for users with higher monitoring level requirements as well as those who need to centralize the monitoring results of multiple GFI Network Server Monitor installations in one place, such as backups, remote accessing as well as report generation by third party tools such as Crystal Reports or MS Reporting Services. You can check rule status from any location using GFI Network Server Monitor's remote web monitor. You can check critical processes and services on local and remote computers using GFI Network Server Monitor. You can also monitor the CPU usage of a machine.
3.5 Argus http://www.cse.wustl.edu/~jain/cse567-06/ftp/net_perf_monitors2/index...
7 of 10
Argus is a fixed-model Real Time Flow Monitor designed to track and report the status and performance of all network transactions seen in a data network traffic stream [Argus03]. Argus runs on Linux, Solaris, FreeBSD, OpenBSD, NetBSD, and MAC OS X and its client programs have also been ported to Cygwin. Argus provides a common data format for reporting flow metrics such as connectivity, capacity, demand, loss, delay, and jitter on a per transaction basis. The record format that Argus uses is flexible and extensible, supporting generic flow identifiers and metrics, as well as application/protocol specific information. Argus can analyze and report on the contents of packet capture files and it can run as a continuous monitor, examining data from a live interface, generating an audit log of all the network activity seen in the packet stream, providing both push pull data handling models and allowing flexible strategies for collecting network audit data. Argus can be used to monitor individual end-systems, or an entire enterprises network activity. Argus data clients support a range of operations, such as sorting, aggregation, archival and reporting. The network transaction audit data that Argus generates has been used for a wide range of tasks including Security Management, Network Billing and Accounting, Network Operations Management and Performance Analysis.
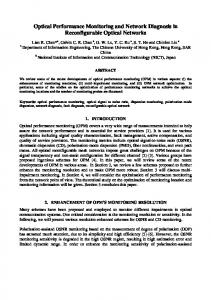
3.6 SmokePing SmokePing [SmokePing02]is a free-open source tool that works on all Unix platforms. It s measures, stores and displays latency, latency distribution and packet loss. It support dynamic IP. Using RRDtool it maintains a long term data-store and presents them into graphs, so we can easily get information of each network connection. SmokePing has a smart alarm system. We can define latency or loss pattern. This pattern will trigger alarms. Figure 3-4 [SmokePing 02] shows graph created by SmokePing.
Figure 3-4 (Open source tools): Graph of SmokePing
3.7 Axence NetVision NetVision [NetVision06] is a commercial tool developed in 2006. It is supported on all operating systems. It monitors servers, applications, TCP/IP services and SNMP devices. Once it runs, in a minute it automatically detects all hosts in the entire network and scans services on them. It present hosts on interactive maps which display all critical information such as service response time, services and host down time, alerts and so on. So problems can be detected and focused easily. It also provides alerts and report about when hosts go down. Figure 3-5 shows an interactive map of NetVision.
http://www.cse.wustl.edu/~jain/cse567-06/ftp/net_perf_monitors2/index...
8 of 10
Figure 3-5: Interactive map of NetVision Back to Table of Contents
4 Summary In This paper, I have made every attempt to include most of well known network performance monitoring tools. Since different tools are utilized to collect different metrics, I present taxonomy of network performance tools according to their application. Finally this paper overviews some popular tools. I hope this survey paper will help you to guide what tools you should select according to your goals. Back to Table of Contents
References 1. [Cotrell06] J Les Cotrell, SLAC, Network Monitoring Tools, October 29, 2006," http://www.slac.stanford.edu/xorg/nmtf/nmtf-tools.html 2. [Zeadally03] S. Zeadally, E. Yaprak, Y. Li, and X. Che (USA), "A Survey of Network Performance Tools for Computer Networking Classes", Computers and Advanced Technology in Education - 2003. 3. [Chiu92] Dha Ming Chiu and Ram Sudama, "Network Monitoring Explained Design and Application", Ellis Horwood 1992. 4. [BBMonitor06] http://www.absolutefuturity.com/BBMonitor.htm Network. Monitoring Tool developed in 06, http://www.absolutefuturity.com/BBMonitor.htm
http://www.cse.wustl.edu/~jain/cse567-06/ftp/net_perf_monitors2/index...
9 of 10
5. [CommView02] http://www.tamos.com/products/commview/ .Network Monitoring Tools developed in 2002 http://www.tamos.com/products/commview/ 6. [SmokePing02] http://oss.oetiker.ch/smokeping/ http://oss.oetiker.ch/smokeping/ 7. [Netvision06] http://www.axencesoftware.com. Network Monitoring Tools Developed in 2006 http://www.axencesoftware.com 8. [Argus03 ] http://www.qosient.com/argus/ http://www.qosient.com/argus/ 9. [HostMonitoring05] http://www.ks-soft.net/hostmon.eng/index.htm .Network Monitoring Tools developed in 2005 http://www.ks-soft.net/hostmon.eng/index.htm 10. [SmokePing 2002] http://oss.oetiker.ch/smokeping/ http://oss.oetiker.ch/smokeping/ 11. [GFI 2004] http://www.gfi.com/nsm/nsmfeatures.htm http://www.gfi.com/nsm/nsmfeatures.htm Back to Table of Contents
List of Acronyms Structure Query Language SQL Autonomous System AS Local Area Network LAN Wide Area Network WAN Domain Name System DNS Transmission Control Protocol / Internet Protocol TCP/IP User Datagram Protocol UDP Operating System OS File Transfer Protocol FTP Back to Table of Contents This report is available on-line at http://www.cse.wustl.edu/~jain/cse567-06/net_perf_monitors2.htm List of other reports in this series Back to Raj Jain's home page
http://www.cse.wustl.edu/~jain/cse567-06/ftp/net_perf_monitors2/index...
10 of 10