Hindawi Publishing Corporation Journal of Electrical and Computer Engineering Volume 2016, Article ID 3095971, 6 pages http://dx.doi.org/10.1155/2016/3095971
Research Article SVM Intrusion Detection Model Based on Compressed Sampling Shanxiong Chen,1 Maoling Peng,2 Hailing Xiong,1 and Xianping Yu1 1
College of Computer and Information Science, Southwest University, Chongqing 400715, China Chongqing City Management Vocational College, Chongqing 400055, China
2
Correspondence should be addressed to Shanxiong Chen;
[email protected] Received 2 October 2015; Accepted 20 January 2016 Academic Editor: Michele Vadursi Copyright © 2016 Shanxiong Chen et al. This is an open access article distributed under the Creative Commons Attribution License, which permits unrestricted use, distribution, and reproduction in any medium, provided the original work is properly cited. Intrusion detection needs to deal with a large amount of data; particularly, the technology of network intrusion detection has to detect all of network data. Massive data processing is the bottleneck of network software and hardware equipment in intrusion detection. If we can reduce the data dimension in the stage of data sampling and directly obtain the feature information of network data, efficiency of detection can be improved greatly. In the paper, we present a SVM intrusion detection model based on compressive sampling. We use compressed sampling method in the compressed sensing theory to implement feature compression for network data flow so that we can gain refined sparse representation. After that SVM is used to classify the compression results. This method can realize detection of network anomaly behavior quickly without reducing the classification accuracy.
1. Introduction With the rapid development of network technology, various Internet-based technologies are widely applied in various industries, leading to great improvement of productive forces. People are enjoying convenience and efficiency brought about by network, and a variety of potential threats are jeopardizing the security of network communication at the same time. At the beginning of network design, people paid more attention to data transmission efficiency and communication convenience and paid less attention to the security of network protocol [1]. Many network protocols are lacking secure communication mechanism; thus, there are naturally a lot of security vulnerabilities in Internet based on these network protocols [2, 3]. With the development of ecommerce, e-government affairs, and other businesses having high demand for security, a variety of network-based security communication protocols appeared, but these protocols are based on TCP/IP architecture, which is a kind of unsafe open system from the basic communication layer [4]. The existing attack techniques and technologies have unceasingly developed with the enhancement of security technology, so in the case of all kinds of inevitable network threats, a current research hotspot on network security is to timely and correctly detect security threats and to take appropriate
treatment, so as to reduce the loss caused by network attacks [5–7]. Compressed sensing is a new data processing theory; there are many important applications in medical image [8] and signal processing [9], communications [10], harmonic detection [11], and so forth. Data acquisition and processing method of compressed sensing theory give rise to great performance improvement of intrusion detection technology [12, 13]. Currently, massive data processing is the performance bottleneck of network software and hardware equipment. In the phase of data acquisition, if the dimension of data can be reduced and characteristic information of network data can be directly obtained, the efficiency of the detection will be greatly improved [14, 15]. SVM intrusion detection technology based on compressed sensing uses the compressed sampling technology of compressed sensing theory to get a small amount of data concerning network behavior characteristics and then uses the support vector machine (SVM) to establish an intrusion detection model, so as to realize rapid judgment of intrusion behavior.
2. Compressed Sensing Theory If there are only 𝐾 nonzero elements in a discrete signal, the signal is considered to be 𝐾 sparse. In view of a nonsparse
2
Journal of Electrical and Computer Engineering
discrete signal 𝑢, the signal can obtain the sparse or nearly sparse representation in the condition of a proper sparse base Ψ ∈ 𝑅𝑁×𝐿 : 𝑢 = Ψ𝑥.
(1)
𝑥 is the sparse or nearly sparse representation of signal 𝑢. According to the CS (compressed sensing) theory, the sampling process of discrete signal is described as below: The signal 𝑢 with a length of 𝑁 is projected 𝑀 times on the sensing matrix Φ {Φ𝑖 , 𝑖 = 1, 2, . . . , 𝑀}, and then the compressed form of the signal can be obtained [16]. Its expression is 𝑦𝑖 = Φ𝑇𝑖 𝑢, 𝑖 = 1, 2, . . . , 𝑀. In order to improve the efficiency of sampling, the frequency of sampling should be reduced as much as possible; usually, 𝑀 < 𝑁. It can be seen that the length of 𝑦 is less than that of 𝑢, so it is called compressed sensing. It is different from traditional data acquisition method that includes acquisition, compression, transmission, and decompression; the compressed sensing theory merely collects the information that best represents data characteristic rather than obtaining a complete signal and high resolution images. Compressed sampling method saves storage space and reduces transmission cost to a great extent. The biggest difference between compressed sensing and traditional data sampling mode is that compressed sensing has realized the compression in the process of data acquisition and reconstruction in the later phase; the traditional mode is to collect complete data information first and then to compress data for storage and transmission. Therefore, the CS theory provides an undersampling mode for data acquisition and can get information in the slower rate compared to Nyquist. The mathematical model of compressed sensing is expressed as below. For signal 𝑢 ∈ 𝑅𝑁×1 , find a linear measurement matrix Φ ∈ 𝑅𝑀×𝑁 (𝑀 < 𝑁) for projection algorithm 𝑦 = Φ𝑢,
(2)
where Φ𝑇1
[ 𝑇] [Φ ] [ 2] Φ=[ ], [ ⋅⋅⋅ ] [ ]
𝑦 = ΦΨ𝑥 = Θ𝑥,
𝑇
(4)
where Θ = ΦΨ, which is still an underdetermined equation; however, under certain constraints, 𝑦 is used to solve 𝑥. Of course, if the signal is sparse, there is no need for sparse transformation; at this point Θ = Φ. In compressed sensing, the signal needs to meet the conditions; one constraint condition is sparse representation, and the other important one is to satisfy the RIP (Restricted Isometry Property) [20]; namely, there is a restricted isometry constant 𝛿𝑠 for the matrix Θ. 𝛿𝑠 is defined as the minimum value to make the equation true. Consider 2 2 2 (1 − 𝛿𝑠 ) V𝑠 2 ≤ ΘV𝑠 2 ≤ (1 + 𝛿𝑠 ) V𝑠 2 .
[Φ 𝑀 ] 𝑢1 [ ] [ 𝑢2 ] ] 𝑥=[ [⋅ ⋅ ⋅] , [ ]
matrix (𝑀 < 𝑁), so it gets involved in a problem of solving an underdetermined equation. And 𝑢 to be solved can have a solution set. Furthermore, the compressed sensing theory shows that, under the specific conditions, 𝑢 is the uniqueness solution, and this solution is obtained through reconstructing 𝑦 that is acquired by compressed sampling [17, 18]. Equation (2) shows the signal sampling mode, and the CS theory suggests that the solution of (2) must ensure that 𝑥 is sparse, so as to solve the equation through 𝐿0 norm minimization problem. In reality, most of the signals are not sparse. The existing theory shows that when a signal is projected on the orthogonal transformation matrix, the absolute value of most transform coefficients is small [19], and the obtained transform vector is sparse or approximately sparse, which is considered as a concise expression of original signal, a prior condition of compressed sensing; namely, the signal must have a sparse representation under some type of transformation. Therefore, sparse transformation base Ψ is established, and the sparse representation of nonsparse signals is completed according to (1). Combined with (1) and (2), compression sampling of the signal 𝑢 can be described as below: equation (2) is used for compressed sampling of the signal 𝑢 to obtain 𝑦, and then (4) is used for 𝑥 sparse solution; ultimately, 𝑥 is used for sparse inverse transformation, so as to reconstruct the signal 𝑢. Consider
(5)
Herein V𝑠 represents 𝑠-order sparse vector.
(3)
[𝑢𝑁] 𝑦1 [ ] [ 𝑦2 ] ] 𝑦=[ [⋅⋅⋅]. [ ] [𝑦𝑀] 𝑦 represents the collected signals. The crux of the problem is to recover signal 𝑢 from signal 𝑦, and Φ is not a square
3. SVM Intrusion Detection Model Based on Compressed Sensing The SVM intrusion detection method based on compressed sensing is to carry out compressed sampling of the tagged training dataset, so as to obtain compressed characteristic data and then to input it into SVM classifier for training, so as to obtain the classification model. In the detection phase, carry out compressed sampling of the untagged dataset, and then reuse the built SVM classification model to classify data, to obtain normal or abnormal access behaviors, and then reconstruct the detected data of normal behaviors, to obtain the complete normal network data flow.
Journal of Electrical and Computer Engineering
3 Measurement matrix and sparse base
Original training data
Data preprocessing
High-dimensional vector set
Low-dimensional vector
Compressed sampling
Training
Testing data
Data preprocessing
High-dimensional vector
Data reconstruction
Normal Detection Abnormal model
SVM classifier
Stopping and further processing
Classification detection Low-dimensional vector
Compressed sampling
Measurement matrix and sparse base
Figure 1: Intrusion detection process based on compressed sensing.
As shown in Figure 1, the steps for intrusion detection based on compressed sensing include the following: (1) Pretreatment of dataset: the compressed sensing theory is to directly sample vector data, so training data and testing data should be expressed in the form of vector. (2) Selection of proper measurement matrix and sparse matrix: measurement matrix and sparse base should meet the conditions of RIP, and data resulting from their compressed sampling must effectively express the original data at the same time. (3) Construction of the SVM classifier: the SVM classifier can use compressed sampling to obtain lowdimensional data, so as to complete classification training, and testing dataset has high detection precision. (4) After performing detection, if network access is normal, the reconstruction algorithm is used to restore detection data to full form before sampling.
4. Experiments and Analysis The experiments used KDD CUP99 dataset. The dataset was collected in a network environment which was established in MIT Lincoln Laboratory, simulating local area network (LAN) of the US Air Force. It includes 9-week TCP dump network connections and system audit data, simulating various types of users, network traffic, and attack technique. The compressed sensing theory request data must be expressed in the form of vector; therefore, each nonnumerical attribute must be converted into a numerical value, and herein the numerical value can simply replace category attributes. Furthermore, in order to eliminate the influence of characteristic dimension on the experimental results, continuous data need to be standardized. The following equation is used for standardization. 𝑆 = {𝑠𝑖𝑗 | 𝑖 = 1, . . . , 𝑁, 𝑗 = 1, . . . , 𝐷} is input data, 𝑁 represents the number of sample datasets,
and 𝐷 represents the characteristic digit of sample data, 𝜇 represents mean value, and 𝜎 is standard deviation of the sample. Therefore, the normalization expression of sample data is as below: 𝑆𝑖𝑗 =
𝑆𝑖𝑗 − 𝜇 𝜎
,
(6)
where 𝜇=
1 𝑁 ∑𝑆 , 𝑁 𝑖=1 𝑖𝑗
𝜎=√
𝑁
(7)
1 ∑ (𝑋 − 𝜇) . 𝑁 − 1 𝑖=1 𝑖𝑗 2
In order to clearly observe the experimental results, we introduced the following indicators for detection performance. Detection rate refers to the ratio between the number of correct attack datasets detected in the testing set and the number of total actual attack datasets; that is, the equation is as below: DR =
the number of attacks detected %. the number of attacks
(8)
False positive rate refers to the ratio between the number of attack datasets being identified by mistake after the test set is detected through the algorithm and the number of total attack datasets detected; that is, the equation is as below: FPR =
the number of false positive %. false positive + true positive
(9)
The experiments adopted 10% training subsets of the KDD CUP99 dataset as training data of the classifier and the test subset tagged correct as test data. We first considered the classifier learning and detection without compressed sampling and then carried out compressed sampling of
4
Journal of Electrical and Computer Engineering Table 1: Detection result of the support vector machine (SVM) as the classifier.
Detection type Noncompressed sampling
Detection rate (%) False positive rate (%)
Normal 98.73 0.87
Probe 97.34 1.03
Dos 99.27 0.92
U2R 94.21 1.08
R2L 99.35 0.92
Detection rate (%) False positive rate (%) Detection rate (%) False positive rate (%) Detection rate (%) False positive rate (%) Detection rate (%) False positive rate (%) Detection rate (%) False positive rate (%) Detection rate (%) False positive rate (%)
98.23 0.82 97.31 1.13 98.12 0.93 97.86 0.88 96.57 1.15 97.33 1.08
96.42 1.19 97.07 1.21 96.94 1.05 96.93 1.06 96.72 1.23 96.24 1.33
97.08 0.96 99.14 1.07 98.71 0.92 98.49 0.91 97.87 0.97 98.39 1.15
90.37 1.26 88.39 1.86 90.84 1.49 89.15 2.12 87.35 2.34 90.08 1.13
97.64 0.98 98.71 0.92 97.75 1.04 98.73 0.94 98.76 0.96 99.01 0.94
Compressed sampling Gaussian random matrix Random Bernoulli matrix Partial Hadamard measurement matrix Toeplitz matrix measurement Structure random matrix Chirp measurement matrix
(i) Probe: surveillance or probe, (ii) DoS: Denial of Service, (iii) U2R: User to Root, and (iv) R2L: Remote to Local.
training data and test data and input it into the SVM classifier for learning and detection. The experimental procedure is as follows: (1) We extract test data from 10% training subsets of the KDD CUP99 dataset. Compressed sampling is to deal with numeric data; it is required to convert nonnumeric data into numeric data in the procedure, except data with attack attribute; namely, attack-type data cannot be converted to numeric data; otherwise, attack-type data cannot be recognized. So the corresponding relation between attribute value of attacktype data and each record should be kept. (2) The KDD CUP99 dataset refers to normal and attack data collected for a long time; from the perspective of the entire data sample, there is a small number of attack datasets, so the standardized dataset is a sparse set, the formed matrix is a sparse matrix, and there is no need for sparsification. (3) In the experiment, multiple measurement matrices are directly used for compressed sampling of training set: Gaussian random matrix, random Bernoulli matrix, partial Hadamard measurement matrix, Toeplitz measurement matrix, structure random matrix, and Chirp measurement matrix. (4) The compressed data obtained are, respectively, input into the SVM-constructed classifier for training, thus forming a training model. (5) The corrected subsets of KDD CUP99 dataset are selected as test set. Herein carry out normalized conversion of test data; namely, convert nonnumeric data into numerical data for compressing sampling, and then input compressed data into the training model for detection.
Table 1 shows the results of using the SVM-constructed classifier for intrusion detection of different sampling matrixes through 30 times of sampling. Table 1 showed the results of using the compressed sampling method for intrusion detection and of using the noncompressed sampling method to directly input it into the classifier for training and detection. It can be seen from Table 1 that the results obtained through two methods were similar. For the traditional method of compressed sampling, the detection rate of five types, that is, Normal, Probe, Dos, U2R and R2L, was more than 98% except that of U2R. Under the condition of compressed sensing, the detection rate obtained by using different sampling matrixes was around 98%. Only the detection rate obtained by using the compressed sampling method for U2R attack-type data was lower, and the false positive rate was higher. After further analysis, it was found that the traditional method for U2R attack-type data had a low detection rate, which was related to dataset itself, less U2R type data, and deviation of the training model. In reality, the use of compressed sensing method cannot greatly improve the detection rate but can increase the efficiency of training and detection by reducing dimension data. Figure 2 showed training and detection time under different sampling matrixes after 30 times of sampling. Figure 2 showed that, after the method of compressed sampling was used for information processing of KDD CUP99 dataset, time used for training and inspection was reduced. In particular, it can be found that for data obtained through using the Gaussian random matrix for compressed sampling its training and detection time is decreased greatly for four classifiers of detection. Besides attack-type attribute, the KDD CUP99 dataset has 41D characteristics, and matrixes are used for compressed sampling of 41D characteristics. However, compressed sampling also affects detection precision. In theory, the higher the degree of compression is, the shorter the model’s training and detection time is, affecting detection precision. In further
Journal of Electrical and Computer Engineering
5
1400 100 1200 80 Detection rate
1000
(s)
800 600
60 40
400 200 Chirp measurement matrix
Structure random matrix
Toeplitz matrix measurement
Partial Hadamard measurement matrix
Random Bernoulli matrix
Noncompressed sampling
Gaussian random matrix
20
0
Training time Detection time
Figure 2: Training and detection time.
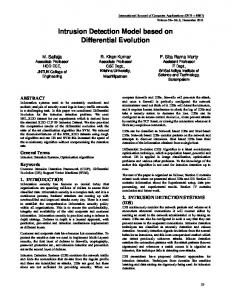
experiments, we analyzed the relationship between compression degree and detection precision. For convenience of representation, the detection rate for DoS attack was selected for analysis. In the experiments, there are six sampling matrixes, respectively, under different sampling frequencies, so SVM method was used to obtain the detection rate of the corrected dataset according to sampling matrixes. Sampling frequencies were 10, 15, 20, . . . , 40. The dimension of KDD CUP99 data was 41D, so there was basically no compressed sampling under the condition of sampling frequency of 40. It can be seen from Figure 3 that, under the condition of low sampling frequency, the SVM-constructed classifier had lower DoS detection precision. Based on the compressed sensing theory, in order to perfectly express data, sampling frequency 𝑀 must have particular relations; that is, 𝑀 ≥ 𝐶 ⋅ 𝑘 ⋅ log 𝑁. In general, four times of data sparseness are selected as the sampling frequency. The figure showed that, under the low sampling frequency, the detection rate was lower; with the increase of sampling frequency, the detection rate was increased accordingly. When the sampling frequency was up to 30 or so, the detection rate tended to be stable. At this time, the low-dimensional data obtained through compressed sampling of KDD CUP99 dataset can effectively express the original high-dimensional data. Thus, DoS detection rate is approximate to the detection rate obtained by using the method of noncompressed sampling. However, with the further increase of sampling frequency, there was no significant change of detection rate.
5. Conclusion Intrusion detection needs to deal with massive network data, leading to low detection efficiency. In the paper, the
10
20
30
40
Sampling frequency Gaussian random matrix Random Bernoulli matrix Partial Hadamard measurement matrix Toeplitz matrix measurement Structure random matrix Chirp measurement matrix
Figure 3: Detection rate of the 𝐾-nearest neighbor algorithm as a classifier for DoS attack.
compressed sensing technology was applied to realize network data compression, and the SVM method was used to anomalously detect the compressed data. We have arrived at a conclusion that, relative to direct use of the classifier for learning and detection of training set and testing set, the intrusion detection model established through compressed sensing had no significant change of detection rate and false positive rate, but training and detection time was greatly reduced, which is the key to detect network data flow. A large number of network datasets need rapid and real-time detection, so it can be seen that intrusion detection based on compressed sensing has provided a real-time network security protection mechanism.
Competing Interests The authors declare that they have no competing interests.
Acknowledgments This work was supported by the National Natural Science Foundation of China (61303227), the Fundamental Research Funds for the Central Universities (XDJK2014C039, XDJK2016C045), and Postdoctoral Fund of Southwestern University (swu1114033).
References [1] A. P. Lauf, R. A. Peters, and W. H. Robinson, “A distributed intrusion detection system for resource-constrained devices in ad-hoc networks,” Ad Hoc Networks, vol. 8, no. 3, pp. 253–266, 2010.
6 [2] S. Raza, L. Wallgren, and T. Voigt, “SVELTE: Real-time intrusion detection in the Internet of Things,” Ad Hoc Networks, vol. 11, no. 8, pp. 2661–2674, 2013. [3] T. Zhang, E. Lee, and J. K. Seo, “Anomaly depth detection in trans-admittance mammography: a formula independent of anomaly size or admittivity contrast,” Inverse Problems, vol. 30, no. 4, Article ID 045003, 2014. [4] D.-S. Pham, S. Venkatesh, M. Lazarescu, and S. Budhaditya, “Anomaly detection in large-scale data stream networks,” Data Mining and Knowledge Discovery, vol. 28, no. 1, pp. 145–189, 2014. [5] R. Puzis, M. Tubi, Y. Elovici, C. Glezer, and S. Dolev, “A decision support system for placement of intrusion detection and prevention devices in large-scale networks,” ACM Transactions on Modeling and Computer Simulation, vol. 22, no. 1, 2011. [6] S. Chen, S. Wu, Y. Cao, and D. Tang, “An intrusion detection model based on non-negative matrix factorization,” Applied Mechanics and Materials, vol. 148-149, pp. 895–899, 2012. [7] V. Chandola, A. Banerjee, and V. Kumar, “Anomaly detection: a survey,” ACM Computing Surveys, vol. 41, no. 3, article 15, 2009. [8] J. Haupt, W. U. Bajwa, G. Raz, and R. Nowak, “Toeplitz compressed sensing matrices with applications to sparse channel estimation,” IEEE Transactions on Information Theory, vol. 56, no. 11, pp. 5862–5875, 2010. [9] L. B. Montefusco, D. Lazzaro, S. Papi, and C. Guerrini, “A fast compressed sensing approach to 3D MR image reconstruction,” IEEE Transactions on Medical Imaging, vol. 30, no. 5, pp. 1064– 1075, 2011. [10] Y. Wiaux, G. Puy, and P. Vandergheynst, “Compressed sensing reconstruction of a string signal from interferometric observations of the cosmic microwave background,” Monthly Notices of the Royal Astronomical Society, vol. 402, no. 4, pp. 2626–2636, 2010. [11] F. Bonavolont`a, M. D’Apuzzo, A. Liccardo, and G. Miele, “Harmonic and interharmonic measurements through a compressed sampling approach,” Measurement, vol. 77, pp. 1–15, 2016. [12] D. L. Donoho, “Compressed sensing,” IEEE Transactions on Information Theory, vol. 52, no. 4, pp. 1289–1306, 2006. [13] D. L. Donoho, A. Maleki, and A. Montanari, “The noisesensitivity phase transition in compressed sensing,” IEEE Transactions on Information Theory, vol. 57, no. 10, pp. 6920–6941, 2011. [14] R. Bhargavi and V. Vaidehi, “Semantic intrusion detection with multisensor data fusion using complex event processing,” Sadhana—Academy Proceedings in Engineering Sciences, vol. 38, no. 2, pp. 169–185, 2013. [15] W. J. An and M. G. Liang, “A new intrusion detection method based on SVM with minimum within-class scatter,” Security and Communication Networks, vol. 6, no. 9, pp. 1064–1074, 2013. [16] E. J. Cand`es, “The restricted isometry property and its implications for compressed sensing,” Comptes Rendus Mathematique, vol. 346, no. 9-10, pp. 589–592, 2008. [17] K. Takeda and Y. Kabashima, “Statistical mechanical assessment of a reconstruction limit of compressed sensing: toward theoretical analysis of correlated signals,” EPL, vol. 95, no. 1, Article ID 18006, 2011. [18] L. Zelnik-Manor, K. Rosenblum, and Y. C. Eldar, “Sensing matrix optimization for block-sparse decoding,” IEEE Transactions on Signal Processing, vol. 59, no. 9, pp. 4300–4312, 2011. [19] Y. Zhao, Y. H. Hu, and H. Wang, “Enhanced random equivalent sampling based on compressed sensing,” IEEE Transactions on
Journal of Electrical and Computer Engineering Instrumentation and Measurement, vol. 61, no. 3, pp. 579–586, 2012. [20] E. J. Candes and Y. Plan, “A probabilistic and RIPless theory of compressed sensing,” IEEE Transactions on Information Theory, vol. 57, no. 11, pp. 7235–7254, 2011.
International Journal of
Rotating Machinery
Engineering Journal of
Hindawi Publishing Corporation http://www.hindawi.com
Volume 2014
The Scientific World Journal Hindawi Publishing Corporation http://www.hindawi.com
Volume 2014
International Journal of
Distributed Sensor Networks
Journal of
Sensors Hindawi Publishing Corporation http://www.hindawi.com
Volume 2014
Hindawi Publishing Corporation http://www.hindawi.com
Volume 2014
Hindawi Publishing Corporation http://www.hindawi.com
Volume 2014
Journal of
Control Science and Engineering
Advances in
Civil Engineering Hindawi Publishing Corporation http://www.hindawi.com
Hindawi Publishing Corporation http://www.hindawi.com
Volume 2014
Volume 2014
Submit your manuscripts at http://www.hindawi.com Journal of
Journal of
Electrical and Computer Engineering
Robotics Hindawi Publishing Corporation http://www.hindawi.com
Hindawi Publishing Corporation http://www.hindawi.com
Volume 2014
Volume 2014
VLSI Design Advances in OptoElectronics
International Journal of
Navigation and Observation Hindawi Publishing Corporation http://www.hindawi.com
Volume 2014
Hindawi Publishing Corporation http://www.hindawi.com
Hindawi Publishing Corporation http://www.hindawi.com
Chemical Engineering Hindawi Publishing Corporation http://www.hindawi.com
Volume 2014
Volume 2014
Active and Passive Electronic Components
Antennas and Propagation Hindawi Publishing Corporation http://www.hindawi.com
Aerospace Engineering
Hindawi Publishing Corporation http://www.hindawi.com
Volume 2014
Hindawi Publishing Corporation http://www.hindawi.com
Volume 2014
Volume 2014
International Journal of
International Journal of
International Journal of
Modelling & Simulation in Engineering
Volume 2014
Hindawi Publishing Corporation http://www.hindawi.com
Volume 2014
Shock and Vibration Hindawi Publishing Corporation http://www.hindawi.com
Volume 2014
Advances in
Acoustics and Vibration Hindawi Publishing Corporation http://www.hindawi.com
Volume 2014