Personal use is permitted, but republication/redistribution requires IEEE permission. See ... Ideally, while multiple virtual machines (VM) share the same physical ...
This article has been accepted for publication in a future issue of this journal, but has not been fully edited. Content may change prior to final publication. Citation information: DOI 10.1109/TPDS.2014.2325564, IEEE Transactions on Parallel and Distributed Systems 1
Swiper: Exploiting Virtual Machine Vulnerability in Third-Party Clouds with Competition for I/O Resources Ron C. Chiang, Sundaresan Rajasekaran, Nan Zhang, H. Howie Huang George Washington University {rclc, sundarcs, nzhang10, howie}@gwu.edu Abstract—The emerging paradigm of cloud computing, e.g., Amazon Elastic Compute Cloud (EC2), promises a highly flexible yet robust environment for large-scale applications. Ideally, while multiple virtual machines (VM) share the same physical resources (e.g., CPUs, caches, DRAM, and I/O devices), each application should be allocated to an independently managed VM and isolated from one another. Unfortunately, the absence of physical isolation inevitably opens doors to a number of security threats. In this paper, we demonstrate in EC2 a new type of security vulnerability caused by competition between virtual I/O workloads - i.e., by leveraging the competition for shared resources, an adversary could intentionally slow down the execution of a targeted application in a VM that shares the same hardware. In particular, we focus on I/O resources such as hard-drive throughput and/or network bandwidth - which are critical for data-intensive applications. We design and implement Swiper, a framework which uses a carefully designed workload to incur significant delays on the targeted application and VM with minimum cost (i.e., resource consumption). We conduct a comprehensive set of experiments in EC2, which clearly demonstrates that Swiper is capable of significantly slowing down various server applications while consuming a small amount of resources. Keywords—cloud computing, virtualization, scheduling
F
Dora the Explorer1 : ”Swiper, no swiping!” Swiper the Fox: ”You are too late.”
1
I NTRODUCTION
A cloud computing system offers to its users the illusion of “infinite” computing and storage capacities on an on-demand basis [1]. Examples of commercial cloud computing platforms include Amazon Elastic Compute Cloud (EC2) and Simple Storage Service (S3), Google AppEngine, Microsoft Azure, etc. Virtualization [2] plays a vital role in cloud computing. In particular, for the purpose of scalability and flexibility of resource delivery, a cloud computing system does not provide each user with a different physical machine - instead, it allocates each user to an independently managed virtual machine (VM) which can be dynamically created, modified, and migrated. Examples of such a platform include Xen VM for Amazon EC2 and the .NET-based run-time environment for Microsoft Azure. The essence of virtualization is that multiple VMs may multiplex and share the same physical resources (e.g., CPU, cache, DRAM, and I/O devices). Nonetheless, each VM is supposed to enjoy isolation (in terms of security and performance) from the other VMs. That is, different VMs should not be able to interfere with the executions of each other. Unfortunately, the lack of physical isolation can indeed pose new security threats to co-located VMs. In this paper, we consider a new type of VM vulnerability 1. Swiper the Fox is a cartoon character in the animated series of Dora the Explorer, who often sneaks up to Dora and Boots and takes away the items that are needed for Dora’s adventures.
which enables a malicious user (i.e., VM) to exploit the resource contention between co-located VMs and obstruct the execution of a targeted application running in a separate VM that is located on the same physical machine as the malicious one. In particular, we focus on exploiting contentions on shared I/O resources that are critical to data-intensive applications - e.g., hard disks and networks. In practice, service providers often exclude such threats from their service level agreement (SLA) [3]. That is, customers are solely responsible for their loss caused by resource contention from co-located VMs. Most service providers do not enable dynamic migration for user control [4]. Even if a customer suspects an attack and wants to move affected VMs away, they need to shutdown and restart all affected VMs. Therefore, an attack from Swiper may incur nontrivial loss in business by introducing service degradation or interruption, e.g., Amazon.com would lose sales by 1% for every 100 ms delay in page load time and a similar test at Google also revealed that a 500 ms increase in displaying the search results could reduce revenue by 20% [5]. Note that the main concern of this work is performance degradation caused by co-located adversaries, rather than information leakage which has been the main focus for vulnerability studies in cloud-computing systems [6]. Performance degradation is critical because it directly increases the cost of per workload completed in cloud [7]–[18]. On the other hand, the existing work on performance-degradation analysis were conducted on non-virtualized environments (e.g., for CPU, DRAM, hard disk, and network usage [19]) and cannot be directly applied to VMs. For example, a relevant prior
1045-9219 (c) 2013 IEEE. Personal use is permitted, but republication/redistribution requires IEEE permission. See http://www.ieee.org/publications_standards/publications/rights/index.html for more information.
This article has been accepted for publication in a future issue of this journal, but has not been fully edited. Content may change prior to final publication. Citation information: DOI 10.1109/TPDS.2014.2325564, IEEE Transactions on Parallel and Distributed Systems 2
work that proposed to exploit the contention on harddisks [20] required access to the hard-disk queue in order to analyze the requests from both the adversary and the victim. However, this queue cannot be directly accessed by VMs, rendering such exploitation no longer applicable. In this work, we design and implement Swiper, a framework that exploits the virtual I/O vulnerability in three phases: 1) co-location (“sneaking-up”): place the adversary VM on the same physical machine as the victim VM; 2) synchronization (“getting-ready”): identify whether the targeted application is running on the victim VM and, if so, the state of execution for the targeted application (which we shall elaborate below); and 3) exploiting (“swiping”): design an adversarial workload according to the state of the victim application, and launch the workload to delay the victim. The main contributions of this paper are listed as follows: • An I/O-based co-location detection technique and verified its effectiveness on public clouds. • A discrete Fourier transformation (DFT) based algorithm which recovers the victim’s original I/O pattern from the observed (distorted) time-series of I/O throughout, and then determines if the victim application has reached a pre-determined point when it is most vulnerable to an exploitation. • Discover patterns which cause maximum interference. • A theoretical framework to observe and synchronize with predefined I/O patterns. • A comprehensive set of experiments on Amazon EC2 - with the results clearly showing that Swiper is capable of degrading various server applications by 22.54% on average (and up to 31%) for different instance types and benchmarks, while keeping the resource consumption to a minimum. The remainder of this paper is organized as follows. Sec. 2 introduces the system and threat models. Sec. 3 presents our IO-based co-location detection method. Sec. 4 describes our approach, and explains the synchronization and exploiting stages. Sec. 5 discusses issues in practicing Swiper. Sec. 6 presents the experiments and results, including VM co-location in Amazon EC2. We conclude in Sec. 7. Interested readers may also access the Appendices for additional details on the design, implementation and evaluation.
2 T HREAT M ODEL In general, a cloud computing system provides its endusers with a pool of virtualized computing and I/O resources supported by a large amount of distributed, heterogeneous, commodity computers. For example, Amazon EC2 is using Xen virtualization, whose architecture and terminology are described in Appendix A. For I/Os, VMs utilize the device drivers (the frontend drivers) in the guest OS to communicate with the backend drivers in DOM0 , which access the physical devices,
e.g., hard drives and networks, on behalf of each VM. In other words, application I/Os within a VM - which basically consist of block reads and writes to the virtual disks - are translated by the virtualization layer to system calls in the host OS, such as requests to the physical disks. In Xen, the hypervisor and DOM0 work together to ensure security isolation and performance fairness among all VMs. While fairness in CPU and memory virtualization is relatively easy to achieve, in this paper we show that maintaining performance isolation for virtual I/O can be extremely challenging - which opens doors for security threats. In this work, we also evaluate our framework on KVM (Kernel-based Virtual Machine) that utilizes hardware assisted full virtualization instead of Xen’s paravirtualization. Although Xen and KVM are used to demonstrate this threat in our work, our test and previous work indicate that other virtualization framework like VMware also exhibits similar interference problem [21]. 2.1
Problem Definition
A straightforward way to delay a victim process is to launch an attacking process which constantly requests a large amount of resources shared with the victim (e.g., I/O bandwidth). Nonetheless, such an attack can be easily detected and countered (e.g., a dynamic resource allocation algorithm can restrict the amount of resources obtained by each process). Thus, our focus in this paper is to incur the maximum delay to the victim while maintaining the resource request from the attacker to a pre-determined (low) threshold. Prior Knowledge of the Adversary: Since the adversary now has to target the attack specifically to the victim process (instead of blindly delaying all processes sharing the resource), it has to possess certain characteristics of the victim process which distinguishes it from others. For the purpose of this paper, we consider the case where the adversary holds the trace of resource requests from the victim process as the “fingerprint” of the victim. Research on cross-VM side channels can be used to sustain this assumption [22]–[25] - malicious VMs are able to retrieve a variety of information, such as data and instruction caches, I/O usage profile, and even private keys, from co-located VMs and hosts via side channels. The techniques for co-location detection in Sec. 3 can also be adapted to profile I/O access patterns as well. We plan to extend the profiling technique as future work. In the experiment section, we shall demonstrate that the various workloads we tested all exhibit unique resourcerequest time-series that can be easily distinguished from others. Limits on the Adversary: Many cloud computing systems charge by the amount of resource requests. For example, Amazon Elastic Block Store (EBS) charges $0.1 - $0.11 per 1 million I/O requests and Amazon EC2, on the other hand, charges by total network consumption - i.e., the
1045-9219 (c) 2013 IEEE. Personal use is permitted, but republication/redistribution requires IEEE permission. See http://www.ieee.org/publications_standards/publications/rights/index.html for more information.
This article has been accepted for publication in a future issue of this journal, but has not been fully edited. Content may change prior to final publication. Citation information: DOI 10.1109/TPDS.2014.2325564, IEEE Transactions on Parallel and Distributed Systems 3
amount of data transferred in and out of the system [26]. Thus, the adversary must minimize the amount of resource request initiated by itself. In this paper, we consider a pre-determined upper bound on the total resource consumption by the adversary. Problem Statement: Given a workload fingerprint of a victim process, determine an adversarial workload of I/O request which incurs the maximum delay on the victim process without exceeding the pre-determined threshold on the adversary’s own resource consumption.
3
I/O-BASED C O -L OCATION D ETECTION
In this work, we use Amazon EC2 as one testing platform to carry out experiments. As we focus on vulnerability with competition for I/O resources, we choose two types of Amazon EC2 instances, micro and small, to be the experiment instance types. Please refer to Appendix B for the introduction of Amazon EC2. The co-location detection mainly consists of two stages: Probing and Locking-on. Probing: An adversary can locate the geographical zone of a victim process by the victim’s IP information [6]. To conveniently manage separate networks for all availability zones, Amazon EC2 partitions internal IP address space between availability zones. Administration tasks will be more difficult if the internal IP address mapping changes frequently. Because different ranges of internal IP address represent various availability zones and public IP addresses can be mapped to private IP addresses by DNS, an adversary can easily locate the availability zone of a victim, thus greatly reduce the number of instances needed before achieving a colocation placement. Once an adversary knows the availability zone of a victim, it uses network probing to check for the coresidence. In general, if an adversary and a victim are co-located, they are likely to have 1) identical DOM0 IP address, and 2) small packet round-trip times (RTT). Therefore, an adversary can create several probing instances to perform a TCP SYN traceroute operation to a victim’s open service port. If one probing instance and the victim were co-located, they would share the same DOM0 and there would be only a single hop to the victim with a small RTT. In our experience, if the RTT is smaller than half of the average RTT of all onehop instances in the same zone, the probing instance is very likely on the same physical machine as the victim. Locking-on: Co-location on the same physical machine does not necessarily mean the sharing of the I/O resources - co-located VMs may end up using different storage types. In our tests, if two co-located VMs do not share one hard drive, launching a workload to compete for I/O resources shows limited effect on I/O throughput. On the other hand, if two instances share the same storage device and both try to max out the bandwidth, they can only get part of the total bandwidth. Prior
works also have shown similar interference effect in virtualized environments [27]–[29]. Because the adversary knows its performance under a given I/O workload, for it to confirm the I/O sharing, it needs a VM instance that would potentially co-locate with the victim and try to compete for I/O resources. The adversary then can simply measure the I/O performance and an obvious performance degradation would be a strong indicator of VM co-location. The proposed lock-on approach is feasible on public clouds. For example, our experiments on Amazon EC2 us-east-1c zone show the success rates of about 8% and 2% for the probing and the locking-on stages respectively. After locking-on a victim, a smart adversary does not just launch a huge workload to compete for resources. This naive method leads to ineffective attacks and wastes time and money. Therefore, we develop a synchronization method in the following sections to assure accurate attacking time. As we will show later, this method generates a more severe performance degradation and uses less resources than the naive method.
4
S WIPER
FOR A
T WO -PARTY S YSTEM
We start with a simple scenario where the resource is only shared between two parties, i.e., the attacker and the victim. There are two critical challenges for incurring the maximum delay to a victim - synchronization and adaptive attack, which we explain respectively as follows: • Synchronization: In order for the adversary to incur the maximum delay under a resource constraint, it has to be able to (1) determine whether the victim process is running, and (2) predict the resource request from the victim process at a given time. • Adaptive Attack: Based on the result of synchronization, the adversary should align its resource request (i.e., attack) with the victim. In general, the higher demand the victim has at a given time, the larger request the adversary should submit to the shared resource. In the following, we shall describe our main ideas for addressing the two challenges respectively. Note that we focus on the synchronization and attack phases in this section, and discuss the design of the co-location phase in Sec. 3. Readers who are interested in the Swiper for a multi-VM system may consult Appendix E. 4.1
Main Ideas for Synchronization
In this paper we consider a simple adversarial strategy of conducting an observation process with a sequential read operation. We chose read over write because the timeseries of throughput allocated to write operations tend to have sharp bursts, which would make the synchronization significantly more difficult. Both sequential and random reads in our tests yield similar results in terms of the accuracy of synchronization. We chose sequential
1045-9219 (c) 2013 IEEE. Personal use is permitted, but republication/redistribution requires IEEE permission. See http://www.ieee.org/publications_standards/publications/rights/index.html for more information.
This article has been accepted for publication in a future issue of this journal, but has not been fully edited. Content may change prior to final publication. Citation information: DOI 10.1109/TPDS.2014.2325564, IEEE Transactions on Parallel and Distributed Systems 4
4.2
Performance Attack
Based on the result of synchronization, we consider a performance attack which launches multiple segments of sequential read operations to delay the victim process. Each segment persists for a fixed, pre-determined, amount of time. In the following, we discuss three critical issues related to the design of such a performance attack: (1) when should each segment be launched, (2) how long should each segment persist, and (3) why should each segment use a sequential read operation. Positioning of Attack Segments: To incur the maximum delay to the victim process, the attack segments should be positioned to cover the moments of peak requests from the victim process. Thus, to position h attack segments each persisting for ` seconds, we use a greedy algorithm which first locates the `-second interval in v(t) which has not yet been executed and has the maximum total request, i.e., finds the start of interval tS 2 [ob to↵ , N 1] such that tS = arg max t
t+` X
v(i),
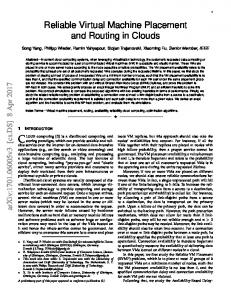
Length of Attack Segments: Somewhat surprisingly, our experiments (as we shall present in Sec. 6) show that as long as each attack segment covers a peak of the victim’s request, the length of the attack segment does not have a significant impact on the delay incurred to the victim process. Intuitively, this is because the length of the attack which does not overlap with the peaks of victim’s request incurs little delay to the victim. Nonetheless, this does not mean that the adversary should set each attack segment to be as short as possible - Instead, it has to take into account the estimation error of synchronization, and make the attack segment long enough to ensure the coverage of the peaks. Operations of Attack Segments: Each attack segment may perform four types of operations: sequential read, random read, sequential write, and random write. We choose the sequential read operation due to the following reasons. First, we excluded the write operations from consideration for the same reason as that discussed for the design of the observation process: write operations tend to introduce sharp bursts on throughput, which makes it difficult to be synchronized with the victim’s peak requests. We chose sequential read over random read because a random read operation is unlikely to sustain a high throughput to “compete” with the victim process and delay it. One note of caution is that, while each attack segment should perform a sequential read operation, the adversary must ensure that consecutive (but different) attack segments do not read sequentially on adjacent blocks. This is because the hard drive or operating system may pre-fetch the latter blocks while performing the previous attack segment. As a result, the latter attack segment does not actually incur any I/O to the hard drive, incurring no delay on the victim process. To address this issue, a simple attack strategy is for each segment to first randomly choose one from a set of files, and then read the file sequentially. Figure 1 shows an example trace when Swiper issues overlapping sequential read operations to slowdown an co-located FileServer. When comparing Figure 1 with the unaffected trace, we found Swiper issues most I/O operations when victim issues as well. In addition, victim’s trace has been obviously distorted to certain degree. We will further analyze the performance decreases in Sec. 6.
MBs
read over random read because the latter is rarely the behavior of a normal user and therefore may be detected by the cloud computing system. Before describing the details for synchronization, we first introduce a few basic notions: Recall that the adversary holds as prior knowledge of the I/O request time series from the victim (when no other process is running). Let v(t) be the bandwidth requested by the victim at t seconds after the victim starts running. At run-time, let tob (seconds) be the length of the observation process (where ob stands for observation length) and a(t) (t 2 [1, ob]) be the (observed) throughput allocated to the adversary for the t-th second since the observation process starts. Let aU be the (upper bound on) throughput for the sequential read operation when no other process is running. The objective of synchronization is for the adversary to align the pre-known v(t) with the observed timeseries aU a(t). In the ideal case, aU a(t) would be a concatenation of two sub series: one with zero readings (i.e., when the victim has not yet started running or has finished running), and a sub-sequence of v(t). In practice, however, additive noise and rescaling on both time and throughput may be applied, leading to a requirement on aligning v(t) with aU a(t) with offset, stretching, and scaling factors. Appendix C provides the complete definition of these three factors, and Appendix D explains our main theory for addressing the challenge of synchronization.
(1)
victim
0
10
20
30
40
attacker
50
60
70
80
90
100
Runtime (sec)
i=t
and then repeat this process after removing interval [tS , tS + `] from consideration, until all h intervals are found. Note that there must be tS ob to↵ because by the end of the observation process, the first ob to↵ seconds of the victim process have already passed and thus cannot be attacked.
25 20 15 10 5 0
Fig. 1: Overlapping I/O of an attacker and a victim
5
P RACTICAL I SSUES
IN
R UNNING S WIPER
We have established a framework to locate and interfere with target VMs, including a theory for syn-
1045-9219 (c) 2013 IEEE. Personal use is permitted, but republication/redistribution requires IEEE permission. See http://www.ieee.org/publications_standards/publications/rights/index.html for more information.
This article has been accepted for publication in a future issue of this journal, but has not been fully edited. Content may change prior to final publication. Citation information: DOI 10.1109/TPDS.2014.2325564, IEEE Transactions on Parallel and Distributed Systems 5
chronizing I/O patterns. There are critical issues that need to be addressed when deploying Swiper in realworld. We explicitly discuss two important factors in this section. First, some applications’ activities depend on user inputs. Thus, we talk about how to deal with such non-determinism in Sec. 5.1. Second, migration is an important feature for virtualized systems to manage resources. Co-locating the target and attacker is critical in the proposed method. Since the target VM could be migrated thereafter, we discuss migration in Sec. 5.2. 5.1
Non-Deterministic User Behavior
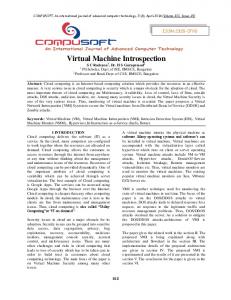
Some applications’ activities, e.g., Twitter and Wikipedia, are generated by users. Although one person may not repeat the same behavior hour after hour and day after day, a recent study on a Twitter trace revealed that aggregate workload demonstrates much more predicable I/O activities than single user’s, i.e., similar aggregate I/O activities in one hour may occur at the same hour tomorrow and next week [30]. A previous analysis on long-term traces from Amazon Web Services and Google App Engine also found yearly and daily patterns [31]. Although historical traces could help in predicting I/O behaviors, self-learning and adaptivity to new I/O patterns are still good to have in a fast-changing world. Swiper can be easily extended to deal with nondeterministic workloads by integrating with a pattern repository and learning module. Figure 2 demonstrates a high level sample architecture of an extended Swiper. With this extended design, Swiper can adjust various Start
Pattern repository
Monitoring Co-located VMs
Known pattern?
Clustering and Learning
No
Log trace
Yes
Synchronize and Attack
Fig. 2: An extended Swiper architecture for dealing with nondeterministic workloads
parameters, e.g. the stretching factor, and capture more patterns to improve its success rate. We examine Swiper with non-deterministic workloads in Sec. 6.2. Note that designing clustering and learning methods for Swiper may by itself a new research topic. Thus we leave them as future works. 5.2
VM Migration
While live migration is a possible method of mitigating the interference from co-located workloads without service interruption, it does not come without a price. Indeed, previous work have shown that the performance may be substantially affected during migration [32]– [34]. For I/O-intensive applications in particular, since data can be stored or cached on high performance local
storage to reduce the access latency, VM migration can be even more costly - lasting several minutes to hours depending on the size of VM virtual storage that is stored locally. Alternatively, a practical method for reducing the migration time is to only migrate the computing instance (CPU and memory states) and keep VMs virtual disks on networked storage. For such setting, our experiments in Sec. 6.3 show that it is possible for Swiper to locate and impede the target VM again. In this case, a critical problem for the adversary is the cost because now the attacker needs to launch a number of probing VMs to search for the target after the VM migration. Note that this cost can be minimal in the cases that the adversary already held many hacked user accounts, which had happened before - e.g., in [35].
6
E XPERIMENT R ESULTS
Because a substantial portion of Amazon EC2’s address space hosts publicly accessible web servers [6], we test Swiper with the following popular cloud applications or benchmarks: YCSB (Yahoo! Cloud Serving Benchmark) is a performance measurement framework for cloud data serving [36]. YCSB’s core workload C is used to emulate read-intensive applications; Wiki-1 and Wiki2 are running Wikibench [37] with real Wikipedia request traces on the first day of September and October 2007 respectively; Darwin is an open source version of Apple’s QuickTime media streaming server; FileServer mimics a typical workload on a file system, which consists of a variety of operations (e.g., create, read, write, delete) on a directory tree; VideoServer emulates a video server, which actively serves videos to a number of client threads and uses one thread to write new videos to replace obsolete videos; WebServer mostly performs read operations on a number of web pages, and appends to a log file. The FileServer, VideoServer and WebServer belong to the FileBench suite [38]. Micro and small Amazon EC2 instances and a local machine are used as the test platforms in this work. We use technique described in Sec. 3 to locate Amazon EC2 instances, which dwell in the same storage device. The tests are repeated for 50 times and the means are reported. To evaluate the effectiveness of an attack, we define three metrics: 1) the slowdown/decrease in percentage of the victim, S, which assesses the overall effect of an attack. This can be measured as the runtime in seconds or the throughput in KB. 2) the victim slowdown divided by the total runtime (in seconds) of the attacker, SAT , which determines the impact of the length of an attack. A bigger SAT indicates that an attacker can infiltrate large damages within a shorter time window. 3) the victim slowdown divided by the total throughput (in MB) of the attacker, SAC , which evaluates the effect of the bandwidth consumption of an attacker. A bigger SAC means that an attack is effective while consuming a smaller amount of bytes.
1045-9219 (c) 2013 IEEE. Personal use is permitted, but republication/redistribution requires IEEE permission. See http://www.ieee.org/publications_standards/publications/rights/index.html for more information.
This article has been accepted for publication in a future issue of this journal, but has not been fully edited. Content may change prior to final publication. Citation information: DOI 10.1109/TPDS.2014.2325564, IEEE Transactions on Parallel and Distributed Systems 6
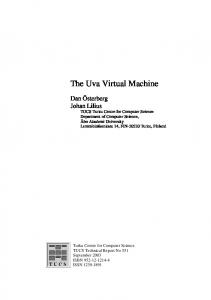
Amazon EC2 instances: We first demonstrate our tests on Amazon EC2. To minimize cache effect and max out the bandwidth, we make the total file size of all four benchmarks larger than double of the memory size. Namely, the working set size of each benchmark is 4 GB on the micro and 8 GB on the small instance in this experiment. Figure 16 in Appendix H shows runtime increases of benchmarks on micro and small instances when the attacker is restricted with 2 and 4 GB data limit to interfere with the victim on the micro and small instance respectively. Recall that naive attack exhausts the bandwidth within the given time or data constraints and random attack launches I/O requests at stochastic time points. The naive attack shows little to none effect on runtime increase of the victim workload. The average runtime increases caused by the naive attack are 6 and 14% on micro and small instance respectively. The random attack is better than the naive one because there are chances for the random attack to hit the peak of the victim workload. The random attack increases victims’ runtime by 35 and 57% on micro and small instance respectively. The peak attack has the best results, which are 67 and 100% on micro and small instance respectively. In general, micro instance is better than small instance in resisting attacks, which implies the networked disk array and storage duplicates help to reduce I/O interference. Despite the possible methods for mitigating the disk I/O interference, other shared system components are also susceptible to the interference issues, e.g., caches [28] and network interfaces [39]. The idea of Swiper could be complemented by combining with other techniques to exploit vulnerable components. As we shall see later, our method can effectively detect the I/O peak and launch workload to slowdown the victim. Altogether, the average runtime increase of peak attacks across instance types and benchmarks is 85%, about twice or eight times more than a random or naive attack, respectively. Figure 17 in Appendix H shows victim’s performance changes when varying attacker’s data consumption limit. The peak attack still has the best result under different data usage limits. Note that instance store is more vulnerable than EBS and accessing instance stores has no extra cost for the adversary. An EC2 user should use EBS volumes instead of instance stores to reduce potential damage. A boxplot of runtime reveals more insight on how peak attacks affect victims’ performance. Figure 3 demonstrates FileServer runtime distributions when peak attacks happen on micro/small instances. On the result of micro instances, peak attacks effectively change the distribution of runtime. The distribution now is skewed to higher values. On the result of small instances, almost all test results under peak attacks have longer runtime than normal runs. These two figures show that peak attacks can effectively slowdown a victim most of
TABLE 1: S, SAT , and SAC of Xen/KVM in two-VM experiments Application WebServer Darwin Wiki-2
Metric S SAT SAC S SAT SAC S SAT SAC
Naive 7.06/4.37 0.75/0.53 0.014/0.008 5.32/4.59 0.45/0.43 0.010/0.009 6.59/9.60 0.72/1.01 0.013/0.019
Random 6.74/1.70 0.72/0.29 0.015/0.003 9.45/5.82 1.66/0.55 0.019/0.011 8.41/7.59 0.89/1.48 0.017/0.017
Peak 22.70/26.07 3.81/3.62 0.048/0.084 28.62/29.33 5.70/4.81 0.059/0.069 24.69/25.27 2.88/2.45 0.068/0.054
the times. Note that Amazon EC2 should be considered as a multi-VM testing environment because it is very likely that instances from other users are co-located. 100 runs of FileServer on micro instances 250
100 runs of FileServer on small instances runtime (seconds)
Comparison with Baseline Attacks
runtime (seconds)
6.1
200 150 100 50 normal
attacked
(a) micro instance
200 150 100 50 normal
attacked
(b) small instance
Fig. 3: Boxplot of FileServer runtime by peak attack on micro and small instances
The runtime increase may not provide a tangible idea on the monetary loss. Sec. 6.4 transforms the runtime increase into the revenue loss in business. Our analysis shows a significant amount of financial loss could be done by Swiper if the target is providing critical business services. Two VMs: For conveniently analyzing different virtualization systems, we conduct the following tests on local machines with a 2.93 GHz Intel Core2 Duo E7500 processor, 4 GB RAM, and 1 TB Samsung hard drive. The host operating system is CentOS Linux with 2.6 kernel. Two paravirtualization frameworks are tested on this machine: One is the KVM and another is Xen 4.0. Note that Amazon EC2 also uses Xen. All VMs in the experiments have one VCPU and 512 MB memory. The effectiveness metrics of three selected applications are shown In Table 1. The attacker’s data usage is limited at 500 MB. The proposed peak attack clearly captures I/O request patterns and achieves additional performance degradation on both Xen and KVM. Peak attack generates an average S of 26.11% of the victim, compared to 6.25% and 6.67% from the naive and random attacks. Recall that SAT is calculated as S divided by the total runtime (in seconds) of the attacker, and SAC is S divided by the total data usage (in MB) by the attacker. For the peak attack, the normalized S by time and data usage are even better - the SAT value is about 4.17 and 5.96 times better than those of the random and naive attacks, while SAC is about 4.57 and 5.33 times better. The bar graphs of Table 1 are presented as Figure 18 to 20 in Appendix H to illustrate the differences visually. We also study the I/O throughput degradation when the peak attack has different data usage limit. Figure 4
1045-9219 (c) 2013 IEEE. Personal use is permitted, but republication/redistribution requires IEEE permission. See http://www.ieee.org/publications_standards/publications/rights/index.html for more information.
This article has been accepted for publication in a future issue of this journal, but has not been fully edited. Content may change prior to final publication. Citation information: DOI 10.1109/TPDS.2014.2325564, IEEE Transactions on Parallel and Distributed Systems
25 20 15 10 5 0
20 Throughput decrease (%)
Xen KVM
200
300
400
Throughput decrease (%)
30
30
10 WebServer
Darwin
YCSB
Wiki-1
Wiki-2
Fig. 4: The means and standard deviations of I/O throughput decreases
Multiple VMs: In addition to the victim and attacker VMs, other VMs may co-exist as background processes. A cloud service can also be provided by collaborating more than one VMs. For example, one VM serves as the frontend portal and another VM is responsible for providing requested data. Therefore, applications in the following tests are composed of multiple VMs to construct a real world scenario. Recall that Wiki-1 and Wiki2 are running Wikibench with traces from Wikipedia. Figure 5 presents the changes in the I/O throughput of four cloud service systems. The results show that Xen and KVM are both vulnerable to this threat and none of them is clearly better in resisting it. In Table 2, we present the effectiveness of three attack types on web serving applications when attacker’s data consumption is limited at 500 MB. For the peak attack, the normalized degradation by time and data usage are even better - the SAT value is about 8.18 and 3.06 times better than those of the random and naive attacks, while SAC is about 8.69 and 4.0 times better than those of the random and naive attacks. As Table 1, the bar graphs of Table 2 are also presented as Figure 21 to 23 in Appendix H to illustrate the differences visually. TABLE 2: S, SAT , and SAC of Xen/KVM in multi-VM experiments Application WebServer Wiki-1 Wiki-2
Metric S SAT SAC S SAT SAC S SAT SAC
Naive 9.47/6.82 0.85/1.15 0.018/0.013 7.37/8.99 1.14/1.05 0.014/0.017 6.26/7.83 0.95/0.77 0.012/0.015
Random 1.45/2.29 0.20/0.31 0.003/0.005 4.94/1.56 0.61/0.29 0.011/0.003 4.70/3.20 0.39/0.40 0.010/0.006
Peak 29.5/12.23 2.76/2.10 0.073/0.030 16.22/28.56 1.41/4.59 0.050/0.070 26.51/23.73 4.99/2.31 0.080/0.054
Note that Appendix E has shown that attackers may need a longer observation length to maintain the synchronization accuracy when the number of VMs increases. Please refer to Appendix G for the analysis
200
300
400
500
Attacker's data limit (MB)
(b) YCSB 40 Throughput decrease (%)
Xen KVM
20 10
Xen KVM
30 20 10 0
100
20
FileServer
100
(a) Darwin
500
0
5
Attacker's data limit (MB)
40 300
KVM
10
500
0 100
Xen
15
0 100
Throughput decrease (%)
illustrates the average throughout decreases of different applications running in a Xen VM when the peak attack has data usage limits at 100, 300, and 500 MB respectively. For every increase in the attacker’s data consumption limit, victims will see a larger drop in throughput. Darwin is the most susceptible application among the whole testing benchmarks because of its intensive and clear read request patterns. The average throughput decreases are 4.57%, 14.65%, and 22.54% at 100, 300, and 500 MB data usage limit respectively.
Throughput decrease (%)
7
200
300
400
500
100
200
300
400
Attacker's data limit (MB)
Attacker's data limit (MB)
(c) Wiki-1
(d) Wiki-2
500
Fig. 5: Throughput changes when a multi-VM system hosted by Xen/KVM is attacked by the peak attack with various data usage limits
of synchronization accuracy and Appendix H for additional experiment results. 6.2
Dealing with Non-determinism
This section demonstrates how Swiper works as a pattern detection method with a repository of collected patterns to cope with user randomness (see Figure 2). The results and analyses indicate that Swiper could help in accomplishing an automatic attacking framework. As a prototype implementation, the pattern store consists of pre-stored 120 one-minute Wikipedia traces which are from 9 to 11 am on the 1st of October, Monday, 2007. Then, we replay a 24-hour trace on the same day to evaluate how Swiper reacts to the trace. Note the pattern here is the time and amount of bandwidth usage by the target. Since we do not use any advanced pattern learning module (which by itself may become a separate research topic), we relax the scaling and stretching factors by 10% to allow Swiper to accept similar patterns in the 24-hour testing set. If there are more than one matched patterns due to the relaxation, the one with the least distortion will be selected. When Swiper identifies a known pattern in a one-minute interval, it will synchronize with and attack the victim during the remaining time of the matched minute. We limit the data usage of Swiper at 1 GB per matched minute. The machine setting of this experiment is the same as the two-VM one. In Figure 6, we first show the matched and attacked minutes at every testing hour during the experiment. This evaluation essentially shows how many one-minute traces are similar to the I/O patterns in the repository. The polynomial fit of the matched minutes shows a trend that similar patterns demonstrate time locality, which supports the findings in [30]. The requests during the night time (hour 12 to 20) are less frequent and intense and thus less similar to the stored patterns, which are from day time. Note that Swiper is looking for the similarity in I/O patterns. The request traces could be
1045-9219 (c) 2013 IEEE. Personal use is permitted, but republication/redistribution requires IEEE permission. See http://www.ieee.org/publications_standards/publications/rights/index.html for more information.
This article has been accepted for publication in a future issue of this journal, but has not been fully edited. Content may change prior to final publication. Citation information: DOI 10.1109/TPDS.2014.2325564, IEEE Transactions on Parallel and Distributed Systems 8
40 30
20 10 0
9 10 11 12 13 14 15 16 17 18 19 20 21 22 23 24 1 2 3 4 5 6 7 8 Hour
Fig. 6: Matched minutes at each testing hour in the one-day test when holding a two-hour traces in the repository. The dotted line shows a polynomial fit of the observed data points. The dotted rectangle shows the period for the training set
30 25 20
15 10
20 15 10 5 0 1
2
4
5
6
7
8
20 15 10 5 0
9 10
1
2
3
25 20 15 10 5 0 2
3
5
4
5
6
7
8
Attacking Migratable VMs
Live migration is a method that can be potentially used to reduce workload interference. In this section we run two experiments to study if live migration affects the attack and by how much. In the first experiment, we assume the victim VM is aware of being attacked, and wants to be migrated away. The host machines, MA and MB , have an identical configuration and are the same as the one used in the previous two-VM tests. Hosts are interconnected on a Gigabit Ethernet, and share the same storage device on another machine MC . Note that using the same VM image is a common practice because moving the disk image can vastly increase the pausing time of VM execution. The testing time of each run is 10 minutes, and the data
15 10 5 0 3
4
5
6
7
Time period (min)
(e) Wiki-1
8
9 10
8
9 10
15 10 5 0 1
2
3
4
5
6
7
(d) YCSB
20
2
9 10
Time period (min)
25
1
8
20
9 10
Throughput decrease (%)
last 22 hours are not as good as the first two, the results confirm that a historical trace could still be useful in the future. The throughput degradation ranges from 2 to 20% and has an overall average of 13.12%. As future work, using clustering methods to identify and generate patterns may greatly improve the effectiveness of Swiper.
Throughput decrease (%)
Fig. 7: The average throughput decrease per attack at each testing hour. The dotted rectangle shows the period for the training set
7
25
(c) Darwin
Hours
6
30
Time period (min)
0
5
(b) WebServer
30
1
4
Time period (min)
(a) FileServer
9 10 11 12 13 14 15 16 17 18 19 20 21 22 23 24 1 2 3 4 5 6 7 8
6.3
3
25
Time period (min)
Throughput decrease (%)
Throughput decrease (%)
Because the extended Swiper relaxes the matching criterion and does not hold a full trace, attacking one matched minute does not necessary mean a correct match and guarantee a significant degradation as before. Therefore, Figure 7 examines the average throughput decrease per attack at each testing hour. Although the
25
Throughput decrease (%)
50
Throughput decrease (%)
60
usage of Swiper is limited at 500 MB per minute. In the first run, the attacker and the victim are both on MA and the victim is attacked for 10 minutes. Then, in the second run, the victim is migrated away after being attacked for two minutes, but the attacker keeps interfering the storage accesses. Most of the migration times are less than a minute. Figure 8 shows the average throughput decreases of these two scenarios in every testing minute. Note that the performance degradation after migration comes from the interference on a shared storage. The degradation is smaller by about 3.23% on average after migration because the short pausing time for migration makes I/O patterns shifted. Throughput decrease (%)
Matched minutes per hour
accessing different files but the disk could show similar reading patterns.
8
9 10
35 30 25 20 15 10 5 0 1
2
3
4
5
6
7
Time period (min)
(f) Wiki-2
Fig. 8: The throughput decreases when the migration is enable are shown in red solid lines. The blue dotted lines represent the throughput decreases when the victim is not migrated.
In the second experiment, the attacker will chase the target if it migrates away. We have four machines as VM hosts in this experiment. Each machine has two sixcore Intel Xeon CPUs at 2 GHz, 32 GB memory, and 128 GB SSD. All VM images are stored on a storage node with two six-core Intel Xeon CPUs at 2.67 GHz, 24 GB memory, and 2 TB RAID0. Each VM has 1 VCPU and 2 GB memory. Every machine runs two background VMs, which randomly read and write multiple files. We start the target VM on one of the hosts. Then, we launch probing VMs to search, synchronize, and attack the target VM. We assume the target is aware of being attacked after two minutes. Then, it runs away to another host. After knowing the target is away, Swiper starts to looking for the target again. We repeat the same process
1045-9219 (c) 2013 IEEE. Personal use is permitted, but republication/redistribution requires IEEE permission. See http://www.ieee.org/publications_standards/publications/rights/index.html for more information.
This article has been accepted for publication in a future issue of this journal, but has not been fully edited. Content may change prior to final publication. Citation information: DOI 10.1109/TPDS.2014.2325564, IEEE Transactions on Parallel and Distributed Systems
for 20 minutes and for each testing application. Then, we conduct the same tests in a different scenario which does not allow migration. Figure 24 in Appendix H shows the average throughput decreases of these two scenarios in every testing minute. Almost every migration takes less than one minute. Each relocating process takes about 70 to 160 seconds, from being aware of losing the target to start attacking again. During these periods, the target VM still gets performance degradation because it pauses running for a short period of time and may still gradually copies memory pages from the previous machine until all dirty pages are synchronized, e.g., in the 7th minute of Figure 24(a) and almost every migration in Figure 24(d), because of high dirty page rate, available bandwidth, or migration overheads [32]. On average, the adversary still hurts the targets performance by 16.32% even after the target tries to migrate and avoid the attacker. 6.4
Potential Monetary Loss
The runtime increase may not give a tangible idea on the monetary loss. Thus, we use a linear model to translate the runtime increase into revenue loss in business. In Sec. 1, we have seen that 100 ms delay in loading pages may causes 1% revenue loss and 500 ms delay in displaying search results may reduce revenue by 20%. We also know that the median web page loading time is about 3 seconds [40] and the average time to display the search result is 0.2 seconds [41]. We use these data as two linear cost vs. delay models. Let’s call them SLA1 and SLA2 cost models respectively. In case SLA1 and SLA2 models are too optimistic for Swiper, we also use SLA3 and SLA4 models which assume the expected loss is only one tenth of the SLA1 and SLA2 respectively. Then, the potential revenue loss caused by Swiper is interpolated from these models and our experiments on EC2. The columns in Figure 9 represent the potential revenue loss caused by the average runtime increase. The whisker lines represent the revenue loss caused by the minimum and maximum runtime increases from the experiments on EC2. The average revenue loss could be at least around 10% and up to 30% on small and micro instances when using SLA1 and SLA2 models respectively. Even with the SLA3 and SLA4, the average revenue loss is about 1.8% across two instance types and cost models, which is big enough to justify the colocating cost of Swiper. Note that not all probing instances were running during the whole probing period. An instance is terminated immediately after confirming that there is no colocated target. Thus, the cost (data and instance usage) of probing and locking-on is small. For example, using micro (0.02 dollars per hour) and small instances (0.06 dollars per hour) as the probing VMs cost about one and three dollars for co-locating one target (based on the 2% success rate) respectively. Such initial cost is very small compared with the potential revenue loss shown in Figure 9.
Revenue loss (%)
9
35 30 25 20 15 10 5 0
60
45
SLA1
SLA2
SLA3
SLA4
SLA1
SLA2
Micro
SLA3
SLA4
Small
Fig. 9: Potential revenue loss caused by Swiper on small and micro instances
7
C ONCLUSION
In this paper, we presented a novel I/O workload based performance attack which uses a carefully designed workload to incur significant delay on a targeted application running in a separate VM but on the same physical system. Such a performance attack poses an especially serious threat to data-intensive applications which require a large number of I/O requests. Performance degradation directly increases the cost of per workload completed in cloud-computing systems. Our experiment results demonstrated the effectiveness of our attack on different types of victim workloads in realworld systems with various number of VMs. Interested readers may refer to Appendix I for the literature review and more discussions, where we have proposed a number of possible solutions to these types of attacks as future work. Also, it would interested to study the effects of system parameters, e.g., I/O schedulers and buffer sizes, on defending such attacks.
8
ACKNOWLEDGMENTS
The authors thank reviewers for their insightful suggestions. This research is supported in part by the National Science Foundation under grant OCI-0937875.
R EFERENCES [1]
M. Armbrust et al., “A view of cloud computing,” Commun. ACM, vol. 53, no. 4, pp. 50–58, 2010. [2] M. Rosenblum et al., “Virtual machine monitors: Current technology and future trends,” IEEE Computer, vol. 38, pp. 39–47, 2005. [3] Amazon, “Ec2 sla.” [Online]. Available: http://aws.amazon.com/ec2-sla/ [4] V. Varadarajan et al., “Resource-freeing attacks: improve your cloud performance (at your neighbor’s expense),” in CCS, 2012, pp. 281–292. [5] R. Kohavi et al., “Online experiments: Lessons learned,” Computer, vol. 40, no. 9, pp. 103–105, 2007. [6] T. Ristenpart et al., “Hey, you, get off of my cloud: exploring information leakage in third-party compute clouds,” in CCS, 2009. [7] A. Greenberg et al., “The cost of a cloud: research problems in data center networks,” SIGCOMM Comput. Commun. Rev., vol. 39, no. 1, pp. 68–73, Dec. 2008. [8] E. Deelman et al., “Clouds: An opportunity for scientific applications?” in High Performance Computing Workshop, 2008, pp. 192– 215. [9] S. K. Barker et al., “Empirical evaluation of latency-sensitive application performance in the cloud,” in Proceedings of the first annual ACM SIGMM conference on Multimedia systems. ACM, 2010, pp. 35–46. [10] K. Ye et al., “Virtual machine based energy-efficient data center architecture for cloud computing: a performance perspective,” in Proceedings of the 2010 IEEE/ACM Int’l Conference on Green Computing and Communications & Int’l Conference on Cyber, Physical and Social Computing. IEEE Computer Society, 2010, pp. 171–178. [11] P. Apparao et al., “Characterization & analysis of a server consolidation benchmark,” in VEE. ACM, 2008, pp. 21–30.
1045-9219 (c) 2013 IEEE. Personal use is permitted, but republication/redistribution requires IEEE permission. See http://www.ieee.org/publications_standards/publications/rights/index.html for more information.
This article has been accepted for publication in a future issue of this journal, but has not been fully edited. Content may change prior to final publication. Citation information: DOI 10.1109/TPDS.2014.2325564, IEEE Transactions on Parallel and Distributed Systems 10
[12] G. Wang et al., “The impact of virtualization on network performance of amazon ec2 data center,” in INFOCOM. IEEE, 2010, pp. 1–9. [13] J. Szefer et al., “Eliminating the hypervisor attack surface for a more secure cloud,” in Proceedings of the 18th ACM conference on Computer and communications security. ACM, 2011, pp. 401–412. [14] S. Govindan et al., “Cuanta: quantifying effects of shared onchip resource interference for consolidated virtual machines,” in Proceedings of the 2nd ACM Symposium on Cloud Computing, 2011, p. 22. [15] Y. Mei et al., “Performance measurements and analysis of network i/o applications in virtualized cloud,” in CLOUD. IEEE, 2010, pp. 59–66. [16] S. Ibrahim et al., “Towards pay-as-you-consume cloud computing,” in SCC. IEEE, 2011, pp. 370–377. [17] R. Shea et al., “Understanding the impact of denial of service attacks on virtual machines,” in IWQoS. IEEE Press, 2012, pp. 27:1–27:9. [18] ——, “Performance of virtual machines under networked denial of service attacks: Experiments and analysis,” Systems Journal, IEEE, vol. 7, no. 2, pp. 335–345, 2013. [19] CERT, “http://www.cert.org/tech tips/denial of service.html.” [20] P. A. Karger et al., “Storage channels in disk arm optimization,” in IEEE S&P, 1991. [21] Z. Yang et al., “Understanding the effects of hypervisor i/o scheduling for virtual machine performance interference,” in CloudCom, 2012, pp. 34–41. [22] O. Aciic¸mez, “Yet another microarchitectural attack:: exploiting i-cache,” in CSAW, 2007, pp. 11–18. [23] O. Aciic¸mez et al., “New results on instruction cache attacks,” in CHES. Springer-Verlag, 2010, pp. 110–124. [24] E. Tromer et al., “Efficient cache attacks on aes, and countermeasures,” J. Cryptol., vol. 23, no. 2, pp. 37–71, Jan. 2010. [25] Y. Zhang et al., “Cross-vm side channels and their use to extract private keys,” in CCS, 2012, pp. 305–316. [26] Amazon EC2, “http://aws.amazon.com/ec2/.” [27] X. Pu et al., “Understanding performance interference of i/o workload in virtualized cloud environments,” in CLOUD, 2010, pp. 51 –58. [28] R. Nathuji et al., “Q-clouds managing performance interference effects for qos-aware clouds,” in EuroSys, 2010. [29] G. Soundararajan et al., “Towards end-to-end quality of service: controlling i/o interference in shared storage servers,” in Middleware, 2008. [30] Z. Wu et al., “Spanstore: Cost-effective geo-replicated storage spanning multiple cloud services,” in SOSP, 2013, pp. 292–308. [31] A. Iosup et al., “On the performance variability of production cloud services,” in CCGrid. IEEE, 2011, pp. 104–113. [32] S. Akoush et al., “Predicting the performance of virtual machine migration,” in MASCOTS, 2010, pp. 37–46. [33] D. Breitgand et al., “Cost-aware live migration of services in the cloud,” in SYSTOR. ACM, 2010, pp. 11:1–11:1. [34] C. Jo et al., “Efficient live migration of virtual machines using shared storage,” in VEE, 2013, pp. 41–50. [35] E. Nakashima, “More than 75,000 computer systems hacked in one of largest cyber attacks, security firm says,” Washington Post, no. 18, Feb 2010. [36] B. F. Cooper et al., “Benchmarking cloud serving systems with ycsb,” in SoCC, 2010, pp. 143–154. [37] G. Urdaneta et al., “Wikipedia workload analysis for decentralized hosting,” Elsevier Computer Networks, vol. 53, no. 11, pp. 1830– 1845, July 2009. [38] FileBench, “http://www.solarisinternals.com/wiki/index.php/ filebench.” [39] Y. Koh et al., “An analysis of performance interference effects in virtual environments,” in Performance Analysis of Systems Software, 2007. ISPASS 2007. IEEE International Symposium on, 2007, pp. 200– 209. [40] M. M. T. Arvind Jain et al., “Global site speed overview: How fast are websites around the world?” [Online]. Available: http://analytics.blogspot.com/2012/04/global-site-speedoverview-how-fast-are.html ¨ [41] U. Holzle, “Powering a google search.” [Online]. Available: http://googleblog.blogspot.com/2009/01/poweringgoogle-search.html [42] P. Barham et al., “Xen and the art of virtualization,” in SOSP, 2003. [43] K. Fraser et al., “Reconstructing i/o,” 2004. [44] A. S. Szalay et al., “Low-power amdahl-balanced blades for data intensive computing,” SIGOPS Oper. Syst. Rev., vol. 44, no. 1, pp. 71–75, 2010. [45] Venturebeat, “Seamicro drops an atom bomb on the server industry, http://venturebeat.com/2010/06/13/seamicro-drops-anatom-bomb-on-the-server-industry/.” [46] J. Liu et al., “High performance vmm-bypass i/o in virtual machines,” in ATEC, 2006.
[47] H. Raj et al., “High performance and scalable i/o virtualization via self-virtualized devices,” in HPDC, 2007. [48] T. Moscibroda et al., “Memory performance attacks: denial of memory service in multi-core systems,” in USENIX Security, 2007. [49] H. Raj et al., “Resource management for isolation enhanced cloud services,” in CCSW, 2009. [50] E. Keogh et al., “On the need for time series data mining benchmarks: A survey and empirical demonstration,” Data Mining and Knowledge Discovery, vol. 7, no. 4, pp. 349–371, 2003. [51] R. Agrawal et al., “Efficient similarity search in sequence databases,” in FODO, 1993. [52] K. Chakrabarti et al., “Locally adaptive dimensionality reduction for indexing large time series databases,” ACM Trans. Database Syst., vol. 27, no. 2, pp. 188–228, 2002. [53] E. Keogh, “Exact indexing of dynamic time warping,” in VLDB, 2002. [54] C. Faloutsos et al., “Fast subsequence matching in time-series databases,” SIGMOD Record, vol. 23, no. 2, 1994. [55] Y.-S. Moon et al., “General match: a subsequence matching method in time-series databases based on generalized windows,” in SIGMOD, 2002. [56] V. Athitsos et al., “Approximate embedding-based subsequence matching of time series,” in SIGMOD, 2008. [57] W.-S. Han et al., “Ranked subsequence matching in time-series databases,” in VLDB, 2007. [58] J. B. Kruskall et al., The symmetric time warping algorithm: From continuous to discrete. in Time Warps, Addison-Wesley, 1983. [59] A. Whitaker et al., “Denali: a scalable isolation kernel,” in EW, 2002. [60] T. Garfinkel et al., “When virtual is harder than real: security challenges in virtual machine based computing environments,” in HotOS, 2005. [61] L. Cherkasova et al., “Measuring cpu overhead for i/o processing in the xen virtual machine monitor,” in USENIX ATC, 2005. [62] D. Gupta et al., “Enforcing performance isolation across virtual machines in xen,” in Middleware, 2006. [63] G. A. Alvarez et al., “Minerva: An automated resource provisioning tool for large-scale storage systems,” ACM Trans. Comput. Syst., vol. 19, no. 4, pp. 483–518, 2001. [64] G. Soundararajan et al., “Dynamic resource allocation for database servers running on virtual storage,” in FAST, 2009. [65] L. Huang et al., “Multi-dimensional storage virtualization,” SIGMETRICS Perform. Eval. Rev., vol. 32, no. 1, pp. 14–24, 2004. [66] S. R. Seelam et al., “Virtual i/o scheduler: a scheduler of schedulers for performance virtualization,” in VEE, 2007. [67] D. Ongaro et al., “Scheduling i/o in virtual machine monitors,” in VEE, 2008. [68] A. Gulati et al., “Parda: proportional allocation of resources for distributed storage access,” in FAST, 2009. [69] D. Boutcher et al., “Does virtualization make disk scheduling pass´e?” SIGOPS Oper. Syst. Rev., vol. 44, no. 1, pp. 20–24, 2010. [70] C. R. Lumb et al., “Facade: Virtual storage devices with performance guarantees,” in FAST, 2003. [71] M. Karlsson et al., “Triage: Performance differentiation for storage systems using adaptive control,” Trans. Storage, vol. 1, no. 4, pp. 457–480, 2005. [72] S. Uttamchandani et al., “Chameleon: a self-evolving, fullyadaptive resource arbitrator for storage systems,” in ATEC, 2005. [73] J. Zhang et al., “Storage performance virtualization via throughput and latency control,” Trans. Storage, vol. 2, no. 3, pp. 283–308, 2006. [74] M. Wachs et al., “Argon: performance insulation for shared storage servers,” in FAST, 2007. [75] H. H. Huang et al., “Automated performance control in a virtual distributed storage system,” in Grid, 2008. [76] E. Keller et al., “Nohype: virtualized cloud infrastructure without the virtualization,” in ISCA, 2010. [77] Y. Tan et al., in ICDCS, june 2012, pp. 285 –294. [78] ——, “Adaptive system anomaly prediction for large-scale hosting infrastructures,” in PODC, 2010, pp. 173–182. [79] K. Shen et al., “Reference-driven performance anomaly identification,” in SIGMETRICS. ACM, 2009, pp. 85–96. [80] P. Bodik et al., “Fingerprinting the datacenter: automated classification of performance crises,” in EuroSys. ACM, 2010, pp. 111–124. [81] I. Cohen et al., “Capturing, indexing, clustering, and retrieving system history,” SIGOPS Oper. Syst. Rev., vol. 39, no. 5, pp. 105– 118, Oct. 2005. [82] C. E. Monteleoni, “Learning with online constraints: Shifting concepts and active learning,” Ph.D. dissertation, Cambridge, MA, USA, 2006. [83] J. Ferber, Multi-agent systems: an introduction to distributed artificial intelligence. Addison-Wesley, 1999, vol. 1. [84] M. L. Littman, “Markov games as a framework for multi-agent reinforcement learning.” in ICML, vol. 94, 1994, pp. 157–163.
1045-9219 (c) 2013 IEEE. Personal use is permitted, but republication/redistribution requires IEEE permission. See http://www.ieee.org/publications_standards/publications/rights/index.html for more information.
This article has been accepted for publication in a future issue of this journal, but has not been fully edited. Content may change prior to final publication. Citation information: DOI 10.1109/TPDS.2014.2325564, IEEE Transactions on Parallel and Distributed Systems 11
Ron C. Chiang received the Ph.D. in computer engineering from the George Washington University in 2014. He was a software engineer with the Institute for Information Industry, Taipei, Taiwan from 2001 to 2006 and a research assistant with the Institute of Information Science, Academia Sinica, Taipei, Taiwan from 2006 to 2008. His research interest includes virtualization technology, cloud computing, file and storage systems, and embedded systems. He received a distinguish performance award for technology from the Ministry of Economic Affairs for advancing Taiwans J2ME development in 2005.
Sundaresan Rajasekaran is a Ph.D. candidate of Computer Science Department at the George Washington University, Washington, DC. He received his M.S. degree at the George Washington university in 2010 and his Bachelor of Engineering (B.E.) in 2008 from Anna University, Chennai, India. His research interests includes Cloud Computing, Virtualization, Performance and Security in Distributed Systems.
Nan Zhang is an Associate Professor of Computer Science at The George Washington University, Washington, DC, USA. He received the B.S. degree from Peking University in 2001 and the Ph.D. degree from Texas A&M University in 2006, both in computer science. His current research interests includes databases and information security/privacy. He received the NSF CAREER award in 2008.
H. Howie Huang is an Assistant Professor in Department of Electrical and Computer Engineering at the George Washington University. He received his Ph.D. in Computer Science from the University of Virginia in 2008. His research interests are in the areas of computer systems and architecture, including cloud computing, big data computing, high-performance computing and storage systems. He received NSF CAREER award in 2014, NVIDIA Academic Partnership Award in 2011, and IBM Real Time Innovation Faculty Award in 2008.
1045-9219 (c) 2013 IEEE. Personal use is permitted, but republication/redistribution requires IEEE permission. See http://www.ieee.org/publications_standards/publications/rights/index.html for more information.