Syntactic and Semantic Graphics Recognition: The Role of the Object-Process Methodology Dov Dori Information Systems Engineering, Faculty of Industrial Engineering and Management Technion, Israel Institute of Technology, Haifa 32000, Israel
[email protected] Abstract. Recognition of graphics is made at two levels: syntactic and semantic. Machines are already functioning at the syntactic level quite satisfactorily, but at the semantic level they still lack the intelligence and cognition humans apply while interpreting graphic symbols. Understanding and communicating the structure and behavior of complex systems through a graphic representation is effective only if it constitutes a visual formalism that assigns a definite semantics to each symbol. Object-Process Methodology (OPM) is a graphics-based visual formalism that has been applied to analyze and design systems in a variety of domains. Through a set of Object-Process Diagrams (OPDs) we specify a generic graphics recognition subsystem that is integrated into a Document Analysis System. Beside the direct value of the OPD representation, this model serves as an instance of the way OPM can be used as a concise graphic representation that unifies the structure and behavior of complex systems in general and graphics recognition systems in particular.
1
The Value of Graphic Representation
Products and systems are becoming ever more complex. Many man-made, as well as natural systems feature complexity of their structure (how they are constructed), function (what they do) and behavior (how they change over time). Understanding these systems requires a well-founded, intuitive methodology that is capable of modeling their complexities in a coherent, straightforward manner. Artificial systems require development and support efforts throughout their entire lifetime. Systematic specifications, analysis, design and implementation of new systems and products is becoming more difficult and demanding, calling for a comprehensive, methodology to tackle these challenges. Document analysis systems in general, and automated graphics recognition systems in particular, are no exception. Modern systems of this type require prudent specifications, analysis, design and implementation. Graphic representation of systems of any kind has been known to be effective for human comprehension and communication. In their book Knowledge Elicitation, Atul K. Chhabra and D. Dori (Eds.): GREC'99, LNCS 1941, pp. 277-287, 2000. Springer-Verlag Berlin Heidelberg 2000
278
Dov Dori
discussing the question “Does the knowledge require graphic representation?” (p.31) Firlej and Hellens1 note that The term ‘graphic representation’ … means anything that can only be adequately represented by using drawings or sketches. Some domains do have a large component of graphic content. The expert may, in the process of explaining some idea or description of a behavior, suddenly reach for pad and draw sketches of what he/she does, and say “it has to look like this” or “I know just by looking at the chart if something is wrong”. Sketching and drawing may … provide a useful way of expressing idea on a paper that is difficult to express in words. … These drawings may be indispensable for the user and a practical method for the representation of these drawings and plans may have to be found to achieve acceptable functioning.” Indeed, diagrams are often invaluable for describing models of abstract things, especially complex systems. An accepted diagramming method has the potential of becoming a powerful modeling tool, provided that it really constitutes an unambiguous language, or a visual formalism2,3,4. A visual formalism is valuable if each symbol in the diagram has a defined semantics and the links among the symbols unambiguously convey some meaningful information or knowledge that is clearly understood by those who are familiar with the formalism. As Wand and Weber5 note, Without a set of common constructs, one cannot expect the appearance of a generally accepted paradigm of systems analysis and design that will enable the comparison and evaluation of methodologies. Also, without a theoretical paradigm, no generally accepted rules of design can be developed.
2
Levels of Graphics Recognition
Graphics recognition can be considered at two levels: the syntactic level and the semantic level. At the syntactic level, the recognition involves locating the graphic symbols in the document and classifying them into the various classes by their shape and possibly their context. At the semantic level, the recognition requires assigning meaning to the syntactically recognized symbols. This meaning is domain-dependent, and it varies from one area of science and engineering to another. Most engineering areas have an established and accepted set of symbols. Systems engineering has just recently “joined the club” with the introduction of the Unified Modeling Language (UML), discussed below. When we talk about graphics recognition, we implicitly allude to automated graphics recognition by computers. This recognition is, for the most part, at the syntactic level. The difference between human and automated graphics recognition is the level at which the interpretation is made: Humans have no problem recognizing graphic symbols at the syntactic level, i.e., identifying their shape or form. Young toddlers and kids are successfully trained at a very early age to recognize and point to shapes like rectangle, ellipse, star, rhombus, hexagon, etc., as one of their first
Syntactic and Semantic Graphics Recognition
279
cognitive missions, making their parents proud and happy. They accomplish this task even if the shapes are noisy, blurred, occluded and/or mixed with text. The ease of human syntactic graphics recognition is but one manifestation of the tremendous human visual capabilities, which machine vision has been trying to imitate, with only limited success in specific domains. Graphic symbol recognition at the semantic level takes for granted the successful accomplishment of the earlier syntactic recognition phase. Semantic graphics recognition is aimed at high-level interpretation and understanding of the assembly of graphic symbols within the domain of discourse within which the recognition is being made. At the semantic level, graphic symbol recognition requires high-order cognitive skills, familiarity with the domain, its underlying concepts and rules, and the proper interpretation of the various graphic symbols within the appropriate context. This is a level of intelligence that is distinctly above the syntactic level. However, the semantic level itself is not single and uniform. Within a typical domain there is more than just one level of understanding. Taking the domain of mechanical engineering drawings, for example, we can talk of at least two distinct levels: two-dimensional understanding and three-dimensional understanding. The two-dimensional understanding pertains to such things as recognizing the dimension sets and verifying that they completely and unambiguously describe each 2-D view separately. The three-dimensional semantic level deals with reconstructing the 3-D structure of the object from its collection of 2D views.
3
Ad-hoc Graphic System Representations
The fact that most people use some kind of diagramming technique to express their knowledge about systems in a plethora of domains is a testimony of the viability of graphic representation and the advantage it has over textual representations. Having acknowledged the merit of the graphic representation, we should, however, also recognize that a graphic representation of our knowledge about a system is indeed valuable if and only if it is backed by a comprehensive and consistent modeling methodology. Such methodology is essential if we are to be able to understand complex systems in any domain, communicate our understanding to others, and use the analysis results as a basis for designing solutions to existing problems, as well as modifying and elaborating current systems. Reading through scientific and technical papers that describe artificial as well as natural systems of various kinds and domains, the lack of a common, acceptable formalism for describing systems is sorely apparent. In the better cases, diagrammatic system descriptions are done using a set of ad-hoc symbols that the authors make up spontaneously to be used in a specific diagram. In other cases the same symbol is overloaded with more than one possible interpretation or there is no systematic assignment of graphical symbols to logical entities in the diagram. As Bubenko6 (p. 295) wrote, no generally accepted, workable theory of information systems theory of information systems and their development has evolved. Although the requirement for standardizing system modeling is trivial, an accepted
280
Dov Dori
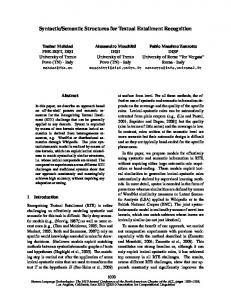
symbol set for general systems analysis, design and implementation is just beginning to emerge. If we look at diagrams that people draw with the intention of expressing some system aspect, we often find ad-hoc, implicit, undocumented and arbitrary collection of symbols and links. In other cases we may even find that the same graphic symbol is overloaded with semantics or used in contradictory, perplexing ways. Consider, for example, the graphic representation in Figure 1 of “The KBS (knowledge-based system) modeling development process”, as it appears in Knowledge Elicitation by Firlej and Hellens1. the elicitor’s interpretation and framework The expert’s Problem-solving
conceptual model
behavior AI techniques
transformation
design
design model
system
AI machine represntation, rules, etc. Figure 1. The KBS modeling development process
The automatic syntactic graphic recognition of this diagram does not pose special difficulties: the graphic symbols are simple, clear, and easy to recognize. Semantic recognition, however, is difficult not only to a machine, but to a human as well. While no legend is provided, one can try to infer the intentions of the symbols in the diagram. However, contemplating upon it for a while, many questions come to mind, regardless of the diagram content. For example, it is not possible to understand what is the difference (if any) between text surrounded by an ellipse, text surrounded by a rectangle, and non-surrounded text. Is it indeed the case that ellipses represent processes? Why, then, is “design” not surrounded also by an ellipse? Is it because there is a profound difference between transformation and design? Furthermore, why is one ellipse solid while the other is dashed? Why are some boxes drawn with a thin line while another with a thick one? Why are some arrows solid, while others are dashed? What is the meaning of an arrow anyway? What is the difference between an arrow connecting surrounded text and one that connects non-surrounded text with another arrow, or an arrow pointing at another arrow?
Syntactic and Semantic Graphics Recognition
281
Surely the diagram designer must have had some intention in making distinctions through different graphic constructs to convey particular meanings, but how are we supposed to interpret it? Since we are supplied with neither legend in the diagram nor with explanation within the text, we are left puzzled with these questions. Is it our limited mental capability that prevents us from understanding this, or is it possible that there is no consistent intention behind the different symbols in the diagram? Unfortunately, the example discussed in some length above is but one of numerous similar representations that abound in the best of textbooks and scientific journals as representations of systems or parts thereof. The scandalous state of affairs in graphic systems modeling is that this is the rule rather than the exception. Most graphic representations, at best, use ad-hoc symbols without explicit specifications, but many of these diagrams even contain inexplicable inconsistencies from one diagram to the next within the same article, or, even worse, within the same diagram. It is not just the case that the richness of graphic symbology is not taken advantage of – the arbitrary use of graphic symbols potentially adds more confusion than it provides help. Hence, not only such diagrams are not always helpful, they may even hinder understanding of the textual description of a system or a process a system executes. Recently, the Unified Modeling Language (UML) has been accepted as a standard. Rational University Web site7 defines UML as follows: The Unified Modeling Language (UML) is the industry-standard language for specifying, visualizing, constructing, and documenting the artifacts of software systems. It simplifies the complex process of software design, making a "blueprint" for construction. The UML represents a collection of "best engineering practices" that have proven successful in the modeling of large and complex systems.
4
Object-Process Methodology Highlights
The Object-Process Methodology (OPM) 8,9 is an integrated approach to the study and development of systems in general and information systems in particular. OPM unifies the system’s structure and behavior throughout the analysis, design and implementation within one frame of reference using a single diagramming tool – the Object-Process Diagram (OPD) and a corresponding, English-like language – the Object-Process Language (OPL). OPM is not yet another object-oriented systems development method. It departs from the object-oriented paradigm by recognizing processes as stand-alone entities beside objects. OPM caters to the natural train of thought humans normally apply while trying to understand and build complex systems. In such systems, it is usually the case that structure and behavior are intertwined so tightly, that any separation between them is bound to further complicate the already complex description. Founded on General Systems Theory, OPM is generic and therefore suitable for specifying systems of virtually any domain. Current object-oriented methods evolved bottom-up from object-oriented programming languages. They therefore contain many ideas, such as the encapsulation
282
Dov Dori
of methods within objects that potentially yield good computer programs, but hinder faithful modeling of the system and its problem domain. OPM, on the other hand, has been designed top-down, with an eye toward modeling the real world. The basic premise of OPM is that objects and processes are two types of equally important classes of things, that together faithfully describe both the structure and the behavior of systems in a single model in virtually any domain. At any point in time, each object is at some state, and object states are transformed through the occurrence of a process. OPM unifies structure, behavior and function within a single model. Processes in OPM are independent building blocks beside objects. They enable explicit dynamic modeling, intertwined with the object model. This unification paradigm of the static aspect with the dynamic aspect in a single model is unique to OPM. Using ObjectProcess Diagrams (OPDs) along with an Object-Process Language (OPL) provides OPM with a high expressive power. OPD is the graphic system representation, while OPL is its equivalent textual specification. The use of a single type of diagrams provides for a concise symbol system, thereby preventing the need for “mental translations” back and forth among the various models. By integrating the structural, functional and procedural system aspects and expressing them in analogous graphic and textual representations, OPM represents formally, yet intuitively, systems in various domains and at all levels of complexity. The resulting specification explicitly states what the system is, what it does, and how it does it. It enables reasoning by telling us how processes transform (generate, consume and affect) objects.
5
Towards a Standardized Modeling Graphic Set
The lack of a common methodology for system specification is sorely hampering the development of integrated, well founded modeling solutions for complex systems. OPM uses Object Process Diagrams (OPDs) for expressing the objects of a modeled system and the processes that affect them. Objects and processes in an OPD are denoted within rectangles and ellipses, respectively, while object states are marked as round-cornered rectangles. OPM is useful for understanding system-related problems, communicating with application experts, preparing documentation, and designing solutions for the modeled system. OPM has been successfully applied in a variety of areas, including studyware design10 Computer Integrated Manufacturing11, R&D Management12 and real-time systems13. In the specific area of graphics recognition, OPM was instrumental in works dealing with the Machine Drawing Understanding System (MDUS)14,15, 3-D reconstruction from engineering drawings16, document analysis systems and contentbased image retrieval17. Based on the experience gathered in these, as well as other works, it is recommended that OPM be adopted by system designers as the method of choice for specifying and designing systems in general and document analysis systems in particular. The rest of the paper demonstrates the application of OPM for a graphics recognition subsystem.
Syntactic and Semantic Graphics Recognition
6
283
An OPM Representation of a Graphics Recognition Subsystem
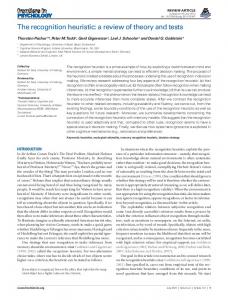
A document is a human-generated artifact that records a representation of some data, information or knowledge17. In the long term, interesting documents from the single enterprise are those that represent knowledge – a meaningful and useful digest of information and data. A document is the instrument that enables preservation of this knowledge, its transfer to other interested parties and its extraction through elaborate processing, such as OCR, graphics recognition and natural language understanding. A Document Management System consists of three subsystems: The Generation Subsystem, the Exchange Subsystem and the Document Analysis Subsystem. The Document Generation Subsystem is the instrument used by the document author to generate the document. The Document Exchange Subsystem is the instrument that enables the communication of the document to its prospective audience. Once acquired, the document must be properly processed and analyzed in order to make the knowledge recorded in it in a representational format that is readily available to humans. Documents can be recorded in two major different modalities: analog or digital. Documents with analog Modality are paper-based, while those with electronic Modality are electronic-based. Figure 2 is an OPD that focuses on the Document Analysis Subsystem. It shows the parts of the Document Analysis process and the attributes of the paper document that are gradually exposed as a result of the various analysis processes. To be analyzed, a Paper Document must first be converted to an Electronic Document. The Analog-to-Digital Conversion process does this, usually by scanning or imaging. The Electronic Document is input to the Document Analysis process, which consists of three major parts: OCR & Layout Analysis, Graphics Recognition and Document Understanding. OCR & Layout Analysis (and/or handwriting recognition) yield the textual content of the document information in ASCII form as well as information on the document’s layout. Graphics Recognition yields the Document’s Symbols & Graphic Objects. Text and Graphics Recognition constitutes the syntactic-level analysis. The most sophisticated sub-process – Document Understanding – is aimed at extracting the meaningful knowledge that the original paper document represents in a form that can be best digested by humans. Document Understanding makes use of the text and graphics recognition obtained at the syntactic level in order to achieve understanding at the semantic level. This level makes use of all the information obtained by the previous Document Analysis parts and requires a substantial amount of what is known as “artificial intelligence.” An example of a high level Document Understanding process is 3-D reconstruction of objects described in engineering drawings. Most contemporary document analysis systems are just beginning to show signs of semantic-level document understanding. Indeed, having solved the early analysis tasks, the challenge of current systems is to enhance their high-level understanding capabilities so that they exhibit a more intelligent behavior and hence be more useful to humans.
284
Dov Dori
Figure 2. The Document Analysis Subsystem and the parts of the Document Analysis process
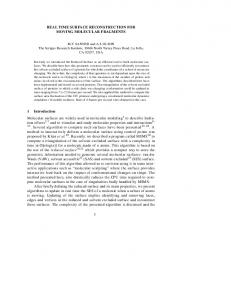
Figure 3 zooms into the Graphics Recognition process. The Electronic Document is input into the Syntactic Graphic Recognition. This process yields Symbols and Graphic Objects. This may be the end of the Graphics Recognition process. However, in the system we describe here this is followed by Semantic Graphics Recognition. This process is enabled by a Domain Graphics Rule-base and a Hypothesis. It yields Intermediate Graphics-related Semantics, which is input into Consistency & Completeness Checking. This checking yields the Boolean object “Semantics Consistent?” If so, the higher level process terminates and we end up with Semantic Graphics Interpretation. If not, then a new Hypothesis is generated and the Semantic Graphics Recognition is repeated in a loop. This is a model for generic graphics recognition at both the syntactic and the semantic levels. Naturally, Domain Graphics Rule-base has to be adapted and specialized into the various domains insofar as the semantic part is concerned, while for the syntactic recognition a common graphic recognizer can be used. In the Machine Drawing Understanding System18,19 we apply basically the same strategy: for the syntactic phase we have developed a generic graphics recognition algorithm20 that is basically domain-independent. A specialized, domain-specific module that exploits domain knowledge needs to be used for the semantic phase.
Syntactic and Semantic Graphics Recognition
285
Figure 3. Zooming into the Graphic Recognition process
7
Summary
In this paper we argue that a distinction needs to be made between syntactic and semantic graphics recognition. While syntactic graphics recognition is already done by machines with considerable success, this is not the case with semantic graphics recognition. While the former is generic, as it deals with processing pixels and extracting the graphic symbols they represent, the latter is more complex as it requires a high level of cognition to correctly understand and interpret the meaning the symbols recognized at the syntactic level convey. It is often the case that a complete syntactic recognition is not achieved without devising hypotheses to resolve problems in consistency and completeness that are found out while trying to apply semantics to the recognized symbols. Using the Object-Process Methodology (OPM) as a modeling tool, we have demonstrated how a generic system can be explicitly expressed with graphics means, making the point for the need to adopt a methodology that has a clear and concise visual formalism. Through scaling mechanisms built into OPM, the modeling can be done at any level of detail while maintaining a coherent view of the “big picture” with the single OPM model. Based on this application, as well as many others, it is recommended that OPM be used as the method of choice for modeling systems in general and graphics recognition systems in particular.
286
Dov Dori
References 1 2 3 4 5
6
7 8 9 10 11 12 13 14 15 16
Firlej, M. and Hellens, D. Knowledge Elicitation: a Practical Handbook. Prentice Hall, New York, p.144, 1991. Harel, D. Statecharts: a Visual Formalism for Complex Systems. Science of Computer Programming 8, pp. 231-274, 1987. Harel, D., On Visual Formalisms. Communications of the ACM 31, 5, pp. 514530, 1988. Harel, D., Biting the Silver Bullet: Toward a Brighter Future for System Development. Computer, pp. 8-20, Jan. 1992. Wand, W. and Weber, R. An Ontological Evaluation of Systems Analysis and Design Methods. In Information System Concepts: An in-depth Analysis. E.D. Falkenberg and P. Lindgreen (Eds.). Elsevier Science Publishers B.V. (North Holland), pp. 145-172, IFIP 1989. Bubenko, J.A. Jr.. Information System Methodologies – A Research Review. In T.W. Olle, H.G. Sol and A.A. Verrijn –Stuart (Eds.) Information System Design Methodologies – Improving the Practice. Elsevier Science Publishers B.V. (North Holland), IFIP, pp. 289-318, 1986. Rational University Web Site: http://www.rational.com/uml/resources/documentation/ D. Dori, Object-Process Analysis: Maintaining the Balance between System Structure and Behavior. Journal of Logic and Computation. 5(2) 227-249, 1995. D. Dori, Unifying System Structure and Behavior through Object-Process Analysis. Journal of Object-Oriented Programming, July-August, pp. 66-73, 1996. D. Dori and Y.J. Dori, Object-Process Analysis of a Hypertext Organic Chemistry Studyware. Journal of Computers in Mathematics and Science Teaching, 15, 1/2, (1996),65-84. D. Dori, Object-Process Analysis of Computer Integrated Manufacturing Documentation and Inspection Functions. International Journal of Computer Integrated Manufacturing, 9(5), 339-353, 1996. D. Meyersdorf and D. Dori, The R&D Universe and Its Feedback Cycles: an Object-Process Analysis. R&D Management, 27 (4), 333-344, 1997. M. Peleg and D. Dori, Extending the Object-Process Methodology to Handle Real-Time Systems. Journal of Object-Oriented Programming, 11, 8, pp. 53-58, 1999. D. Dori, Representing Pattern Recognition Embedded Systems through ObjectProcess Diagrams: the Case of the Machine Drawing Understanding System. Pattern Recognition Letters, 16 (4), 377-384, 1995. D. Dori, Arc Segmentation in the Machine Drawing Understanding Environment. IEEE Transactions of Pattern Analysis and Machine Intelligence (T-PAMI), 17 (1), 1057-1068, 1995. D. Dori and M. Weiss, A Scheme for 3D Object Reconstruction from Dimensioned Orthographic Views. Engineering Applications in Artificial Intelligence, 9 (1), 53-64, 1996.
Syntactic and Semantic Graphics Recognition
17
18 19 20
287
D. Dori and H. Hel-Or: Semantic Content-Based Image Retrieval Using ObjectProcess Diagrams. In A. Amin, D. Dori, P. Pudil and H. Freeman (Eds.) Advances in Pattern Recognition, Lecture Notes in Computer Science, Vol. 1451, 230-241, 1998. Dov Dori and Liu Wenyin, Automated CAD Conversion with the Machine Drawing Understanding System: Concepts, Algorithms, and Performance. IEEE Transactions on Systems, Man, and Cybernetics, 29, 4, pp.411-416, 1999. D. Dori and L. Wenyin, The Sparse Pixel Vectorization Algorithm and its Performance Evaluation. IEEE Transactions on Pattern Analysis and Machine Intelligence (T-PAMI), 21, 3 pp. 202-215, 1999. L. Wenyin and D. Dori, A Generic Integrated Line Detection Algorithm and its Object-Process Specification. Computer Vision – Image Understanding (CVIU), 70, 3, pp. 420-437, 1998.