Molecules 2015, 20, 18565-18584; doi:10.3390/molecules201018565 OPEN ACCESS
molecules ISSN 1420-3049 www.mdpi.com/journal/molecules Article
Synthesis, Fluorescence Properties, and Antiproliferative Potential of Several 3-Oxo-3H-benzo[f]chromene-2-carboxylic Acid Derivatives Xiao-Bo Fu †, Xian-Fu Wang †, Jia-Nian Chen *, De-Wen Wu, Ting Li, Xing-Can Shen and Jiang-Ke Qin State Key Laboratory Cultivation Base for the Chemistry and Molecular Engineering of Medicinal Resources, School of Chemistry & Pharmacy, Guangxi Normal University, Yucai Road 15, Guilin 541004, China; E-Mails:
[email protected] (X.-B.F.);
[email protected] (X.-F.W.);
[email protected] (D.-W.W.);
[email protected] (T.L.);
[email protected] (X.-C.S.);
[email protected] (J.-K.Q.) †
These authors contributed equally to this work.
* Author to whom correspondence should be addressed; E-Mail:
[email protected]; Tel./Fax: +86-773-2120-958. Academic Editor: Roman Dembinski Received: 1 August 2015 / Accepted: 7 October 2015 / Published: 13 October 2015
Abstract: In this study, two series of 3-oxo-3H-benzo[f]chromene-2-carboxylic acid derivatives (compounds 5a–i and 6a–g) were synthesized. Their in vitro proliferation inhibitory activities against the A549 and NCI-H460 human non-small cell lung cancer (NSCLC) cell lines were evaluated. Their photophysical properties were measured. Among these target compounds, 5e exhibited the strongest antiproliferative activity by inducing apoptosis, arresting cell cycle, and elevating intracellular reactive oxygen species (ROS) level, suggesting that it may be a potent antitumor agent. In addition, compound 6g with very low cytotoxicity, demonstrated excellent fluorescence properties, which could be used as an effective fluorescence probe for biological imaging. Keywords: 3-oxo-3H-benzo[f]chromene-2-carboxylic acid derivatives; proliferation inhibitory activity; photophysical property; antitumor; biological imaging
Molecules 2015, 20
18566
1. Introduction Coumarin (1,2-benzopyrone or 2H-1-benzopyran-2-one) and its derivatives, best-known as oxygen-containing heterocyclic compounds, are widely distributed in Nature and many exhibit diverse biological and interesting pharmacological activities. The numerous therapeutic applications of coumarin compounds include anti-coagulant effects [1], antitumor therapy [2–5], anti-HIV treatment [6,7], central nervous system stimulants and protective agents [8,9], antibacterial and anti-inflammatory drugs [10–12]. It has been found that the coumarin nucleus plays an important role as a valuable molecular template for the development of different structural analogues with improved pharmacological profiles. The different substituent groups connected with the coumarin nucleus strongly influence the biological activity of the resulting derivatives [13]. More importantly, the excellent fluorescent properties of coumarin compounds offer additional development value and they are used in many areas, such as fluorescent brighteners, fluorescent probes to monitor complex biological events, electroluminescent devices, photochemotherapy, etc. [14–16]. Recently we focused on anti-tumor activity screening and fluorescent performance of some coumarin-based compounds. In this report, two series of 3-oxo-3H-benzo[f]chromene-2-carboxylic acid derivatives including its amide (compounds 5a–i) and ester (compounds 6a–g) were efficiently synthesized (Scheme 1). Their biological activity and photophysical properties were evaluated. It was found that compound 5e exhibited the strongest in vitro proliferation inhibitory activity against the A549 and NCI-H460 cell lines, suggesting that it may be a potent antitumor agent. In addition, compound 6g with very low cytotoxicity demonstrated excellent fluorescence properties, which could be exploited for biological and biomedical imaging. CHO OH
1
COOH
(a) O
COCl
(b) O
O ) (d
(c)
COOR2 O
6a−g
O
4
3
O
CONHR1 O
O
5a−i
Scheme 1. Synthetic route to the target compounds 3-oxo-3H-benzo[f]chromene-2-carboxylic acid derivatives 5a–i and 6a–g. Reagents and conditions: (a) Meldrum’s acid (2), ethanol, pyridine, 80 °C, 4 h; (b) SOCl2, 1,2-dichloroethane, 60–70 °C, 4 h; (c) R1-NH2, triethylamine, CH2Cl2, room temperature (r.t.), 10–30 min; (d) R2-OH, triethylamine, CH2Cl2, r.t., 10–30 min. 2. Results and Discussion 2.1. Chemistry The synthetic route to the target 3-oxo-3H-benzo[f]chromene-2-carboxylic acid derivatives 5a–i and 6a–g is depicted in Scheme 1. Based on the method reported previously [17], we successfully prepared
Molecules 2015, 20
18567
the key intermediate 3-oxo-3H-benzo[f]chromene-2-carboxylic acid (3) via Knoevenagel condensation of 2-hydroxy-1-naphthaldehyde (1) with Meldrum’s acid (2). For the first step, cheap ethanol was selected as the solvent and pyridine as a catalyst. It was noted that an excess of Meldrum’s acid should be avoided because it could react with 3 [18]. Then 3-oxo-3H-benzo[f]chromene-2-carbonyl chloride (4) was obtained by chlorination in the presence of thionyl chloride. Compound 4 is easily hydrolyzed and converted back into the previous carboxylic acid 3 if it is exposed to the air for a long time, therefore 4 was used directly in the next step without further purification. Finally, different amines and alcohols were reacted with 4 to afford the target compounds 5a–i and 6a–g (Scheme 1). This method is convenient, efficient and can be used for constructing coumarin-based compound libraries; moreover, the byproducts are easy to remove, and the intermediate 3 is obtained in high yield and purity. O
H O H H O
N
N
O
O
O
O
O
O
H
R
O
OH
(1)
O
O
O
(I)
(2) H O
O
N
H2O
O
R O OH
O
R
O
O OH
(II)
O
O
O
(V)
O OH
(IV)
O O
R
O
R
(III) O
−acetone
O
O
N
OH
OH
R O
O
R=
CH2CH2
(3)
Scheme 2. Proposed mechanism of the pyridine-catalyzed Knoevenagel condensation for synthesizing 3-oxo-3H-benzo[f]chromene-2-carboxylic acid (3). After the target compounds were successfully prepared, the reaction mechanism for synthesizing the key intermediate 3-oxo-3H-benzo[f]chromene-2-carboxylic acid (3) was examined. As shown in Scheme 2, Meldrum’s acid (2), namely 2,2-dimethyl-1,3-dioxane-4,6-dione, is easily enolized and usually used as a good nucleophile in many reactions when malonate ester is ineffective [19]. In the presence of pyridine, Meldrum’s acid (2) is deprotonated to afford its enolate I which can be converted to the corresponding ketone form. Then the produced carbanion attacks the 2-hydroxy-1-naphthaldehyde substrate 1, and the intermediate II is obtained. However, II is prone to protonate, then lose a water molecule, and the olefine ketone III is produced [18,20]; meanwhile, the catalyst pyridine restores its initial state. Subsequently, an intramolecular nucleophilic addition occurs because the carbonyl carbon of III is susceptible to attack by the hydroxyl group, which gives the hemiacetal IV. The strain of the rightmost lactone ring combined with instability of the hemiacetal structure forces the loss of an acetone molecule, and the intermediate V is thus obtained [19,21]. However, because the hydroxyl group is directly linked with a carbocation, V is also unstable and easily loses a proton, which is captured by the carboxylate anion to form the carboxyl group and 3-oxo-3H-benzo[f]chromene-2-carboxylic acid (3) is obtained. Of course, with regard to the conversion from V to 3, there may be another path where the proton of the
Molecules 2015, 20
18568
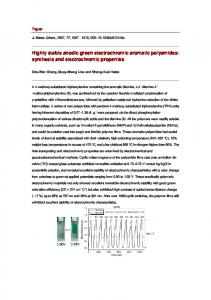
carboxyl group comes from a water molecule which was generated previously, rather than the hydroxyl group of V. From the above analysis, many proton-binding agents can be used as catalysts in the Knoevenagel condensation. Besides pyridine, maybe other bases, such as piperidine, piperidinium acetate, piperazine, and ammonium acetate are also appropriate [20,22]. 2.2. In Vitro Biological Activity 2.2.1. Antiproliferative Activities of the Target Compounds against A549 and NCI-H460 Cells in Vitro The in vitro proliferation inhibitory activity of the prepared compounds 5a–i and 6a–g was evaluated against two NSCLC cell lines including A549 and NCI-H460; 7-hydroxycoumarin (7-HC) and cisplatin were selected as dual positive reference drugs. The NSCLC cell lines were treated with the target compounds (final concentrations: 0, 5, 10, 20, 30, 40, 60 μM), and viable cells were measured by an MTT (3-(4,5-dimethylthiahiazol-2-y1)-2,5-diphenyltetrazolium bromide) assay. As shown in Table 1, most of the target compounds exhibited very low antiproliferative activities; especially, the IC50 values (IC50 represented the concentration at which cell growth was inhibited by 50%) of 3-oxo-3Hbenzo[f]chromene-2-carboxylic acid esters 6a–g were over 60 μM. To our delight, among the synthesized compounds, 5e displayed the best activities with IC50 values of 20.53 ± 1.84 for A549 and 29.19 ± 2.61 for NCI-H460 cells, respectively. After the co-incubation of A549 cells with 10, 20, and 30 μM compounds 5e for 48 h, the inhibition rates were 22.55% ± 1.97%, 52.59% ± 2.79% and 63.72% ± 3.09%, respectively. The decline of IC50 values with the prolonged incubation time is shown in Figure 1. At the same concentration, the proliferation inhibitory activity of 5e was superior to 7-HC, even though neither of them are comparable with cisplatin which has been extensively used to treat patients with NSCLC within the last several decades [23–25]. The above results suggest that compound 5e can induce a dose- and time-dependent proliferation inhibition of A549 and NCI-H460 cells. 40
(B)
A549
7-HC Cisplatin compound 5e
30
20
10
0
24 h
48 h
Incubation time
72 h
IC50 values (μM, Mean ± SD)
IC50 values (μM, Mean ± SD)
(A)
40
NCI-H460
7-HC Cisplatin compound 5e
30
20
10
0
24 h
48 h
72 h
Incubation time
Figure 1. Antiproliferative effects of compound 5e on NSCLC cell lines. (A) A549 and (B) NCI-H460 cells were treated with 7-HC, cisplatin, and 5e for the indicated time (24, 48, and 72 h), respectively. After treatment, cell viability was measured by MTT assay, then inhibition rate and IC50 values were obtained. In the figure, the antiproliferative activity data of 7-HC after the incubation with A549 and NCI-H460 cell lines for 24 h were omitted because the IC50 values were over 60 μM under this condition.
Molecules 2015, 20
18569
Table 1. In vitro antiproliferative activities of 3-oxo-3H-benzo[f]chromene-2-carboxylic acid derivatives against A549 and NCI-H460 cell lines. O R O
Compound
O
IC50 ± SD (μM) a,b A549 NCI-H460
R
5a
∗ HN
>60
46.41 ± 4.22
5b
∗ HN
>60
>60
>60
>60
38.71 ± 3.62
44.39 ± 2.98
20.53 ± 1.84
29.19 ± 2.61
29.72 ± 3.85
>60
5c
∗ HN
5d
∗ HN
5e 5f
O
∗ HN
O
F
∗ HN
F F
5g
H ∗ N
>60
>60
5h
∗ HN
>60
>60
>60
>60
>60 >60 >60 >60 >60
>60 >60 >60 >60 >60
>60
>60
>60 33.82 ± 2.62 15.42 ± 1.06
>60 38.55 ± 2.91 9.61 ± 0.83
5i
∗ HN
6a 6b 6c 6d 6e
O
∗
∗ O ∗
∗
∗
O
O
∗
6f 6g 7-HC Cisplatin
O
∗
O
O
— —
a
A549 and NCI-H460 cells were treated with the target compounds for 48 h. Results are expressed as means ± SD (standard deviation) of four independent experiments; b Compounds with IC50 values >60 μM are considered to be inactive.
2.2.2. Apoptosis Induced by Compound 5e To investigate whether the proliferation inhibitory activity of compound 5e was associated with induced apoptosis, Annexin V-FITC/propidium iodide (Annexin V/PI) dual staining method was used. As shown in Table 2 and Figure 2, after A549 cells were treated with compound 5e for 48 h, the population of apoptotic cells (early plus late apoptotic cells, Q2 + Q3 quadrants) increased significantly. Compared with 7-HC, 5e had more potent capability to induce apoptosis at the same concentration (20 µM). If the incubation time was extended to 72 h, the population of apoptotic cells was increased from 7.22% ± 0.52% for the control group to 10.9% ± 2.1% at 10 µM, then to 19.1% ± 1.4% at 20 μM for 5e (Table 2). Therefore, compound 5e can induce apoptosis of A549 cells in a concentration- and time-dependent manner; induced apoptosis is responsible for the antiproliferative activity of compound 5e against A549 cells.
Molecules 2015, 20
18570 5
10
5
10
Q4 Q3
4
10
4
10 4.78
Q1 Q2
0.91
3
3
10
10
1.81
2
9.05
2
10 0
10 0
5.62
3.62
0 102 103 104 105
0 102 103 104 105 7-HC, 20 μM
Control 5
5
10
4
10
PI
10
4
10 3.81 3
10
6.62
3
6.52
10
4.68
10 0
2
14.5
2
10 0
2
0 10
3
10
4
10
5
10
Compd. 5e, 10 μM
Annex V-FITC
3.69 2
0 10
3
10
4
5
10 10
Compd. 5e, 20 μM
Figure 2. Effects of compound 5e on the induction of apoptosis in A549 cells after the co-incubation for 72 h. The population of apoptotic cells was determined by flow cytometry. The experiment was repeated thrice. Here only representative flow cytometric graphs are shown. Table 2. Quantitative apoptosis assay of A549 using Annexin-V/PI dual staining method a. Group Control
Conc. b (µM) 0
48 h Incubation
72 h Incubation
Viable Cells
Apoptotic Cells
Necrotic Cells
(Q1, %)
(Q2 + Q3, %)
(Q4, %)
94.7 ± 2.6
4.72 ± 0.41
Q1 (%)
Q2 + Q3 (%)
Q4 (%)
0.62 ± 0.19
91.8 ± 3.3
7.22 ± 0.52
0.97 ± 0.13
7-HC
20
85.7 ± 2.8
11.3 ± 1.4 **
3.04 ± 0.29
81.1 ± 2.4
14.2 ± 1.9 *
4.71 ± 0.49
Compd. 5e
10
91.4 ± 3.1
6.51 ± 1.31
2.04 ± 0.31
85.3 ± 2.9
10.9 ± 2.1
3.77 ± 0.31
Compd. 5e
20
80.7 ± 2.5
13.9 ± 2.2 **
5.41 ± 0.62
73.9 ± 2.7
19.1 ± 1.4 **
6.98 ± 0.42
a
A549 cells were treated with the indicated concentrations of compound 5e for 48 and 72 h, respectively; subsequently the cells were stained with Annexin V-FITC and PI. The percentage of viable cells, apoptotic cells and necrotic cells is expressed as the means ± SD from three independent experiments; b Conc. is the abbreviation of concentration; * p < 0.05; ** p < 0.01 vs. the percentage of apoptotic cells of the control.
2.2.3. Cell Cycle Analysis Cell cycle distribution was examined to determine whether compound 5e inhibited the proliferation of A549 cells through cell cycle arrest. The cells were co-incubated with 5e and 7-HC for 48 and 72 h, respectively. Compound 5e treatment increased the population of cells in the G0/G1 phase in a concentrationand time-dependent manner. This was accompanied by a decrease in the population of cells in S and G2/M phases, compared with the control. As shown in Table 3 and Figure 3, the population of A549 cells in the G0/G1 phase was increased from 70.71% ± 2.79% (control) to 80.52% ± 2.29% at 20 μM, then to 85.51% ± 2.03% at 30 μM for 5e; meanwhile, apoptotic cell rate was elevated with increased dose, which was consistent with the above results of induced apoptosis. These data indicate that, besides induced apoptosis,
Molecules 2015, 20
18571
cell cycle arrest in the G0/G1 stage is also an important factor by which compound 5e exerts its inhibitory effects on A549 cells.
7-HC, 20 μM
Compd. 5e,10 μM
Count
Control
Compd. 5e, 20 μM
Compd. 5e, 30 μM
PI Figure 3. Effects of compound 5e on A549 cell cycle progression. A549 cells were treated with 5e for 72 h and analyzed by flow cytometry. The experiment was repeated thrice. Here only representative flow cytometric graphs are shown. Table 3. Effects of compound 5e on cell cycle progression in A549 cells a. Group
Conc. (µM)
G0/G1 Phase (%)
S Phase (%)
G2/M Phase (%)
Control 7-HC Compd. 5e Compd. 5e Compd. 5e
0 20 10 20 30
70.71 ± 2.79 79.83 ± 2.39 * 72.62 ± 2.67 80.52 ± 2.29 * 85.51 ± 2.03 *
16.79 ± 1.37 8.38 ± 0.44 15.77 ± 0.84 13.14 ± 1.01 8.82 ± 0.91
12.50 ± 1.41 11.79 ± 1.69 11.60 ± 1.31 6.31 ± 0.62 5.67 ± 0.43
a
A549 cells were treated with compound 5e or 7-HC for 72 h, then DNA content was analyzed through PI staining. Flow cytometry data were analyzed using the ModFit software. The results are presented as the means ± SD of three independent experiments; * p < 0.05 vs. the percentage of cells in G0/G1 phase of the control.
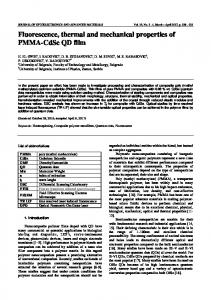
2.2.4. Induced ROS Generation by Compound 5e The intracellular ROS levels were measured before and after treatment with compound 5e. As shown in Figure 4A, exposure to over 20 μM of 5e caused a marked increase in fluorescence intensity of 2′,7′-dichlorofluorescein (DCF), which indicated the production of ROS in the mitochondria of A549 cells. Intracellular fluorescence intensity was further quantitatively analyzed using a luminescence spectrometer. The mean fluorescence intensities increased by 30.9%, 49.1%, and 66.1% after treatment with 20, 30, and 40 μM compound 5e, respectively. Similar results were obtained for 7-HC. The relative fluorescence intensity (% of control) was shown in Figure 4B after the cells were co-incubated with 5e
Molecules 2015, 20
18572
for 48 h. ROS overproduction is implicated in mediation of apoptosis and has been described as an early event [26]. Elevated intracellular ROS levels indicate that the balance between ROS generation and elimination is disrupted, which eventually results in cell apoptosis. Therefore, mitochondrial ROS overproduction and malfunction are responsible for compound 5e-induced apoptosis. (A)
200
150
150 150
100
100
50
50
0
100 50
0
2 3 4 5 0 10 10 10 10
Count
Control
2 3 4 5 0 10 10 10 10 7-HC, 20 μM
0
2 3 4 5 0 10 10 10 10
Compd. 5e,10 μM
150
150
100
100
50
50
120 90 60 30
2 3 4 5 0 10 10 10 10 Compd. 5e, 20 μM
(B)
Relative fluorescence intensity (%)
0
0
2 3 4 5 0 10 10 10 10 Compd. 5e, 30 μM
0
0 102 103 104 105
Compd. 5e, 40 μM
Ros
180
* *
160 140 120 100 80 60
1#
2#
3#
4#
5#
6#
Figure 4. Effects of compound 5e on the intracellular ROS level in A549 cells. (A) ROS level analysis using flow cytometry; (B) Quantitative analysis of relative fluorescence intensity (% of control) using a luminescence spectrometer. A549 cells were treated with 5e for 48 h and stained with 2′,7′-dichlorodihydrofluorescein diacetate (DCFH-DA) before monitoring ROS level. Notes of Figure 4B, 1#: Control; 2#: 7-HC (20 µM); 3#: 5e (10 µM); 4#: 5e (20 µM); 5#: 5e (30 µM); 6#: 5e (40 µM). Each bar represents the mean ± SD of three independent experiments; * p < 0.05 vs. control. 2.3. Absorption Spectra, Fluorescence Spectra, and Living Cell Imaging Fluorescence bioimaging provides a facile and less cell-damaging means of visualizing analytes of biological interest in living cells. From the viewpoint of the potential application of the synthesized 3-oxo-3H-benzo[f]chromene-2-carboxylic acid derivatives in biological imaging, we investigated these compounds’ photophysical performance. Firstly, the ultraviolet-visible (UV-Vis) absorption spectra of several representative compounds were recorded in 1,2-dichloroethane solution (final concentration:
Molecules 2015, 20
18573
50 μM). As shown in Figure 5, these compounds have a nearly identical absorption band ranging from 360 to 410 nm. The fluorescence spectra in the excitation of 360 nm were recorded at the concentration of 5 μM (Figure 6). The compounds 5g and 6a–g produce a strong blue emission band in the range of 430–445 nm, in comparison with 7-HC which has very weak fluorescence emission at 396 nm. At the same concentration (e.g., 5 μM), the fluorescence intensities of 3-oxo-3H-benzo[f]chromene-2-carboxylic acid esters 6a–g are sequentially elevated with the increase in the chain length of the terminal alkyl groups (Figure 6B). Their fluorescence quantum yields (Φf) in the solution state were determined using the standard procedures, with quinine sulphate (QS) dissolved in 0.1 M sulphuric acid as a reference standard (Φf = 0.54) [27]. The UV-Vis and fluorescence data including the absorption (λabs) and fluorescence (λem) maximal values, Stokes shift (νabs − νem), and Φf are summarized in Table 4. Compared with 7-HC, a remarkable red shift phenomenon in absorption and emission spectra of compounds 5g and 6a–g was observed. The above eight compounds display good Φf in the range of 0.44–0.66, which is superior to compounds 5a–f, 5h, 5i, and 7-HC with very low Φf (