Research Article pubs.acs.org/journal/ascecg
Synthesis of Distributed Biorefining Networks for the Value-Added Processing of Water Hyacinth José Ezequiel Santibañez-Aguilar,† José María Ponce-Ortega,*,† J. Betzabe González-Campos,‡ Medardo Serna-Gonzál ez, † and Mahmoud M. El-Halwagi§,∥ †
Chemical Engineering Department and ‡Institute of Chemical and Biological Researches, Universidad Michoacana de San Nicolás de Hidalgo, Morelia, Michoacán, México, 58060 § Chemical Engineering Department, Texas A&M University, College Station, Texas 77843, United States ∥ Chemical and Materials Engineering Department, Faculty of Engineering, King Abdulaziz University, P.O. Box 80204, Jeddah 21589, Saudi Arabia ABSTRACT: Water hyacinth causes severe ecological problems in the infested water bodies. Several strategies have been proposed to eliminate this plant. Nevertheless, most of them have not been economically attractive. This paper proposes a general superstructure and a mathematical programming model for the sustainable elimination of water hyacinth through a distributed biorefining network. The proposed model optimizes the selection of the products, the siting and sizing for the processing facilities, and the selection of the markets, while accounting for technical and economic constraints. A case study for the central part of Mexico, where water hyacinth is a serious problem, is used to show the applicability of the proposed holistic approach. The results show that an optimally synthesized distributed biorefining network is capable of sustainable and economic elimination of water hyacinth from contaminated water bodies while generating value. Additionally, the results shown through Pareto curves allow the identification of a set of optimal solutions featuring trade-offs between economic and environmental objectives. KEYWORDS: Water hyacinth, Biorefinery, Distributed systems, Sustainable design, Supply chain, Optimization
■
INTRODUCTION Water hyacinth (Eichhornia crassipes) is a key cause of concern in several water bodies (e.g., lakes, rivers, canals) around the world.1 This plant grows rapidly and can completely cover water bodies, causing difficulty of navigation and depletion of nutrients and dissolved oxygen that are essential for aquatic life. These effects have negative impact on the environment, human health, and economic development.2,3 To avoid the ecological problems associated with water hyacinth, several strategies have been proposed to control its growth. There are two main approaches for water hyacinth control in water bodies: one is chemical control and the other is mechanical control. Chemical control affects drastically the sustainability of the water systems because it uses herbicides and other toxic chemicals that have negative impacts in aquatic life. In addition, chemical processes for water hyacinth control are inefficient when there is substantial rain. On the other hand, the mechanical process is actually the most widely used method for water hyacinth elimination; however, the major drawback of this approach is that it consumes a lot of energy and, therefore, is economically inefficient. There are two other methods that alter directly the ecosystem. One of them is management of the habitat, which involves the change of the conditions in a given water body; however, the modifications on such conditions can cause adverse effects on others species of plants and animals. The second method is biological control, © 2012 American Chemical Society
which introduces another species into the ecosystem that must be able to consume the water hyacinth but also can affect drastically the aquatic life in the water body. It should be noted that, in many cases, water hyacinth quickly reappears due to its rapid growth. Recently, several uses for the water hyacinth have been reported, including its use for wastewater treatment4−6 and as feedstock for biofuels production. For instance, several techniques have been proposed for the production of bioethanol using water hyacinth as feedstock through fermentation,7−19 a set of compounds (methanol, ethanol, acetic acid, caproic acid, butyric acid, valeric acid, and heptanoic acid, among others) through the MixAlco process,20−22 and biogas and fertilizers through digestion.23−27 Water hyacinth can also be used as a biomass feedstock for combustion to provide heat in industrial facilities.28,29 However, these works are stand-alone studies that have not taken into account system interactions (e.g., effects of economies of scale on processing costs) nor supply chain optimization. Several studies have focused on supply chain optimization for biorefineries, particularly when agricultural sources are used as feedstock. The optimization of the supply chain has been Received: November 8, 2012 Revised: December 10, 2012 Published: December 19, 2012 284
dx.doi.org/10.1021/sc300137a | ACS Sustainable Chem. Eng. 2013, 1, 284−305
ACS Sustainable Chemistry & Engineering
Research Article
Figure 1. Schematic representation for the distribution of sources and sinks of the addressed problem.
• To what extent should the available water hyacinth be eliminated? • What to do with the produced clean water? • What is the tax credit (if any) required to make water hyacinth elimination economically attractive? Hence, the solution of such a model will provide the optimal configuration of the supply chain network that minimizes the total net cost considering simultaneously the remediation of water bodies. Notice that the model formulation must involve economic and environmental criteria. Therefore, this paper proposes a multi-objective mathematical programming model based on a superstructure of a distributed biorefinery system for the sustainable elimination of the water hyacinth from water bodies in a macroscopic system while accounting for economies of scale and production of biofuels, chemical products, and clean water satisfying technical and economic constraints. The proposed formulation considers two types of processing plants (central and secondary processing plants). The secondary processing plants are distributed facilities near to secondary water bodies infested with water hyacinth located in places far from industrialized zones with limited or small processing capacity; whereas the central processing facilities are big industrial facilities located in industrialized places. The unit processing cost in the secondary processing plants is greater than the unit processing cost in the central processing facilities; however, the advantage of the secondary processing facilities is that the overall transportation costs can be reduced when they are implemented because they contribute to a significant decrease in
presented as an MILP (Mixed Integer Linear Programming) problem considering several objectives.30 Some methodologies for obtaining optimal supply chains of biorefineries are based on a steady state operation.31−42 Other research efforts have included the dynamic behavior.35,42−44 Furthermore, recently some works on this topic have included environmental criteria for optimal selection of biorefinery configuration, raw materials, products, and processing paths,45−52 as well as optimal site selection involving transportation costs.53−57 Because bioresources are not constant in time, some methodologies have been developed to determine optimal supply chains under uncertainty.58,59 To make the processing of water hyacinth economically attractive and sustainable, economies of scale must be considered along with distributed configurations for the supply chain because of its sources (i.e., water bodies that require to be remediated), processing technologies, produced products, and consumers of the final products that are distributed in different places (Figure 1). Consequently, it is crucial to develop an optimization model for distributed biorefineries processing water hyacinth that allows answering the following questions: • What products should be produced? • What technologies should be used? • Where should the processing facilities be located? What should be the sizes of these processing facilities? • What are the optimal size and location for the central processing facilities? • What markets can be satisfied with the produced goods? • What are the associated transportation costs? 285
dx.doi.org/10.1021/sc300137a | ACS Sustainable Chem. Eng. 2013, 1, 284−305
ACS Sustainable Chemistry & Engineering
Research Article
the transport requirements of the raw material (water hyacinth), which represents the largest volume of material to be transported in the network. Therefore, in the proposed approach, the optimization model must select the optimal placement of central and secondary processing facilities as well as the associated capacity and distribution of products and raw materials accounting simultaneously for the harvesting, processing, and transportation costs. Hence, the proposed optimization model allows choosing the following issues: • Optimal products • Optimal technologies • Size and location of processing facilities • Size and location of central processing facilities • Satisfied demands for each market for the considered products • All distribution and transportation costs associated with the supply chain • Extent of elimination of available water hyacinth for each water body under consideration • Consumers of the produced clean water • Tax credit required to make this strategy economically attractive This paper is organized as follows: Outline of the Model Formulation section presents the definition of the addressed problem. Model Formulation section shows the proposed mathematical programming model. Results section presents the applicability of the proposed model to a case study, and finally, the conclusions of the paper are presented in the Conclusions section.
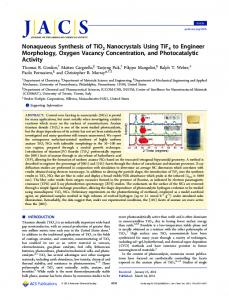
Figure 2. Representation of the potential uses of water hyacinth obtained from the water bodies.
products and biofuels can be sent by truck, train, or pipeline (if they are liquids) to the consumers. To efficiently solve this problem, this paper proposes to use the water hyacinth as a biomass source to produce biofuels and others products, which can be used to satisfy the energetic requirements and specific demands of products generated for the places of a given region. Therefore, the addressed problem in this paper can be defined as follows: given are a set of water bodies (s) with specified amounts of water hyacinth; also, given are several markets for the products manufactured with known demands (k). The problem then consists of determining the location for the processing facilities (i) and their sizes, the technologies used (j), the requirements of water hyacinth in the different places (m), and the distribution of the products (p). The objective is to find the optimal distributed biorefinery system that simultaneously minimizes the overall net cost (or maximizing the net profit), while maximizing the percentage of the eliminated water hyacinth in order to control the water hyacinth growth in different water bodies.
■
OUTLINE OF THE MODEL FORMULATION The water hyacinth can be considered as a raw material to produce a set of products because it includes biomass in its structure; in addition, this plant has a lot of water. In this regard, the water hyacinth is a source of clean water and dry biomass that can be obtained when this plant is processed. The removed water has some pollutants, so it has to be treated to eliminate them and yield clean water. Therefore, as shown in Figure 2, the processing of water hyacinth contributes to clean the water bodies and, at the same time, generates biomass and clean water that are valuable. The proposed model is based on the superstructure presented in Figure 3, which also considers the representation shown in Figure 4, where there are several places (rivers and lakes) distributed over a given region (shown in Figure 1) that have huge amounts of water hyacinth. In the optimization formulation, a superstructure must be constructed to include the possible places to locate the secondary and central processing facilities, the possible water bodies to be treated, and the possible consumers. The water bodies to be treated are the places infested by water hyacinth. The central processing facilities can be located in the places where there are huge amounts of available water hyacinth and are close to industrialized zones; whereas the secondary processing facilities can be located near to water bodies infested by the water hyacinth and far from industrialized zones. Usually, the secondary processing facilities are smaller than the central processing facilities, and the unit processing costs for the central processing plants are lower than those for secondary processing plants. Consumers are selected considering the demands for the products that can be produced by the system. The produced clean water can be sent to the near consumers by pipelines; whereas the chemical
■
MODEL FORMULATION Prior to the present model formulation, the following indexes used are defined: s represents the water bodies that are sources of water hyacinth, i is the processing facility, j corresponds to biomass processing technologies available, p corresponds to the bioproducts, k is used to represent the markets for the bioproducts, n is used to define the technologies used to treat the recovered water, c is used to define the pollutants present in the recovered water, and m represents the water consumers. This way, the proposed model will combine the supply chain and water networks optimization models for the optimal design of a water hyacinth-based biorefinery in a distributed macroscopic system. Then, the proposed model is stated as follows. Mass Balance for Harvesting of Water Hyacinth. There are two main methods to control the water hyacinth: chemical 286
dx.doi.org/10.1021/sc300137a | ACS Sustainable Chem. Eng. 2013, 1, 284−305
ACS Sustainable Chemistry & Engineering
Research Article
Figure 3. Superstructure for the distributed supply chain based on water hyacinth.
control and mechanical control. Some of the advantages of mechanical control are (a) removal of superfluous nutrients, (b) immediate control without significant damage to the ecosystem, and (c) suitablity for open flowing as well as closed water systems. However, mechanical control has an associated high energy consumption due mainly to the power requirement for harvesting. So, one of the most important factors for mechanical control of the water hyacinth is the large cost for harvesting, which is location dependent. The water hyacinth used at source s (Fwhs) can be harvested and processed to extract biomass (Fbs) and water (Fws). The harvesting technology can extract the biomass from the water hyacinth with a given efficiency (Zwhs) as follows: F whs·Z whs = F bs , s ∈ S
In this paper, the mechanical method is used for harvesting the water hyacinth. As was mentioned above, this method is widely used due to its advantages, although it is too expensive and time consuming.24 There are several machines for harvesting water hyacinth, for example, a conveyor-chopper, single conveyor, and modified clamshell bucket. These machines have a maximum limit of harvesting and an efficiency to obtain the water hyacinth. Several data for the water hyacinth harvesting process have been reported.24 Mass Balance for Splitters before the Processing Plants. The dry-biomass extracted from water hyacinth in each location s (Fbs) can be segregated and directed to the processing facility located in place i (f bhub s,i ) and to the central facility ( f bcen s ) to treat it and to obtain final products:
(1)
F bs =
In the same way, the harvesting technology can extract the water content in the water hyacinth with a given efficiency (Zws) as follows: F whs·Z ws = F ws, s ∈ S
i∈I
F whs ≤
s∈S
(4)
Balances for Mixers before the Processing Facilities. The total biomass flow rate inlet to the processing facility i and sent to the different bioconversion technologies j ( f bjhub i,j ) is equal to the sum of the biomass distributed from the different harvesting places s (f bhub s,i ) as follows:
(2)
Availability for Harvested Water Hyacinth. Harvested water hyacinth must be lower or equal than the maximum available water hyacinth (Fwhmax s ) at source s. F whmax s ,
cen ∑ f bhub s , i + f bs , s ∈ S
hub ∑ f bhub s , i = ∑ f bji , j ∀ i ∈ I
(3)
s∈S
287
j∈J
(5)
dx.doi.org/10.1021/sc300137a | ACS Sustainable Chem. Eng. 2013, 1, 284−305
ACS Sustainable Chemistry & Engineering
Research Article
Figure 4. Representation for the distributed supply chain based on water hyacinth.
Balances for Technologies Used in the Processing Facilities. In each processing facility, there are several technologies available that can be used to transform the biomass to final products. For example, biomass from the water hyacinth can be fermented to produce bioethanol; this process has been modeled previously,5−8 and the technical performance and associated costs have been determined. This way, the technologies available for the fermentation of the water hyacinth are characterized with known conversion factors (αhub j,p ) that represent the mass of product (i.e., p = bioethanol) produced for a given amount of biomass from water hyacinth. The general approach for the fermentation of water hyacinth to produce ethanol has been reported19 and is shown in Figure 5. The MixAlco process20−22,64 is an interesting technology that can be used to produce a mixture of mixed alcohols through fermentation, thermal conversion, and hydrogenation from biomass (Figure 6). This technology has been accurately modeled and optimized to determine its conversion efficiency20,60 (i.e., the amount of mixed alcohols obtained from a given amount of biomass, αhub j,p ). Anaerobic digestion is a biological process by which organic matter is degraded in the absence of oxygen producing biogas.24 The biogas produced can be used to generate energy or electricity. This has been an interesting option to produce energy given the rising cost of fossil fuels. An advantage is that the water hyacinth can be easily degraded because it has a high content of fermentable matter that can be transformed in biogas. Digestion of this plant can solve the problems caused by its excessive growth in the water bodies. However, this treatment has some special
technical requirements, which are difficult to implement in rural areas. The general process is shown in Figure 7. On the other hand, the water hyacinth can be treated to produce compost by aerobic decomposition. The compost is an interesting product where agriculture is a significant economic activity. It is important to note that, in this case, the high moisture content of the water hyacinth is an advantage because the preparation of 1 tonne of compost needs about 2700 L of water24 that can be obtained from the water hyacinth. Another option to obtain a useful product from water hyacinth is deoxy liquefaction.61 Deoxy liquefaction is a process where biomass can be converted into liquid fuels indirectly through gasification to syngas followed by catalytic conversion and direct liquefaction. In this process, most of the oxygen in biomass is released in the form of CO and CO2. There is about 2.9% oxygen contained in the oil. This process is classified as a hydrothermal process. This is an alternative to increase the energy content in the biomass. Direct burning is another option to use the water hyacinth; however, this plant has a moisture content of about 90%, and when its moisture is reduced, the energy density is close to 15.23MJ kg−1. This option can be used in small scale at places near water bodies to produce energy. Therefore, the optimization approach must select the type of technology used (j) in each processing facility (i) to produce the different products (p). This is modeled through the following relationships: hub f bjihub ·αjhub , p = wprod i , j , p, ∀ i ∈ I , j ∈ J , p ∈ P ,j
288
(6)
dx.doi.org/10.1021/sc300137a | ACS Sustainable Chem. Eng. 2013, 1, 284−305
ACS Sustainable Chemistry & Engineering
Research Article
Figure 5. General approach to produce ethanol from water hyacinth.
Figure 6. MixAlco process to yield bioethanol from water hyacinth.
Balances for Mixers before the Central Processing Facilities. The total biomass flow rate inlet to the central processing facilities and sent to the different bioconversion technologies ( f bcen s ) is equal to the sum of the biomass distributed from the different harvesting places s (wbcen j ) as follows:
to reduce the capital and operational costs associated to big units. This is modeled as follows: cen cen wbcen j · αj , p = wprod j , p , ∀ j ∈ J , p ∈ P
Balances for Splitters after Each Processing Facility. The products p obtained in the processing facility i (wprodhub i,j,p ) using different technologies j are segregated and directed to the consumers located in different places k (gprodhub i,j,p,k):
= ∑ wbcen ∑ f bcen s j s∈S
j∈J
(8)
(7)
wprod ihub ,j,p =
Balances for Technologies of Central Processing Facilities. In central processing facilities, there are several bioconversion technologies j available for transforming the biomass cen (wbcen j ) and to produce different products (wprodj,p ) with a given cen efficiency (αj,p ) that can be optimized previously. The advantage of the central facility is to account for the economies of scale and
∑ gprodihub ,j ,p,k, ∀ i ∈ I , j ∈ J , p ∈ P k∈K
(9)
Notice that the outlet flow rates in this equation are optimization variables, and therefore, it is not required to include explicitly slit fractions. The previous explanation also applies to all the splitters modeled in the optimization formulation. 289
dx.doi.org/10.1021/sc300137a | ACS Sustainable Chem. Eng. 2013, 1, 284−305
ACS Sustainable Chemistry & Engineering
Research Article
Figure 7. General description to produce biogas through anaerobic digestion from water hyacinth.
Balances for Splitters after the Central Processing Facilities. The products p obtained in the central processing facilities (wprodcen j,p ) using different technologies j are segregated and directed to the consumers located in different places k (gprodcen j,p,k): wprodcen j,p =
∑ gprodcen j ,p,k, ∀ j ∈ J , p ∈ P k∈K
treated with technology n can be sent to the water consumer m (hws,n,m), and this is modeled as follows: fWT = s,n
(10)
∑ h ws ,n,m = H W
s,m
=
(16)
Component Balance for Mixers before Each Water Consumer. The following balances are required to determine the components present in the water directed to the consumers (Zwcon s,m,c):
j∈J
∀ p ∈ P, k ∈ K
(15)
, ∀ s ∈ S, m ∈ M
n∈N
cen ∑ ∑ gprodihub , j , p , k + ∑ gprod j , p , k
Gpcon ,k ,
h ws , n , m, ∀ s ∈ S , n ∈ N
Mass Balance for Mixers before Each Water Consumer. The total water flow rate directed to the water consumer m (HWs,m) is equal to the sum of the water flow rate from any treatment unit n (hws,n,m):
Balances for Markets. The product p inlet to the market in place k (Gcon p,k ) is equal to the products sent from all preprocessing plants (gprodhub i,j,p,k) and the central processing facilities (gprodcen j,p,k): i∈I j∈J
∑ m∈M
(11)
∑ (h ws ,n,m·Z w out s , n , c)
Demands for Consumers. The flow rate for each product p inlet to the market k (Gcon p,k ) must be lower than the maximum max demand in each location (Gcon p,k ):
n∈N
= H Ws ,m·Z w con s ,m,c, ∀ s ∈ S , m ∈ M , c ∈ C
(17)
max
con Gpcon , ∀ p ∈ P, k ∈ K , k ≤ Gp , k
It is important to note that eq 17 is a nonlinear relationship because it has a bilinear term, which is formed by the product of the composition of pollutant in the discharge of the water treatment units (Zwcon s,m,c) and the total water flow rate directed to the water consumers (HWs,m). This is the only one nonlinear relationship in the model. Demand for Water Consumers. Each water consumer m has a specific maximum water demand (Hmax wi,m ). This constraint is written as follows:
(12)
Balances for Water Treatment in Each Source. The water extracted from the water hyacinth in each source (Fws) is sent to a set of treatment technologies n ( f wts,n) to eliminate given pollutants to make it suitable for specific uses: F ws =
∑ f wts ,n, ∀ s ∈ S n∈N
(13)
Water Treatment Technology in Each Source. There are several treatment technologies n available to eliminate the pollutants c for the water extracted from the water hyacinth with given efficiencies γn,c, relating the inlet composition to the water treatment technologies Zwini,c with the outlet composition Zwout i,n,c as follows: in Z w out s , n , c = Z w s , c · (1 − γn , c), ∀ s ∈ S , n ∈ N , c ∈ C
H Ws ,m ≤ H wmax , ∀ s ∈ S, m ∈ M s,m
(18)
Constraints for Water Quality for Each Consumer. There are specific constraints for the concentration of some pollutants c in each water consumer depending on the use; max therefore, the maximum water concentration (Zwcon s,m,c ) for each consumer is stated as follows:
(14)
Mass Balance for Splitters after Water Treatment. Water extracted from the water hyacinth from source s and
max
con Z w con s ,m,c ≤ Z w s ,m,c , ∀ s ∈ S , m ∈ M , c ∈ C
290
(19)
dx.doi.org/10.1021/sc300137a | ACS Sustainable Chem. Eng. 2013, 1, 284−305
ACS Sustainable Chemistry & Engineering
Research Article
Operational Cost for Processing Facilities. The operational cost for the processing facilities (CostHubop i,j ) depends on the treated flow rate of biomass from the water hyacinth ( f bhub i,j ) and the associated unit cost (βhubop ) for each source i and j processing technology j: costHubiop, j = f bjihub ·βjhubop , ∀ i ∈ I , j ∈ J ,j
Then, each continuous variable is disaggregated as follows: f bjihub = ,j
Aihub ,j =
Bfihub = ,j
∑ dBihub ,j,q , ∀ i ∈ I , j ∈ J (25)
Then, the relationships are stated in terms of the disaggregated variables as follows: min
hub hub f bihub , j , q · yi , j , q ≤ df bi , j , q max
hub ≤ f bihub , j , q · yi , j , q , ∀ i ∈ I , j ∈ J , q ∈ Q
(21)
⎡ ⎤ Yihub ,j,q ⎢ ⎥ ⎢ hubmin hub hubmax ⎥ ∨ ⎢ f bi , j , q ≤ f bi , j ≤ f bi , j , q ⎥ ⎥, i ∈ I , j ∈ J q ⎢⎢ hub ⎥ Aihub , j = ai , j , q ⎢ ⎥ hub hub hub ⎢ ⎥ b b = · Bf f i , j , q i , j i,j ⎣ ⎦
= 1, ∀ i ∈ I , j ∈ J ∑ yihub ,j,q
Table 1. Available Biomass from Water Hyacinth for Each Water Body infested area (ha)
annual wet biomass production (tonnes/year)
reference for infested area
4500 3037 9628 5820 4548 1508 1,719,220
6,887,903 4,648,569 14,737,052 8,908,355 6,961,374 2,308,213 2,631,516,762
62 63 64
hub hub dAihub , j , q = ai , j , q · yi , j , q , ∀ i ∈ I , j ∈ J , q ∈ Q
(27)
hub hub dBihub , j , q = bi , j , q · df bi , j , q , ∀ i ∈ I , j ∈ J , q ∈ Q
(28)
Table 3. Water Demand for Each Water Consumer and Quality Required72,73
(22)
q∈Q
(26)
In the previous disjunction, for a given treated flow rate ( f bhub i,j,q ), relationship 26 is used to activate the corresponding binary variable; then, just one binary variable (yhub i,j,q ) can take a value of one because of relationship 22. Next, the disaggregated variables are calculated through eqs 27 and 28. Notice that only the disaggregated variables for the active segment q are able to take values greater than zero, and these
Previous disjunction is reformulated as follows. First, only one linear segment can be selected:
1530 1530 1530 1530 1530 1530 1530
(24)
q∈Q
The term (Bf hub i,j ) is modeled through the following disjunction:
Chapala Patzcuaro Cuitzeo Yuriria Sayula Atotonilco Balsas
∑ dAihub ,j,q , ∀ i ∈ I , j ∈ J q∈Q
(20)
hub hub costHubicap , j = A i , j + Bfi , j , ∀ i ∈ I , j ∈ J
water body
(23)
q∈Q
Capital Cost for Processing Facilities. The capital costs for the processing facilities (CostHubi,jcap) are determined considering nonlinear functions with fixed (Ahub i,j ) and variable hub σ terms (Bhub ·(f b ) ), where σ is usually between 0.6 and 0.9 to i,j i,j account for the economies of scale. In this work, the second nonconvex term is replaced by a set of linear segments as follows:
wet biomass production (tonne/ha year)
∑ df bihub ,j,q , ∀ i ∈ I , j ∈ J
65−69 65−69 65−69 65−69
water consumer
water demand (hm3/year)
use
maximum concentration pollutant (mass fraction)
Morelia Lazaro Cardenas Guadalajara Queretaro Leon Patzcuaro Celaya Zamora Uruapan Yuriria Cuitzeo Zacapu
141 23 496 104 186 17 91 36 61 14 5 14
public industrial industrial industrial industrial public industrial public public public public industrial
5.00 1.00 1.00 1.00 1.00 5.00 1.00 5.00 5.00 5.00 5.00 1.00
× × × × × × × × × × × ×
10−07 10−06 10−06 10−06 10−06 10−07 10−06 10−07 10−07 10−07 10−07 10−06
Table 2. Demands for Each Product at Each Place70,71 product consumer
ethanol (tonnes/year)
biogas (tonnes/year)
acetic acid (tonnes/year)
compost (tonnes/year)
HCF (tonnes/year)
energy (GJ/year)
Morelia Lazaro Cardenas Guadalajara Queretaro Leon Patzcuaro Celaya Zamora Uruapan Yuriria Cuitzeo Zacapu
40,512 9933 212,523 44,548 79,798 4877 78,071 31,014 52,554 11,796 4704 12,241
706 173 3705 777 1391 85 1361 541 916 206 82 213
797 195 4179 876 1569 96 1535 610 1034 232 93 241
799 20 419 88 157 96 154 61 104 23 9 24
465 114 2441 512 917 56 897 356 604 135 54 141
20,382 4998 106,923 22,413 40,147 2454 39,279 15,604 26,441 5935 2367 6159
291
dx.doi.org/10.1021/sc300137a | ACS Sustainable Chem. Eng. 2013, 1, 284−305
ACS Sustainable Chemistry & Engineering
Research Article
The term (Bf cen j ) is modeled through the following disjunction:
are assigned to the original continuous variables through eqs 23−25. It is noteworthy that the advantage of using disjunctive formulations is the easy representation and reformulation of complicated logical relationships; the disjunctive formulation does not affect the solution strategy because the corresponding algebraic reformulation is the one that is solved. Operational Cost for Central Processing Facilities. The operational cost for central processing facilities (CostCenop j ) depends on the treated flow rate of biomass from the water cenop hyacinth (wbcen ) for each j ) and the unit cost associated (βj processing technology j:
⎡ ⎤ Y jcen ,q ⎢ ⎥ ⎢ cen min cen cen max ⎥ ∨ ⎢ wbj , q ≤ wbj ≤ wbj , q ⎥ ⎥, j ∈ J q⎢ Ajcen = ajcen ,q ⎢ ⎥ ⎢ ⎥ cen cen cen Bf j = bj , q ·wbj ⎢⎣ ⎥⎦
The previous disjunction is reformulated as follows: = 1, ∀ j ∈ J ∑ yjcen ,q
(29)
wbcen = j
Capital Cost for Central Processing Facilities. The capital costs for central processing facilities (CostCencap j ) are determined considering the fixed (Acen j ) and variable parts in the same way than for preprocessing facilities as follows: costCen cap j
=
Ajcen
+
Bf jcen ,
(31)
q∈Q
cen cenop costCen op ,∀j∈J j = wbj · βj
∀j∈J
∑ dw cen j,q , ∀ j ∈ J (32)
q∈Q
Ajcen =
∑ dAjcen ,q , ∀ j ∈ J (33)
q∈Q
(30)
Bf jcen =
∑ dBjcen ,q , ∀ j ∈ J (34)
q∈Q
Table 4. Efficiency To Remove the Pollutant for Each Technology Considered technology to eliminate Cr(VI)
efficiency
ion exchange resins ion exchange Mexican clinoptilolite electroplating HA 216
min
(35)
reference
0.99 0.2 0.5
dAjcen ,q
74 75 76
dBf jcen ,q
technology
ethanol
acid hydrolysis and fermentation, 10% sulfuric Acid ethanol acid hydrolysis and fermentation, 1% sulfuric Acid biogas anaerobic digestion compost composting acetic acid MixAlco process high caloric fuel deoxy liquefaction energy cogeneration
conversion factor
units
reference
0.19
g/dry g
6, 7
0.35
g/dry g
7
291 0.7 0.3 0.05 15.23
mL/dry g g/dry g g/dry g g/dry g kJ/dry g
23 24 20 61 61
=
cen ajcen , q · yj , q ,
=
∀ j ∈ J, q ∈ Q
cen bjcen , q · dw j , q ,
(36)
∀ j ∈ J, q ∈ Q
(37)
The explanation for previous relationships is similar to the one corresponding to the distributed processing facilities. Operational Cost for Water Treatment Units. The operational cost for the water treatment units (CostWTop s,n ) depends on the water flow rate treated (f wts,n) and the unit cost associated (βwtop s,n ) for each treatment unit n:
Table 5. Efficiencies for Processing Technologies product
max
cen cen cen cen wbcen j , q · yj , q ≤ dw j , q ≤ wbj , q · yj , q , ∀ j ∈ J , q ∈ Q
wtop costWTop s , n = f wts , n· βs , n , ∀ s ∈ S , n ∈ N
(38)
Capital Cost for Water Treatment Units. Capital costs for water treatment units (CostWTcap s,n ) are determined considering the fixed (AWT s,n ) and variable parts in the same way than for distributed processing facilities as follows: WT WT costWTcap s , n = A s , n + Bf s , n , ∀ s ∈ S , n ∈ N
(39)
Table 6. Transportation Costs for Biomass from Water Hyacinth Sources to Processing Plantsa water Body
a
Chapala
processing plant
distance (km)
transp $US/ tonne
Morelia Lazaro Cardenas Leon Queretaro Guadalajara Celaya Zamora Uruapan Yuriria Cuitzeo Zacapu
284 555 253 359 48 299 152 261 301 272 214
22.44 43.85 19.99 28.36 3.79 23.62 12.01 20.62 23.78 21.49 16.91
Patzcuaro distance (km)
transp $US/ tonne
59 263 259 244 282 194 132 57 117 88 65
4.66 20.78 20.46 19.28 22.28 15.33 10.43 4.50 9.24 6.95 5.14
Cuitzeo distance (km)
transp $US/ tonne
34 341 178 161 275 109 159 141 30 1 99
2.69 26.94 14.06 12.72 21.73 8.61 12.56 11.14 2.37 0.08 7.82
Yuriria distance (km)
transp $US/ tonne
64 378 145 139 306 67 188 172 1 30 130
5.06 29.86 11.46 10.98 24.17 5.29 14.85 13.59 0.08 2.37 10.27
Sayula distance (km)
transp $US/ tonne
394 427 329 456 111 415 203 304 408 379 321
31.13 33.73 25.99 36.02 8.77 32.79 16.04 24.02 32.23 29.94 25.36
Atotonilco
Balsas
distance (km)
transp $US/ tonne
distance (km)
transp $US/ tonne
297 476 329 358 111 317 143 244 315 284 228
23.46 37.60 25.99 28.28 8.77 25.04 11.30 19.28 24.89 22.44 18.01
250 67 456 439 434 389 270 168 314 283 259
19.75 5.29 36.02 34.68 34.29 30.73 21.33 13.27 24.81 22.36 20.46
Based on a constant transportation cost of $US 0.079/ (tonne km) to transport biomass for highway. 292
dx.doi.org/10.1021/sc300137a | ACS Sustainable Chem. Eng. 2013, 1, 284−305
ACS Sustainable Chemistry & Engineering
Research Article
Figure 8. Solution procedure of the addressed problem.
The term (Bf WT i,n ) is modeled through the following disjunction:
f wts , n =
⎡ ⎤ YsWT ,n,q ⎢ ⎥ ⎢ min max ⎥ ≤ ≤ f wt fwt f wt s,n,q s,n s,n,q ⎥ ∨⎢ ⎢ ⎥, ∀ s ∈ S , n ∈ N , q ∈ Q q WT AsWT ⎢ ⎥ , n = as , n , q ⎢ ⎥ ⎢⎣ Bf sWT ⎥⎦ = bsWT , n , q · f wts , n ,n
Aswt ,n = Bf swt = ,n
q∈Q
(41)
∑ dAswt,n,q , ∀ s ∈ S , n ∈ N (42)
q∈Q
∑ dBf swt,n,q , ∀ s ∈ S , n ∈ N q∈Q
(43)
wt f wtmin s , n , q· ys , n , q ≤ df wts , n , q
The previous disjunction is reformulated to obtain:
∑ yswt,n,q = 1, ∀ s ∈ S , n ∈ N
∑ df wts ,n,q, ∀ s ∈ S , n ∈ N q∈Q
wt ≤ f wtmax s , n , q· ys , n , q , ∀ s ∈ S , n ∈ N , q ∈ Q
(40)
(44) 293
dx.doi.org/10.1021/sc300137a | ACS Sustainable Chem. Eng. 2013, 1, 284−305
ACS Sustainable Chemistry & Engineering
Research Article
wt wt dAswt , n , q = as , n , q · ys , n , q , ∀ s ∈ S , n ∈ N , q ∈ Q
(45)
dBf swt = bswt , n , q · dwts , n , q, ∀ s ∈ S , n ∈ N , q ∈ Q ,n,q
(46)
Total Capital Cost. The total capital cost (CostCapital) includes the associated costs for the distributed processing cap facilities (CostHubcap i,j ), central processing facilities (CostCenj ), cap and water treatment units (CostWTs,n ): costCapital =
The explanation for previous relationships is similar to the one corresponding to the distributed processing facilities. Harvesting Cost. The water hyacinth harvesting cost (CostHarvesting) is determined on the basis of the amount harvested (Fwhs) and the associated unit harvesting cost ) for each location s as follows: (βHarvesting s costHarvesting =
∑ F whs·βsHarvesting
i∈I j∈J
+
SalesProd =
h wts , n , m·β wtTransp s,n,m
TAC = costHarvesting + costTransWater + costTransBM
Biomass Transportation Cost. The biomass transportation cost (CostTransBM) includes the biomass transportation ) cost from the source to the processing facilities (βbhubTransp s,i ): and to the central processing facilities (βbcenTransp s
+ costTransProd + costOperational + KF ·costCapital − SalesProd − TAXCredit (54)
Transp bhub s , i · β bhubs , i
Percentage of Eliminated Water Hyacinth. In this study, the environmental objective function is to maximize the percentage of eliminated water hyacinth. This function is environmentally representative because it indicates how much water hyacinth is eliminated from water bodies. The percentage of eliminated water hyacinth is defined as follows:
s∈S i∈I
+
Transp ∑ f bcen s · β bcen s
(49)
s∈S
Products Transportation Cost. The transportation cost for the products includes the one corresponding for the transportation of products from the processing facilities (βhubprodTransp i,j,p,k ) and from the central processing facilities (βcenprodTransp j,p,k ): costTransProd =
consume = 100
■
Transp ∑ ∑ ∑ ∑ gprodihub , j , p , k · β hubprod i , j , p , k i∈I j∈J p∈P k∈K
+
∑∑ ∑ ∑
Transp gprod icen , j , p , k · β cenprod j , p , k
i∈I j∈J p∈P k∈K
(50)
Total Operational Cost. The total operational cost (CostOperational) is given by the sum of the associated costs to the operation of the distributed processing facilities op (CostHubop i,j ), central processing facilities (CostCenj ) and op water treatment units (CostWTs,n ): costOperational =
∑ ∑ costHubiop,j + ∑ costCenopj i∈I j∈J
+
∑∑ s∈S n∈N
j∈J
costWTop s,n
βwat m
In previous relationship, and are the unit prices for the products p and water m, respectively. Total Net Annual Cost (Negative of Total Net Profit). The total net annual cost for the overall system (TAC) (which is equal to the negative of the total net annual profit) includes the water hyacinth harvesting cost (CostHarvesting) plus the transportation cost associated to the water (CostTransWater), biomass (CostTransBM) and products (CostTrans Pr od), plus the operational (CostOperational) and capital costs (CostCapital), minus the total sales (Sales Pr od) and the tax credit (TAXCredit). Therefore, the total net annual cost is stated as follows:
(48)
∑∑f
H ws , mβmwat (53)
s∈S n∈N m∈M
costTransBM =
(52)
s∈S m∈M
βprod p
s∈S n∈N
∑∑ ∑
∑ ∑ Gpcon,k βpprod + ∑ ∑ p∈P k∈K
∑ ∑ f wts ,n·β wtTransp s,n +
∑ ∑ costWTcap s,n
Total Sales. The total sales (sales prod) correspond to the sales of the products and water as follows:
Notice that the unit harvesting costs depend on the place because the difficulty associated to this operation is different for each location. It should be noted that an important factor included in the harvesting costs is the energy required. Water Transportation Cost. The water transportation cost consists of the transportation of untreated and treated water and βwtTransp considering the unit costs βwtTransp s,n s,n,m , respectively: costTransWater =
j∈J
s∈I n∈N
(47)
s∈S
cap ∑ ∑ costHubicap , j + ∑ costCen j
(51) 294
∑s F whs ∑s F whmax s
(55)
REMARKS • The optimization problem consists of minimizing the TAC (given by eq 54) and maximizing the percentage of eliminated water hyacinth (given by eq 55) subject to relationships 1−53. To solve this multi-objective optimization model, the constraint method has been implemented; this way, to generate a set of Pareto solutions that trade-off these two objectives, the problem for minimizing the TAC subject to relationships 1−53 and subject to one of the following constraints consume ≥ ε or consume ≤ ε must be solved for several values of ε. The first constraint allows generating a Pareto curve for high elimination of water hyacinth, while the second one is to obtain a Pareto curve for low elimination of water hyacinth. • The model considers simultaneously the supply chain for the bioproducts obtained from the water hyacinth, the dx.doi.org/10.1021/sc300137a | ACS Sustainable Chem. Eng. 2013, 1, 284−305
ACS Sustainable Chemistry & Engineering
Research Article
Figure 9. Pareto curves for alternative 1 (TAC versus percentage of eliminated water hyacinth).
remediation of the water bodies, and the recycle and reuse of the recovered water. • The optimization model simultaneously optimizes the selection of bioconversion technologies for the water hyacinth and the water treatment; it also takes into account the optimization of the size and location for the distributed processing and central processing facilities to account for the economies of scale. In addition, the model considers which products should be selected (bioproducts and type of water) and the optimal distribution for the products in the different markets. • This optimization model could be very useful to solve an environmental problem (controlling water hyacinth in water bodies) and, at the same time, to obtain economic benefits due to revenues from sale of products (bioproducts and water). • For modeling, the splitters only mass balances are required, which state that the flow of the inlet stream is equal to the flows of the outlet streams. It is noteworthy that the flows of the outlet streams are optimization variables (this is, the outlet flow rates are determined by the optimization process), and therefore, it is not required to include a split fraction because it is implicit in the optimization process.
■
• If the number of potential places to install central and distributed processing facilities is big enough, the associated number of binary variables can be increased significantly. In this case, also the CPU time required to solve the problem increases exponentially. If this CPU time is huge enough, a prescreening approach can be implemented to eliminate potential places that may not be promissory (i.e., water bodies with small amount of water hyacinth, places far from the consumers, etc.).
RESULTS
To show the applicability of the proposed methodology, a case study from Mexico is used. This case is considered because the central part of Mexico has a lot of water bodies highly infested with water hyacinth; therefore, the sustainability of these systems is in risk. Several approaches have been proposed, and some of them have been implemented to solve this problem (including several chemical and physical treatments) without good results (some of them are very expensive, others have severe adverse adjacent impacts, and others are not efficient to eliminate the water hyacinth). To apply the proposed methodology in such a region, first the potential harvesting sites are identified as the water bodies seriously infested with water 295
dx.doi.org/10.1021/sc300137a | ACS Sustainable Chem. Eng. 2013, 1, 284−305
ACS Sustainable Chemistry & Engineering
Research Article
Figure 10. Pareto curves for alternative 2 (TAC versus % eliminated water hyacinth).
presents the demand at each place for such products. Table 3 gives the water demand for each place with the quality constraints for the pollutants considered. The treatment technologies available for obtaining water from water hyacinth are given in Table 4, which also shows the removal efficiency for each technology (in this case only Cr(VI) is considered as the only pollutant in water; however, the study can be extended to include additional pollutants). Table 5 presents the efficiency to obtain the products for the different technologies considered. On the other hand, the biomass is transported in truck by highways (because transportation by truck is the most widely used in this zone of Mexico); the unit biomass transportation costs are shown in Table 6. The water transportation is by pipelines, and the water transportation cost is about $US 1.63/m3 transported water for a distance from 500 m. Using these data, the model formulation was coded in GAMS, and this consists of 210 binary variables, 8054 continuous variables, and 2958 constraints. The problem was solved using a computer with an i7 processor at 2.2 GHz with 6 GB of RAM. Notice that the MINLP (Mixed Integer NonLinear Programming) problem has to be solved several times to determine the Pareto curve TAC versus percentage of eliminated water hyacinth. Therefore, good initial guesses must be required to properly solve the MINLP problem. Also, notice that there is a bilinear term in eq 17, which introduces nonconvexities into the model of the problem. Therefore, it is necessary to propose a solution strategy to generate good
hyacinth. Thus, the Lake of Chapala is one of the harvesting sites proposed because it is the most important lake of Mexico and is infested with water hyacinth, too. This lake is very close to Guadalajara, the second largest city of Mexico. Another site is the Balsas River, which is one of the greatest rivers in the central part of Mexico. This river supplies cooling water to the most important thermo-electric plant in the state of Michoacan in Mexico. In addition, the Lakes of Patzcuaro and Cuitzeo are proposed as harvesting sites. These lakes are close to the cities of Patzcuaro and Morelia, respectively; the Lake of Patzcuaro has an endemic species of fish named white fish, and tourism and fishing are the most important activities in this region. Also, the lake of Yuriria is an important lake of the state of Guanajuato and is infested with water hyacinth. In this regard, these harvesting sites are very important water bodies in the considered system. Furthermore, the refinery candidates correspond to the main cities around such water bodies because the objective of a distributed system is to decrease the costs (manly transportation costs), and hence, the transportation distances must be short. Besides, the demand zones are located in cities around the water bodies because these locations have a given demand of biofuels, water, and chemicals, among others products. Figure 1 shows the water bodies polluted with water hyacinth, and Table 1 presents the available biomass of water hyacinth for each place considered in this example. In addition, Figure 1 shows the places that demand some bioproducts (in this case, the bioproducts considered are ethanol, mixed alcohols, biogas, fertilizers, and biomass for heating), and Table 2 296
dx.doi.org/10.1021/sc300137a | ACS Sustainable Chem. Eng. 2013, 1, 284−305
ACS Sustainable Chemistry & Engineering
Research Article
Figure 11. Representation of eliminated water hyacinth at each source and overall.
variables, the original MINLP problem is solved without complications. The suggested solution strategy to solve this problem was implemented in the modeling language GAMS. First, the MILP problem is solved using the solver CPLEX. The solution of the MILP problem provides the values of the integer variables that are used to solve the RMINLP problem using any one of the solvers CONOPT, MINOS, or SNOPT. After that, the amount of eliminated water hyacinth is specified as 3 times the eliminated water hyacinth corresponding to the RMINLP solution in order to solve the MINLP with DICOPT. If the previous strategy produces an infeasible solution, then it is necessary to use the solver CPLEX for solving the MILP problem and the solver BARON for solving the RMINLP problem and the original MINLP problem. The problem was solved for different levels of the constraints to get the Pareto curve; each point of the Pareto curve consumes from 1.39 to 4.73 s when the solver CONOPT, MINOS, or SNOPT are used to solve the RMINLP problem, from 0.172 to 0.218 s when the solver CPLEX is used to solve the MILP problem, from 2.76 to 3.12 s when the solver DICOPT is used to solve the MINLP problem and, finally, from 548.28 to 1203 s when the solver BARON is used to solve the RMINLP as
initial values because the quality of the solution for the full MINLP problem depends on the starting point of the optimization. If the starting point was bad, the conventional MINLP solvers (e.g., DICOPT, BARON, and SBB) could fail to provide a feasible solution or converge to a local optimum far from the optimal global. To generate an effective initialization of variables, the following strategy is proposed. First, a simplified MILP (Mixed Integer Linear Programming) problem is formulated and solved to obtain good initial guesses for the binary variables. This problem does not include eq 17, which is the only expression in the model that contains nonlinear terms. Then, an analysis to determine the best values for the percentage of eliminated water hyacinth was carried out to obtain initial guesses for the continuous variables. In this analysis, values for the eliminated water hyacinth between 0.5 and 4 times of the solution provided by the RMINLP (Relaxed Mixed Integer NonLinear Programming) problem (RMINLP corresponds to the case when the binary variables are transformed into continuous variables) were tested. This sensitivity analysis showed that the best value to provide good initial guesses corresponds to 3. Using the initial guesses so obtained for integer and continuous 297
dx.doi.org/10.1021/sc300137a | ACS Sustainable Chem. Eng. 2013, 1, 284−305
ACS Sustainable Chemistry & Engineering
Research Article
Figure 12. Distribution of the satisfied demands of products at different consumer sites for the points indicated in Figures 9 and 10.
(0, 0.1, 0.3, and 0.5 $US/tonne eliminated water hyacinth). For each tax credit, a Pareto curve was obtained, all of which are shown in Figures 9 and 10. It is important to note that the harvesting cost for the standalone operation that only eliminates the water hyacinth is
well as the MINLP problems. The general solution procedure is presented in Figure 8. In addition, the problem was solved for several tax credits, which is a subvention for eliminating water hyacinth from the sources. In this case, four tax credits were considered 298
dx.doi.org/10.1021/sc300137a | ACS Sustainable Chem. Eng. 2013, 1, 284−305
ACS Sustainable Chemistry & Engineering
Research Article
Figure 13. Pareto curves for the TAC versus produced water (Alternative 1).
A set of points were selected to observe the change of the TAC with respect to the harvesting cost; for example, in point A, the harvesting cost is $US 2,564,582 and the TAC is $US −1.72 × 10⁷, then the difference between the TAC and the harvesting cost is about 700% of the harvesting cost. This is explained by the large sales revenues from the different products produced. On the other hand, in point C, the percentage of this difference is about 400%. Finally, in point E, the difference between the harvesting cost and the sale of products represents about 40% of the harvesting cost. Another analysis can be done when each point is shown on the basis of the percentage eliminated of water hyacinth from each water body. Because the total percentage can be high, however, it can be low at a specific water body. Figure 11 shows the individual consumption of water hyacinth at each source. The main water body for the case study is the Lake of Chapala, so it is selected to consider the specific elimination of water hyacinth with different percentages. For example, point A represents an elimination of 30% of the water hyacinth in this lake, whereas in point C, almost 100% of the water hyacinth is eliminated from this water body. On the other hand, the second water body most important for this system is the Balsas river because it has a large amount of this plant; however, this river is located close to the west coast and far from other water bodies and cities; therefore, the elimination of water hyacinth from the
always greater than the TAC for the integrated process because in this case the plant is not used to obtain various products. On the other hand, when the water hyacinth is considered as raw material to obtain a set of products, it is possible to generate solutions attractive economically (which means that the harvesting cost is lower than the sales for the products manufactured). As shown in Figure 9 for alternative 1, the TAC increases when the eliminated water hyacinth increases. It leads to a decrease in the difference between the harvesting cost and the total annual cost, while the eliminated water hyacinth increases. The part of the Pareto curves for negative TAC represents attractive solutions (i.e., the net profit is positive because this is equal to −TAC). On the other hand, in Figure 10, the Pareto curves are opposites because the TAC begins at a value of zero and decreases while the harvesting cost increases. The maximum amount of eliminated water hyacinth is about 22%, and this point is represented with the letter C, for a tax credit of zero. Point C in Figure 10 is the same solution represented as point C in Figure 9. As observed, point C represents an inflection point in the curve for the TAC. The difference between Figure 9 and Figure 10 is that Figure 9 is based on alternative 1 to solve the problem (high elimination of water hyacinth), whereas Figure 10 represents the case when the elimination of water hyacinth is low. 299
dx.doi.org/10.1021/sc300137a | ACS Sustainable Chem. Eng. 2013, 1, 284−305
ACS Sustainable Chemistry & Engineering
Research Article
Figure 14. Pareto curves for the TAC versus the produced water (Alternative 2).
harvesting cost is always greater than the total annual cost, which means that for this case always there is a positive net profit (or that the TAC is negative). There is an inflection point between these two options, which is represented as point C in Figures 13 and 14. Notice in Figure 13 that the TAC decreases when the tax credit increases; this effect is more significant in this second option because in this case the Pareto curves have always positive net profits. Notice in Figure 13 (option 1) the Pareto curves for the point when the TAC of zero corresponds to an amount of produced water of zero. At this point, from the previous analysis, the following important questions appear: Where is the water hyacinth for the production of clean water coming from? Where should the clean water produced be distributed? This way, Figure 15 shows the distribution of the water bodies for the different points on the Pareto curves of Figures 13 and 14. Figure 15 also shows the distribution of the extracted clean water from the different water bodies to the water consumers. It is important to note that the produced water in a specific water body should be used by the closest water consumer because in these cases the water transportation cost is lower. Also, the number of selected water bodies increases when the amount of produced clean water is maximized.
Balsas river is selected only in point E. Notice in Figure 9 that this point represents a high consumption of water hyacinth, but it also has a greater TAC respect to the other solutions. In addition, in the addressed problem the water bodies corresponding to the lakes of Patzcuaro, Cuitzeo, and Yuriria are important because they are the closest ones to the main cities and are related to significant economic activities. Figure 12 shows the distribution for the satisfied demands of products at the different consumer places for the points indicated in Figures 9 and 10, which show that compost and energy are the main products because in all points their demands are fully satisfied. Ethanol does not appear in cities like Patzcuaro, Lazaro Cardenas, Queretaro, and Leon. Notice that the maximum demand satisfied for ethanol is at point E; also, High Fuel Caloric appears in this point. Furthermore, the MixAlco process is used in point C to produce acetic acid. On the other hand, an analysis was done to identify the impact of the produced clean water on the minimization of total annual cost including several tax credits and two alternatives for produced water. The first option is when a low production of water is required, and the second option is for a high production of clean water. The behavior is similar to the analysis corresponding to the harvested water hyacinth. The 300
dx.doi.org/10.1021/sc300137a | ACS Sustainable Chem. Eng. 2013, 1, 284−305
ACS Sustainable Chemistry & Engineering
Research Article
Figure 15. Distribution of water bodies and water consumers selected for the different points in the Pareto curves of Figures 13 and 14.
■
CONCLUSIONS This paper has presented a new formulation for the cleaning of water bodies of water hyacinth and the value-added processing through a distributed biorefinery system that produces several bioproducts (including biofuels and specialty chemicals) and clean water. The optimization model is formulated as a multiobjective optimization problem that simultaneously considers minimization of the total annual cost and maximization of the
amount eliminated of water hyacinth from the water bodies (or maximization for the production of clean water), while satisfying technical and environmental constraints. The results are shown through Pareto curves to represent the trade-offs between the contradicting objectives and to allow determining the solution that best satisfies the specific requirements. The proposed approach impacts on the sustainability of the system in three dimensions: economic, social, and environmental. 301
dx.doi.org/10.1021/sc300137a | ACS Sustainable Chem. Eng. 2013, 1, 284−305
ACS Sustainable Chemistry & Engineering
Research Article
Zwout s,n,c
The economic criterion consists of maximization of profit due to the processing of the eliminated water hyacinth. The environmental dimension is based on cleaning of water bodies infested with water hyacinth. The social dimension consists of providing benefits to the population such as appropriate conditions to allow several human activities on water bodies and the possibility to create several jobs in the harvesting sites. The application of the proposed methodology to a case study of one of the most important hydrologic regions in Mexico shows that it is useful to generate solutions to clean water bodies, obtain clean water, and produce several biofuels and specialty chemicals obtaining positive net profits. Therefore, the proposed methodology shows that distributed biorefinery systems can be an economical and sustainable option to eliminate the water hyacinth from water bodies. Finally, the proposed model is general and can be applied to any case of interest with the proper input data. In addition, the proposed model can be extended to consider other plants that can be considered as pollutants in water bodies.
■
max
Zwcon s,m,c Zwhs αhub j,p αcen j,p βcenop j βwtop s,n βhubop j
βHarvesting s βbcenTransp s
AUTHOR INFORMATION
Corresponding Author
βbhubTransp s,i
Notes
βcenprodTransp j,p,k
*E-mail:
[email protected]. Tel./Fax. +52 443 3273584. The authors declare no competing financial interest.
■
βhibprodTransp i,j,p,k
ACKNOWLEDGMENTS The authors acknowledge financial support from the Mexican Council of Science and Technology (CONACyT) and Council of Scientific Research of the Universidad Michoacana de San Nicolás de Hidalgo (CIC-UMSNH).
■
βwtTransp s,n βwtTransp s,n,m σ γn,c Variables
NOMENCLATURE
Parameters
aWT s,n,q ahub i,j,q acen j,q bWT s,n,q bhub i,j,q bcen j,q Bhub i,j min
max
hub f bhub i,j,q ,f bi,j,q
max f wtmin s,n,q,f wts,n,q
Fwhmax s max
Gcon p,k Hmax ws,m min cenmax wbcen j,q ,wbj,q Zws Zwins,c
Outlet composition of pollutant to water treatment technologies Maximum composition of pollutant in discharged water to markets Efficiency to extract biomass from water hyacinth in source s Efficiency factor in processing facility for technology j for conversion of dry biomass to produce p Efficiency factor in central processing facility for technology j for conversion of dry biomass to product p Unit operational cost associated to route j and central processing facility Unit operational cost associated to source i and water treatment units Unit operational cost associated to technology j in processing facility Unit harvesting costs for each location s Unit transportation cost of biomass from source s to central processing facility Unit transportation cost for biomass from source s to processing facility i Unit transportation cost for products from centralizer to markets Unit transportation cost for products from processing facilities to markets Untreated water unit cost Treated water unit cost Exponent to consider economies of scale Efficiency to eliminate pollutant c from extracted water from water hyacinth
Ahub i,j Fixed capital cost for processing facilities Acen j Fixed cost for capital cost of central processing facilities AWT s,n Fixed cost of capital cost of water treatment units Bf hub i,j Term used to linearize capital costs for processing facilities Bf cen j Term used to linearize capital costs for central processing facilities BfWT s,n Term used to linearize capital costs for water treatment units CostHubop i,j Operational cost for processing facilities CostHubcap i,j Capital cost for processing facilities Costcenop j Operational cost for the central processing facilities Costcencap Capital cost for the central processing facilities j CostWTop s,n Operational cost for the water treatment units CostWTcap s,n Capital cost for the water treatment units CostCapital Total capital cost CostHarvesting Water hyacinth harvesting cost CostOperational Total operational cost CostTransBM Biomass transportation cost
Unit fixed capital costs for water treatment units accounting for limits given Unit fixed capital costs for processing facilities accounting for limits given Unit fixed capital costs for central processing facilities accounting for limits given Unit variable capital costs for water treatment units accounting for limits given Unit variable capital costs for processing facilities accounting for limits given Unit variable capital costs for central processing facilities accounting for limits given Unit variable cost for distributed processing facilities j Maximum and minimum limits for the amount of processed biomass in processing facilities Maximum and minimum limits for amount of processed biomass in water treatment units Amount of water hyacinth available in place of source Maximum amount of product p to market k Maximum water demand in market m Maximum and minimum limits for amount of processed biomass in central processing facilities Efficiency to extract water from water hyacinth in source s Inlet composition of pollutant to water treatment technologies 302
dx.doi.org/10.1021/sc300137a | ACS Sustainable Chem. Eng. 2013, 1, 284−305
ACS Sustainable Chemistry & Engineering
Research Article
Total sales correspond to sales for products wbcen j Amount of distributed biomass to the technology j in the central processing facilites wprodhub i,j,p Amount of produced product p from biomass of the processing facility i by technology j wprodcen j,p Amount of produced product p from biomass of central processing facility by route j Zwcon s,m,c Composition of pollutant in discharged water to consumers
CostTransProd Products transportation cost CostTransWater Water transportation cost dAhub i,j,q Disaggregated variable used for fixed part of capital costs in processing facilities dAcen j,q Disaggregated variable used for fixed part of capital costs in central processing facilities dAwt s,n,q Disaggregated variable for fixed capital costs for water treatment units dBhub i,j,q Disaggregated variable used for variable part of capital costs in processing facilities dBcen j,q Disaggregated variable used for variable part of capital costs in centralizers dBfwt s,n,q Disaggregated variable for variable capital costs for water treatment units dBbhub i,j,q Disaggregated variable used for processed biomass df wts,n,q Disaggregated variable for biomass processed in water treatment units dwcen j,q Disaggregated variable used for processed biomass in the central processing facilities Fbs Amount of extracted biomass f bhub s,i Amount of dry extracted biomass in location s that is directed to processing facility located in place i f bcen s Amount of dry extracted biomass in location s that is directed to central facility f bhub i,j Amount of dry biomass in processing facility i that is processed with technology j f ws Amount of extracted water f whs Amount of water hyacinth used in place of source s f wts,n Amount of treated water by technology n gprodhub i,j,p,k Amount of product segregated and directed to the market k from processing facility i gprodcen j,p,k Amount of product segregated and directed to the market k from central facility Gcon p,k Product p inlet to the market k hws,n,m Amount of water from the place s treated by technology n sent to the water consumer m HWs,m Total water flow rate directed to the water consumer m NetProfit Total net profit for overall system SalesProd
Binary Variables
yhub i,j,q Binary variable used for the capital cost ycen Binary variable used for capital cost in central processing j,q facility ywt s,n,q Binary variable used in capital cost in water treatment units Yhub i,j,q Boolean variable used in capital costs Ycen Boolean variable in capital costs for central processing j,q facility YWT s,n,q Boolean variable in capital costs for water treatment units
■
REFERENCES
(1) Malik, A. Environmental challenge vis a vis opportunity: The case of water hyacinth. Environ. Int. 2007, 33 (1), 122−138. (2) Fernández, O. A.; Sutton, D. L.; Lallana, V. H.; Sabbatini, M. R.; Irigoyan, J. H. Aquatic Weed Problems and Management in South and Central America. In Aquatic Weeds: The Ecology and Management of Nuisance Aquatic Vegetation; Charudattan, R., Ed.; Oxford University Press: New York 1990; pp 406−4025. (3) Epstein, P. Weeds bring disease to the east African waterways. Lancet 1998, 351 (9102), 577. (4) Navarro, A. R.; Rubio, M. C.; Maldonado, M. C. A combined process to treat lemon industry wastewater and produce biogas. Clean Technol. Environ. Policy 2011, 14 (1), 41−45. (5) Chuang, Y. S.; Lay, C. H.; Sen, B.; Chen, C. C.; K, G.; Wu, J. H.; Lin, C. S.; Lin, C. Y. Biohydrogen and biomethane from water hyacinth (Eichhornia crassipes) fermentation: Effects of substrate concentration and incubation temperature. Int. J. Hydrogen Energy 2011, 36, 14195−14203. (6) Isarankura-Na-Ayudhya, C.; Tantimongcolwat, T.; Kongpanpee, T.; Prabkate, P.; Prachayasittikul, V. Apropiate technology for the bioconversion of water hyacinth (Eichhornia crassipes) to liquid ethanol: Future prospects for community strengthening and sustainable development. EXCLI J. 2007, 6, 167−176. (7) Nigam, J. N. Bioconversion of water-hyacinth (Eichhornia crassipes) hemicellulose acid hydrolysate to motor fuel ethanol by xylose-fermenting yeast. J. Biotechnol. 2002, 97, 107−116. (8) Mishima, D.; Kuniki, M.; Sei, K.; Soda, S.; Ike, M.; Fujita, M. Ethanol production from candidate energy crops: Water hyacinth (Eichhornia crassipes) and water lettuce (Pistia stratiotes L. Bioresour. Technol. 2008, 99 (7), 2495−2500. (9) Kumar, A.; Singh, L. K.; Ghosh, S. Bioconversion of lignocellulosic of water-hyacinth (Eishhornia crassipes) hemicelluloses acid hydrolysate to ethanol by Pichia stipitis. Bioresour. Technol. 2009, 100 (13), 3293−3297. (10) Sukumaran, R. K.; Singhania, R. R.; Mathew, G. M.; Pandey, A. Cellulase production using biomass feed stock and its application in lignocelluloses saccharification for bio-ethanol production. Renewable Energy 2009, 34 (2), 421−424. (11) Aswathy, U. S.; Sukumaran, R. K.; Devi, G. L.; Rajasree, K. P.; Singhania, R. R.; Pandey, A. Bio-ethanol from water hyacinth biomass: An evaluation of enzymatic saccharification strategy. Bioresour. Technol. 2010, 101 (3), 925−930. 303
dx.doi.org/10.1021/sc300137a | ACS Sustainable Chem. Eng. 2013, 1, 284−305
ACS Sustainable Chemistry & Engineering
Research Article
(12) Mukhopadhyay, S.; Chatterjeee, N. C. Bioconversion of water hyacinth hydrolysate into ethanol. Bioresources 2010, 5 (2), 1301− 1310. (13) Ma, F.; Yang, N.; Xu, C.; Wu, J.; Zhang, X. Combination of biological pretreatment with mild acid pretreatment for enzymatic hydrolysis and ethanol production from water hyacinth. Bioresour. Technol. 2010, 101 (24), 9600−9604. (14) Ahn, D. J.; Kim, S. K.; Yun, H. S. Optimization of pretreatment and saccharification for the production of bioethanol from water hyacinth by Saccharomyces cerevisiae. Bioprocess. Biosys. Eng. 2012, 35 (1−2), 35−41. (15) Guragain, Y. N.; Coninck, J. D.; Husson, F.; Durand, A.; Rakshit, S. K. Comparison of some new pretreatment methods for second generation bioethanol production from wheat straw and water hyacinth. Bioresour. Technol. 2011, 102 (6), 4416−4424. (16) Harun, M. Y.; Radiah, A. B. D.; Abidin, Z. Z.; Yunus, A. R. Effect of physical pretreatment on dilute acid hydrolysis of water hyacinth (Eicchornia crassipes). Bioresour. Technol. 2011, 102 (8), 5193−5199. (17) Bramsiepe, C.; Sievers, S.; Seifert, T.; Stefanidis, G. D.; Vlachos, D. G.; Schnitzer, H.; Muster, B.; Brunner, C.; Sanders, J. P. M.; Bruins, M. E.; Schembecker, G. Low-cost small processing technologies for production applications in various environments: Mass produced factories. Chem. Eng. Process. 2012, 51, 32−52. (18) Abdel-Fattah, A. F.; Abdel-Naby, M. A. Pretreatment and enzymatic saccharification of water hyacinth cellulose. Carbohydr. Polym. 2012, 87 (3), 2109−2113. (19) Ganguly, A.; Chatterjee, P. K.; Dey, A. Studies on ethanol production from water hyacinth: A review. Renewable Sustainable Energy Rev. 2012, 16, 966−972. (20) Forrest, A. K.; Hernandez, J.; Holtzapple, M. T. Effect of temperature and pretreatment conditions on mixed-acid fermentation of water hyacinth using a mixed culture of thermophilic microorganisms. Bioresour. Technol. 2010, 101 (19), 7510−7515. (21) Kim, S.; Holzapple, M. T. Lime pretreatment and enzymatic hydrolysis of corn stover. Bioresour. Technol. 2005, 96 (18), 1994− 2006. (22) Mosier, N.; Wyman, C.; Dale, B.; Elander, R.; Lee, Y. Y.; Holtzapple, M.; Ladisch, M. Bioresour. Technol. 2005, 96 (6), 673− 686. (23) Chanakya, H. N.; Borgaonkar, S.; Meena, G.; Jagadish, K. S. Solid-phase biogas production with garbage or water hyacinth. Bioresour. Technol. 1993, 46 (3), 227−231. (24) Gunnardsson, C. C.; Petersen, C. M. Water hyacinth as a resource in agriculture and energy production: A literature review. Waste Manage. 2007, 27 (1), 117−129. (25) Bhattacharya, A.; Kumar, P. Water hyacinth as a potential biofuel crop. Electron. J. Environ., Agric. Food Chem. 2010, 9 (1), 112− 122. (26) O’Sullivan, C.; Rounsefell, B.; Grinham, A.; Clarke, W.; Udy, J. Anaerobic digestion of harvested aquatic weeds: Water hyacinth (Eichhornia crassipes), cabomba (Cabomba caroliniana) and salvinia (Salvinia molesta). Ecol. Eng. 2010, 36, 1459−1468. (27) Singhal, V.; Rai, J. P. N. Biogas production from water hyacinth and channel grass used for phytoremediation of industrial effluents. Bioresour. Technol. 2003, 86, 221−225. (28) Cheng, J.; Xie, B.; Zhou, J.; Song, W.; Cen, K. Cogeneration of H2 and CH4 from water hyacinth by two-step anaerobic fermentation. Int. J. Hydrogen Energy 2010, 35 (7), 3029−3035. (29) Fedler, C. B.; Duan, R. Biomass production for bioenergy using recycled wastewater in a natural waste treatment system. Resour., Conserv. Recycl. 2011, 55 (8), 793−800. (30) You, F.; Wang, B. Life cycle optimization of biomass to liquid supply chains with distributed centralized processing networks. Ind. Eng. Chem. Res. 2011, 50 (17), 10102−10127. (31) Sammons, N.; Eden, M.; Yuan, W.; Cullinan, H.; Aksoy, B. A flexible framework for optimal biorefinery product allocation. Environ. Prog. 2007, 26 (4), 349−354.
(32) Van Dyken, S.; Bakken, B. H.; Skjelbred, H. I. Linear mixedinteger models for biomass supply chains with transport, storage and processing. Energy 2010, 35 (3), 1338−1350. (33) Iakovou, E.; Karagiannidis, A.; Vlachos, D.; Toka, A.; Malamakis, A. Waste biomass-to-energy supply chain management: A critical synthesis. Waste Manage. 2010, 30 (10), 1860−1870. (34) Cucek, L.; Lam, H. L.; Klemes, J. J.; Varbanov, P. S.; Kravenja, Z. Synthesis of regional networks for the supply of energy and bioproducts. Clean Technol. Environ. Policy 2010, 12 (6), 635−645. (35) Kostin, A. M.; Guillen-Gosalbez, G.; Mele, F. D.; Bagajewicz, M. J.; Jimenez, L. Design and planning of infrastructures for bioethanol and sugar production under demand uncertainty. Chem. Eng. Res. Des. 2012, 90 (3), 359−376. (36) Kim, J.; Realff, M. J.; Lee, J. H.; Whittaker, C.; Furtner, L. Design of biomass processing network for biofuel production using an MILP model. Biomass Bioenergy 2011, 35 (2), 853−871. (37) Papapostolou, C.; Kondili, E.; Kaldellis, J. K. Development and implementation of an optimization model for biofuels supply chain. Energy 2011, 36 (10), 6019−6026. (38) Parker, N.; Tittmann, P.; Hart, Q.; Nelson, R.; Skog, K.; Schmidt, A.; Gray, E.; Jenkins, B. Development of a biorefinery optimized biofuel supply curve for the western United States. Biomass Bioenergy 2010, 34 (11), 1597−1607. (39) Huang, Y.; Chen, C. W.; Fan, Y. Multistage optimization of the supply chains of biofuels. Transp. Res., Part E. 2010, 46 (6), 820−830. (40) Akgul, O.; Zamboni, A.; Bezzo, F.; Shah, N.; Papageorgiou, L. G. Optimization-based approaches for bioethanol supply chains. Ind. Eng. Chem. Res. 2011, 50 (9), 4927−4938. (41) Leao, R. R. C. C.; Hamacher, S.; Oliveira, F. Optimization of biodiesel supply chain based on small farmers: A case study in Brazil. Bioresour. Technol. 2011, 102 (19), 8958−8963. (42) Eksioglu, S. D.; Palak, G.; Mondala, A.; Greenwood, A. Supply chain designs and management for biocrude production via wastewater treatment. Environ. Prog. Sustainable Energy 2011, DOI: 10.1002/ ep.10605. (43) Dansereau, L. P.; El-Halwagi, M. M.; Stuart, P. Sustainable Supply Chain for the Forest Biorefinery. In Design for Energy and the Environment; Proceedings of the 7th International Conference on the Foundations of Computer-Aided Process Design (FOCAPD), ElHalwagi, M. M., Linninger, A. A., Eds.; CRC Press: Taylor & Francis, 2009; pp 551−558. (44) Cruz, J. B.; Tan, R. R.; Culaba, A. B.; Ballacillo, J. A. A dynamic input-output model for nascent bioenergy supply chains. Appl. Energy. 2009, 86 (1), 586−594. (45) Dal-Mas, M.; Giarola, S.; Zambini, A.; Bezzo, F. Strategic design and investment capacity planning of the ethanol supply chain under price uncertainty. Biomass Bioenergy 2011, 35 (5), 2059−2071. (46) Tan, R. R.; Ballacillo, J. A. B.; Aviso, K. B.; Culaba, A. B. A fuzzy multiple-objective approach to the optimization of bioenergy system footprints. Chem. Eng. Res. Des. 2009, 87 (9), 1162−1170. (47) Zamboni, A.; Bezzo, F.; Shah, N. Spatially explicit static model for the strategic design of future bioethanol production systems. 2. Multi-objective environmental optimization. Energy Fuels 2009, 23 (10), 5134−5143. (48) Zamboni, A.; Murphy, R. J.; Woods, J.; Bezzo, F.; Shah, N. Biofuels carbon footprints: Whole-systems optimization for GHG emissions reductions. Bioresour. Technol. 2011, 102 (16), 7457−7465. (49) Santibáñez-Aguilar, J. E.; González-Campos, J. B.; Ponce-Ortega, J. M.; Serna-González, M.; El-Halwagi, M. M. Optimal planning of a biomass conversion system considering economic and environmental aspects. Ind. Eng. Chem. Res. 2011, 50 (14), 8558−8570. (50) Aviso, K. B.; Tan, R. R.; Culaba, A. B.; Cruz, J. B. Fuzzy inputoutput model for optimizing eco-industrial supply chains under water footprint constraints. J. Cleaner Prod. 2011, 19 (2−3), 187−196. (51) Mele, F. D.; Kostin, A. M.; Guillen-Gosalbez, G.; Jimenez, L. Multiobjective model for more sustainable fuel supply chains. A case study of the sugar cane in Argentina. Ind. Eng. Chem. Res. 2011, 50 (9), 4939−4958. 304
dx.doi.org/10.1021/sc300137a | ACS Sustainable Chem. Eng. 2013, 1, 284−305
ACS Sustainable Chemistry & Engineering
Research Article
(52) You, F.; Tao, L.; Graziano, D. J.; Snyder, S. W. Optimal design of sustainable cellulosic biofuel supply chains: Multiobjective optimization couple with life cycle assessment and input-output analysis. AIChE J. 2011, 58 (4), 1157−1180. (53) Giarola, S.; Zamboni, A.; Bezzo, F. Spatially explicit multiobjective optimization for the design and planning of hybrid first and second generation biorefineries. Comput. Chem. Eng. 2011, 35 (9), 1782−1797. (54) Bowling, I. M.; Ponce-Ortega, J. M.; El-Halwagi, M. M. Facility location and supply chain optimization for a biorefinery. Ind. Eng. Chem. Res. 2011, 50 (10), 6276−6286. (55) Tittmann, P. W.; Parker, N. C.; Hart, Q. J.; Jenkins, B. M. A spatially explicit techno-economic model of bioenergy and biofuels production in California. J. Transp. Geogr. 2010, 18 (6), 715−728. (56) Bai, Y.; Hwang, T.; Kang, S.; Ouyang, Y. Biofuel refinery location and supply chain planning under traffic congestion. Transp. Res., Part B 2011, 45 (1), 162−175. (57) Leduc, S.; Starfelt, F.; Dotzauer, E.; Kindermann, G.; McCallumn, I.; Oberteiner, M.; Lundgren, J. Optimal location of lignocellulosic ethanol refineries with plygeneration in Sweden. Energy 2010, 35 (6), 2709−2716. (58) Gebreslassie, B. H.; Yao, Y.; You, F. Design under uncertainty of hydrocarbon biorefinery supply chains: Multiobjective stochastic programming models, descomposition algorithm, and a comparison between CVaR and downside risk. AIChE J. 2012, 58 (7), 2155−2179. (59) Giarola, S.; Shah, N.; Bezzo, F. A comprehensive approach to the design of ethanol supply chains including carbon trading effect. Bioresour. Technol. 2012, 107, 175−185. (60) Pham, V.; Holtzapple, M. T.; El-Halwagi, M. M. Technoeconomic analysis of biomass to fuel via the MixAlco process. J. Ind. Microbiol. Biotechnol. 2010, 37 (11), 1157−1168. (61) Lu, W.; Wang, C.; Yang, Z. The preparation of High caloric fuel (HCF) from water hyacinth by deoxy-liquefaction. Bioresour. Technol. 2009, 100 (24), 6451−6456. (62) Government of Jalisco Programa Especial 21 Administración y uso del agua. Primera Actualización, 2011 (63) Rodríguez-Trejo, E.; Ducoing-Chahó, E. Evaluation between the Factors and Activities in the Watershed of Patzcuaro, Michoacán. Universidad Autónoma Metropolitana: Unidad Iztapalapa, 2003. (64) López E., Bocco G. Cambio de uso de cobertura vegetal y uso del suelo en la cuenca de lago de Cuitzeo. Tesis Doctoral en Ciencias Biológicas. Facultad de Ciencias, UNAM, 2000. (65) Instituto Nacional de Ecologia.́ Watersheds in Mexico. http:// cuencas.ine.gob.mx/cuenca/ (accessed December 28, 2012). (66) Instituto Nacional de Ecologia.́ Watersheds in Mexico. Lerma Chapala. http://cuencas.ine.gob.mx/cuenca/12A02.html (accessed December 28, 2012). (67) Instituto Nacional de Ecologia.́ Watersheds in Mexico. Lago Atotonilco. http://cuencas.ine.gob.mx/cuenca/12D03.html (accessed December 28, 2012). (68) Instituto Nacional de Ecologia.́ Watersheds in Mexico. Lago Sayula. http://cuencas.ine.gob.mx/cuenca/12D02.html (accessed December 28, 2012). (69) Instituto Nacional de Ecologia.́ Watersheds in Mexico. Rio Balsas. http://cuencas.ine.gob.mx/cuenca/18A02.html (accessed December 28, 2012). (70) SENER. Energy Information System, 2012. http://sie.energia. gob.mx/sie/bdiController?action=login (accessed October 2012). (71) PEMEX. Memory of Work, 2010. http://www.pemex.com/ files/content/Version_completa_memoria_de_labores_2010.pdf (accessed December 28, 2012). (72) Upper and Lower Limits for Pollutants for Discharge of Residual Water in Water Bodies; NOM-001-ECOL-1996; Secretaria de Medio Ambiente, Recursos Naturales y Pesca. (73) CONAGUA. Overall Availability per Capita. Atlas digital del agua Méx ico, 2012. http://www.conagua.gob.mx/atlas/atlas. html?seccion=2&mapa=0# (accessed October 2012).
(74) Rengaraj, S.; Yeon, K. H.; Moon, S. H. Removal of chromium from water and wastewater by ion exchange resins. J. Hazard. Mater. 2001, B87, 273−287. (75) Vaca Mier, M.; Lopez Callejas, R.; Gehr, R.; Jimenez Cisneros, B. E.; Alvarez, P. J. J. Heavy metal removal with Mexican clinoptilolite: Multi-component ionic exchange. Water Res. 2001, 35 (2), 373−378. (76) Thomas, S.; Currie, A.; Ltd, B. Greenock, Scotland, Arbor, Ann. Heavy metal removal from electroplatng wastewater using HA 216. Pollut. Control 2006, 29−31.
305
dx.doi.org/10.1021/sc300137a | ACS Sustainable Chem. Eng. 2013, 1, 284−305