Synthetic Aperture Radar (SAR) satellite images have proven to be a ...
integrating ancillary data consisting of the incidence angle, descriptors of texture
and ...
SYNTHETIC APERTURE RADAR IMAGE PROCESSING USING THE SUPERVISED TEXTURAL-NEURAL NETWORK CLASSIFICATION ALGORITHM. Oscar Garcia-Pineda, Ian MacDonald, Beate Zimmer. Texas A&M University Corpus Christi ABSTRACT Synthetic Aperture Radar (SAR) satellite images have proven to be a successful tool for identifying oil slicks. Natural oil seeps can be detected as elongated, radar-dark slicks in SAR images. Use of SAR images for seep detection is enhanced by a Texture Classifying Neural Network Algorithm (TCNNA), which delineates areas where layers of floating oil suppress Bragg scattering. The effect is strongly influenced by wind strength and sea state. A multi orientation Leung-Malik filter bank [1] is used to identify slick shapes under projection of edges. By integrating ancillary data consisting of the incidence angle, descriptors of texture and environmental variables, considerable accuracy were added to the classification ability to discriminate false targets from oil slicks and lookalike pixels. The reliability of the TCNNA is measured after processing 71 images containing oil slicks. 1. INTRODUCTION
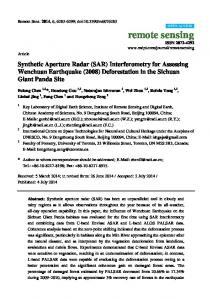
RADARSAT-1, ERS1, ERS2, ENVISAT, JERS, and the newest generation of SAR systems like RADARSAT-2 and Terra SAR-X. Part of the emitted radar energy (5.6 cm wavelength) directed at the ocean is reflected back to the satellite because of the roughness of the sea surface and is imaged as a gray speckle [7]. When sea is smoothed by viscoelastic properties of an oil slick or any other surfactant, the energy from the radar is reflected away from the sensor, reducing the radar backscatter and producing a dark area on the image. The SAR technology is independent of weather and sun illumination conditions. SAR images are acquired day and night and under cloud cover, which is an advantage over other remote sensing sensors. The ability to detect oil slicks in SAR images strongly depends on the wind speed at the sea surface. Much literature has referred a threshold of wind speeds in ranges between 2 to 10 m/s to be able to identify oil e.g. [6,8,9], but we have found that the ideal conditions to delineate oil slicks and characterize natural seepage in terms on flux rates reduces that threshold from 3.5 to 5.8 m/s (Figure1).
Locating and quantifying seeps on the Gulf of Mexico (GOM) is of interest of both the scientific community and oil and gas industry because seeps supply organic carbon to the benthos and water column, they can be indicative of the extent of mature oil sources on the slope, and seeps are associated with interesting diverse biological and geological features [2,3]. Oil seeps are streams of naturally occurring hydrocarbons that migrate from below the sediments; they can flow through the water column as oil drops, bubbles, and oily coated bubbles [4]. A significant part of the oil and gas at natural seeps is consumed at the seafloor [5]. However, a fraction of the oil and gas escape into the water column and rise to the sea surface. The oil that does reach the surface forms a thin layer of surfactant particles, often called ‘oil slicks’, that floats and generates a drift path strongly influenced by wind strength and sea state [6]. Oil slicks produce distinctive remote sensing signatures detectable by Synthetic Aperture Radar (SAR) Satellites like
Figure 1. Image collected by Radarsat, 23 May 2006, showing multiple slicks in a rotating gyre, Ideal wind conditions (4.2 m/s present during this snapshot) allows to clearly detecting oil slicks.
2. DATA INTEGRATION The first difficulty we face is that from a single raw SAR image, it is not possible to discriminate by backscatter the seep from other sources likely biogenic in origin. However, a time series provides sufficient evidence of the release points and general extent even when the seep orientation changes in relation to local winds and currents.
Through data sharing agreements with NASA and with support from the Alaska Satellite Facility, the Mineral Management Service and Texas A&M University we have acquired a collection of 574 Radarsat-1 images together with their corresponding Oceanographic and Meteorological data. All images are chosen to cover the GOM. With these data resources, we constructed an algorithm, which efficiently processes the data to determine the total number of individual seeps, their geographic location and association with geological features, and the temporal variability of discharge from individual seeps. Satellite and ancillary data are organized as follows: 2.1 Image Collection Radarsat-1 capabilities provides a multiple selection of images which differ in resolution, incidence angles, ascending or descending orbits among other time and spatial constraints. The 574 Radarsat-1 images were classified based in its beam modes and time frame. 2.2 Meteorological and Oceanographic Ancillary Data Based on the GOM Model Port, provided by Texas A&M University, each Radarsat-1 image is associated with a grid of the wind model output at the moment of the satellite snapshot, as well as with its corresponding wind history for up to 9 hours before the collection of each Radarsat image 2.3 Descriptors of Texture An important approach for describing the oil slick boundaries is to quantify its texture content, based on the gray speckle of the satellite image. This aspect of the analysis is crucial also because the brightness of the images varies based on the energy returned to the satellite antenna along the incidence angle. This method serves as a standardization of the aspect of the image. Texture controls are used in regions of 25 by 25 .
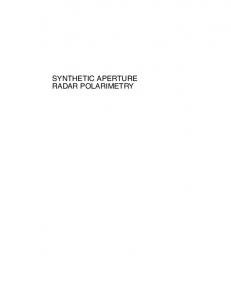
Figure 2.- The filters bank used are a Gaussian and a Laplacian both with 10 pixels size (these filters have rotational symmetry), an edge filter at 3 scales and a bar filter at the same 3 scales [1].
Each image is an 8bit file, with a resolution range from 25m to 100m. Each image is made up of a M x N rectangular array of pixels, and Z(ij) denotes the measurement at the (i,j) pixel. The LMFB are used for convolution with the image matrix, where each filter is multiplied by the scalar value of Z(ij) in order to get the reaction of this multiplication and then detects if the image contains an edge associated with a slick. The LMFB is convolved with a neighborhood of each pixel of the same size as the filter matrix. The LMFB matrix is overlain the image matrix and the matching terms are multiplied together and then all added up. Let A denote any matrix and B denote a matrix M x N, then their convolution C=A*B is defined as: M
N
C (n1, n2 ) = ∑∑ A(k1, k2 ) B (n1 − k1 ,n2 − k2 ) k 2 =1 k =1
Each pixel has a feature vector associated with it. We use a neural network to classify the feature vectors as “slick” or “no slick”. 3. ALGORITHM CONSTRUCTION This algorithm consists of a pixel-by-pixel feed-forward Neural Network (FFNN) classification method. To achieve this, it is necessary to relate each pixel in a SAR image with its corresponding ancillary data, resulting in 55- dimensional feature vector for each pixel.
2.4 The Leung-Malik Filter Bank (LMFB) 4. NETWORK ARCHITECTURE The LMFB is a multi-scale, multi-orientation filter bank with 36 edge and line detector filters [1]. It consists of first and second derivatives of Gaussians at 6 orientations and 3 scales as shown in Figure 2. The SAR gray speckle image will be analyzed by exposing it to these textural filters in order to recover slick shapes under the projection of filters in any perspective.
This FFNN has 55 inputs and computes one value ofer each pixel to identify each pixel as “slick” or “no slick”. We use a two-layer network. The log-sigmoid transfer function at the output layer was picked because its output range (0 to 1) is perfect for learning to output Boolean values. The hidden layer has 5 neurons. This number was chosen after analyzing and balancing computer computation time versus increasing accuracy. The FFNN is trained to classify pixels output as a 1 for slicks and 0 for non slicks. Representative images were
selected for the training set. Manual classification of these images was done using high resolution imaging tools. 5. Conclusion and Results The reliability of the Texture Classifying Neural Network Algorithm is measured after processing 71 images where slicks were present. By integrating ancillary data consisting of the incidence angle, descriptors of texture and environmental variables considerable accuracy was added to the algorithm’s ability to discriminate false targets from oil slicks and look-alike pixels. Figure 3.
targets. In contrast by providing the FFNN with all the ancillary data, classification accuracy increased to 96%. In parallel processing this algorithm was demonstrated to work efficiently on a standard commercial workstation. One of the advantages of this algorithm over some other commercial products is that the output is a logical Geotiff image (about 2Mb) containing polygons representing oil slicks areas keeping its geospatial registration for easy handling and spatial statistics in mapping software. 6. ACKNOWLEDGMENTS This research has been supported by the Mineral Management Service program as well as by a Grant from NASA. We want to acknowledge the generous support of TDI-Brooks, and Dr. Matt Howard from Texas A&M University for their invaluable collaborations in this research. 11. REFERENCES [1] Leung, T., and J. Malik (2001), Representing and recognizing the visual appearance of materials using three-dimensional textons, International Journal of Computer Vision, 43, 29-44. [2] MacDonald, I., et al. (2002), Transfer of hydrocarbons from natural seeps to the water column and atmosphere., Geofluids, Blackwell Science Ltd, 2, 95-107. [3] Roberts, H. (2006), Seafloor reflectivity—An important seismic property for interpreting fluid/gas expulsion geology and the presence of gas hydrate,, The leading Edge, 25, 620-628. [4] Roberts, H. (2001), Fluid and gas expulsion on the northern Gulf of Mexico continental slope: Mud-prone to mineral-prone responses, American Geophysical Union, 124, 145-161 [5] De Beukelaer, S. M., et al. (2003), Distinct side-scan sonar, RADARSAT SAR, and acoustic profiler signatures of gas and oil seeps on the Gulf of Mexico slope, Geo-Mar Lett, 23, 177-186. [6] Fortuny-Guasch, J. (2003), Improved Oil Slick Detection and Classification with Polarimetric SAR, Proceedings of the Workshop on POLinSAR - Applications of SAR Polarimetry and Polarimetric Interferometry (ESA SP-529). 14-16 January 2003, Frascati, Italy. Editor: H. Lacoste. Published on CDROM., p.27.1. [7] MacDonald, I., et al. (1996), Remote sensing inventory of active oil seeps and chemosynthetic communities in the Northern Gulf of Mexico., AAPG Memoir, 27-37.
Figure 3. Full image processed by TCNNA improving false target discrimination results by adding ancillary data into the FFNN. For those images were no ancillary data was available the algorithm accurately identified 90% of the oil slick pixel
[8] Pellon de Miranda, F., et al. (2004), Analysis of RADARSAT1 data for offshor monitoring activities in the Cantarell Complex, Gulf of Mexico, using the unsupervised semivariogram textural clasifier (UTSC), Canadian Journal of Remote Sensing, 30, 424436.
[9] Topouzelis, K., et al. (2004), Oil Spill Detection Using Rbf Neural Networks and SAR Data, INTERNATIONAL ARCHIVES OF PHOTOGRAMMETRY REMOTE SENSING AND SPATIAL INFORMATION SCIENCES, 35, 724-729.


![[PDF] Spotlight Synthetic Aperture Radar: Signal Processing ...](https://m.moam.info/img/260x300/pdf-spotlight-synthetic-aperture-radar-signal-proc_6478b342097c474d228d71ae.jpg)