Key words: celiac disease, classification, cross validation, over fitting,. LOPO. 1 Introduction. A desirable data setup for experimentation within the field of medical ...
Systematic Assessment of Performance Prediction Techniques in Medical Image Classification A Case Study on Celiac Disease Sebastian Hegenbart1 , Andreas Uhl1 , and Andreas V´ecsei2 1
Department of Computer Sciences, University of Salzburg 2 St. Anna Children’s Hospital, Vienna
Abstract. In the context of automated classification of medical images, many authors report a lack of available test data. Therefore techniques such as the leave-one-out cross validation or k-fold validation are used to assess how well methods will perform in practice. In case of methods based on feature subset selection, cross validation might provide bad estimations of how well the optimized technique generalizes on an independent data set. In this work, we assess how well cross validation techniques are suited to predict the outcome of a preferred setup of distinct test- and training data sets. This is accomplished by creating two distinct sets of images, used separately as training- and test-data. The experiments are conducted using a set of Local Binary Pattern based operators for feature extraction which are using histogram subset selection to improve the feature discrimination. Common problems such as the effects of over fitting data during cross validation as well as using biased image sets due to multiple images from a single patient are considered. Key words: celiac disease, classification, cross validation, over fitting, LOPO
1
Introduction
A desirable data setup for experimentation within the field of medical image classification consists of two distinct sets of image samples with a balanced number of images and patients among the specific classes. In this case one set is used for training a classifier as well as performing feature selection and parameter optimization. A method’s classification accuracy is then evaluated by using the trained classification method with it’s specific parameters on the other set of data samples. In the context of automated classification of medical images however, the available amount of test data is often very limited. Often it is not possible to build distinct data sets for training and evaluation. This can be due to a limited number of patients (e.g. a low prevalence of the specific disease), a limited number of usable images caused by qualitative problems or a high number of classes used to categorize the pathological changes in relation to the available images. In
2
Hegenbart, Uhl and V´ecsei
this case, the evaluation and development of methods, is usually based on cross validation techniques such as the leave-one-out cross validation or k-fold cross validation. By applying these techniques, a prediction of how well developed methods for classification and feature extraction will generalize on an independent data set, is made. Especially in the context of medical image classification, care has to be taken when using cross validation techniques. Depending on how the used sets of image data were created, the leave-one-out or k-fold cross validation techniques might not be sufficient to assess how well developed methods will perform in a realistic scenario. In this work we will study how well different approaches to cross validation perform in the context of classifying celiac disease. We construct two distinct sets for training and evaluation to validate how well different cross validation techniques predict this “optimal” case. By using feature subset selection in combination with Local Binary Pattern (LBP)-based feature extraction we are able to study the effects of over-fitting and discuss adapted techniques for their use in the context of medical image classification such as the leave-one-patient-out cross validation. In particular we will assess how accurate the predictions of the leave-one-patient-out, leave-one-out and k-fold cross validation techniques are compared to a preferred setup using two distinct image sets. We will also study two approaches towards feature subset selection and parameter optimization in combination with cross validation techniques (the so called inner- and outer-approaches). In Section 2 we identify common problems of constructing image sets for experimentation and explain how the image sets used during this work were constructed. In Section 3 the methods used for feature extraction and classification are presented. We also discuss the methods used for feature (histogram) subset selection. Section 4 deals with methods for cross validation and possible problems in the context of medical image classification. Also two approaches for feature subset selection and parameter optimization during cross validation are discussed. Section 5 presents the results of the conducted experiments. Finally the results are discussed in Section 6.
2
Image Set Construction
The creation of image data sets for experimentation requires the consideration of several possible problems: – An unbalanced number of samples per class can lead to a bias towards the class with the largest number of samples when using the overall classification rate as criterion for feature selection and parameter optimization. As a consequence the overall classification rate might not be a significant measure for the performance of developed methods. It is desirable to have a balanced number of samples among each class. – Images from a single patient usually have a higher similarity among each other as compared to images among different patients from a single class (or at least this might be conjectured). Depending on the classification method, this could have an impact on the classification outcome.
Prediction Performance of Cross Validation Techniques in Medical Imaging
3
Table 1. Distribution of Image Data Class0 Class1 Total Images Image-Set 1 155 157 312 Image-Set 2 151 149 300
Class0 Class1 Total Patients 66 21 87 65 19 84
– In some cases, the low number of original images from a specific class requires the extraction of multiple sub-images from a single parent image. Due to the common camera perspective and illumination these sub-images usually have the highest similarity among each other. This also might influence the classification method. 2.1
Image Data
We construct our image test sets based on images taken during duodenoscopies at the St. Anna Children’s Hospital using pediatric gastroscopes without magnification (GIF-Q165 and GIF-N180, Olympus, Hamburg). The main indications for endoscopy were the diagnostic evaluation of dyspeptic symptoms, positive celiac serology, anemia, malabsorption syndromes, inflammatory bowel disease, and gastrointestinal bleeding. Images were recorded by using the modified immersion technique, which is based on the instillation of water into the duodenal lumen for better visibility of the villi. The tip of the gastroscope is inserted into the water and images of interesting areas are taken. Gasbarrini et al. [2] showed that the visualization of villi with the immersion technique has a higher positive predictive value. Hegenbart et al. [3] state that the modified immersion technique is more suitable for automated classification purposes as compared to the classical image capturing technique. Images from a single patient were recorded during a single endoscopic session. To study the prediction accuracy of cross validation techniques we manually created an “idealistic” set of textured image patches with optimal quality. The texture patches have a fixed size of 128 × 128 pixels, a size which turned out to be optimal as reported by Hegenbart et al. [3]. In a fully automated system the process of frame identification as well as segmentation would be automated as well. These techniques are beyond the scope of this paper though. In order to generate the ground truth for the texture patches used in experimentation, the condition of the mucosal areas covered by the images was determined by histological examination of biopsies from the corresponding regions. Severity of villous atrophy was classified according to the modified Marsh classification in Oberhuber et al. [8]. This histological classification scheme identifies six classes of severity of celiac disease, ranging from class Marsh-0 (no visible change of villi structure) up to class Marsh-3C (absent villi). In this work a reduced scheme is considered using Marsh-0 (no celiac disease) and the joint set of the classes Marsh-3A, Marsh-3B and Marsh-3C (indicating celiac disease). We will refer to the non-celiac images as Class0 and to the celiac images as Class1 from here on. Figure 1 shows an example of the four interesting Marsh classes.
4
Hegenbart, Uhl and V´ecsei
(a) Marsh-0
(b) Marsh-3A
(c) Marsh-3B
(d) Marsh-3C
Fig. 1. Examples of Duodenal Image-Patches used for Experimentation.
2.2
Construction of Distinct Data Sets
The constructed image sets originate from 171 patients (131 control patients and 40 patients with diagnosed celiac disease). In order to guarantee an image set of reasonable size, more than a single texture patch was extracted for each patient from the original images. In total 753 texture patches met the required qualitative properties. Based on this set of texture patches two distinct sets for training and evaluation were created. The construction was done in an automated way such that the number of images is balanced between the non-celiac class Marsh-0 and the celiac classes Marsh-3A to Marsh-3C. While creating the two distinct sets, care was taken that the number of patches per patient is as evenly balanced as possible. Also, no images from a single patient are within both image sets. The actual construction was done using a pseudo random number generator based on a Gaussian distribution to avoid any bias within the data sets. Table 1 shows the distribution of images and patients per class.
3
Feature Extraction and Classification
The basic LBP operator was introduced to the community by Ojala et al. [9]. We use three operators that are based on LBP to conduct our experiments. The operators are LBP (Local Binary Patterns, [11]), ELBP (extended Local Binary Patterns, [4]), and a modified version of the ELBP operator that is introduced in this work, the ELTP (extended Local Ternary Patterns) operator. The entire family of operators is used to model a pixel neighborhood in terms of pixel intensity differences. The operators assign a binary label to each possible pixel neighborhood. The distributions of these labels are then used as features, which are represented by histograms. We compute the pattern distributions for each color channel (RGB), each LBP-Scale (1-3) (see Section 3.1) as well as filter orientation (in case of the extended LBP based operators: horizontal, vertical and diagonal). In total we result in 9-histograms for LBP and 27-histograms for ELBP and ELTP. For each histogram, only a subset of dominant patterns known as the uniform patterns [7], which make up the majority of discriminative patterns, is used. In case of the LBP and ELBP operator this subset consists of 58-patterns for 8 considered neighbors. In case of the ELTP operator two histograms with 58-bins are concatenated, therefore the dimensionality of the ELTP histograms is 116 bins.
Prediction Performance of Cross Validation Techniques in Medical Imaging
3.1
5
Local Binary Patterns
For the radius r and the number of considered neighbors p, the LBP operator is defined as LBPr,p (x, y) =
p−1 X
2k s(Ik − Ic ),
(1)
k=0
with Ik being the value of neighbor number k and Ic being the value of the corresponding center pixel. The s function acts as sign function, mapping to 1 if the difference is smaller or equal to 0 and mapping to 0 else. The basic operator uses an eight-neighborhood with a 1-pixel radius. To overcome this limitation, the notion of scale is used as discussed by Ojala et al. in [10] by applying averaging filters to the image data before the operators are applied. Thus, information about neighboring pixels is implicitly encoded by the operator. The appropriate filter sizes for a certain scale is calculated as described in [6]. 3.2
Extended Local Binary Patterns and Extended Local Ternary Patterns with adaptive Threshold
Information extracted by the LBP-based operators from the intensity function of a digital image can only reflect first derivative information. This might not be optimal, therefore Huang et al. [4] suggest using a gradient filtering before feature extraction and call this operator ELBP or extended LBP. By doing this the velocity of local variation is described by the pixel neighborhoods. We introduce the extended LTP (ELTP) operator consequently in perfect analogy to the ELBP operator. ELTP is based on the LTP operator instead of the LBP operator to suppress unwanted noise in the gradient filtered data. The Local Ternary Pattern operator (LTP) was introduced by Tan and Triggs [11]. The modification is based on a thresholding mechanism which implicitly improves the robustness against noise. In our scenario endoscopic images are used which usually are noisy as a result of the endoscopic procedure. The LTP operator is used to ensure that pixel regions that are influenced by these kind of distortions do not contribute to the computed histograms. The LTP is based on a thresholded sign function: if x ≥ Th 1, (2) s(x) = 0, if |x| < Th −1, if x ≤ −Th . The ternary decision leads to two separate histograms, one representing the distribution of the patterns resulting in a −1, the other representing the distribution of the patterns resulting in a 1. HI,lower (i) =
X x,y
(LBPr,p (x, y) = −i)
i = 0, · · · , 2p − 1
(3)
6
Hegenbart, Uhl and V´ecsei
HI,upper (i) =
X
(LBPr,p (x, y) = i)
i = 0, · · · , 2p − 1
(4)
x,y
The two computed histograms are concatenated and then treated like a single histogram. Please note that in analogy to the LBP operator, only the uniform subset of patterns was used in this case. The actual optimal values to use for thresholding are unknown a priori. We apply an adaptive threshold based on the spatial image statistics to make sure that noisy regions do not contribute to the computed histograms while information present within high quality regions are not lost due to a threshold that was chosen too high. The calculation is based on an expected value for the standard deviation of the image (β). This value was found based on the training data used during experimentation and represents the average standard deviation of pixel intensity values within all images. The value α is used as a weighting factor combined with the actual pixel standard deviation of the considered image (σ) and is used to adapt the threshold to match the considered image characteristics. ( 1 β 2 + ασ, Th = 1 β 2 − ασ, 3.3
if σ > β if σ ≤ β.
(5)
Histogram Subset Selection
Depending on the specific operator, at least 9 (LBP) and at maximum 27 (ELBP and ELTP) histograms are computed for a single image. A single LBP histogram can be interpreted as a “macro” feature. Therefore the terms histogram subset selection and feature subset selection share the same meaning. Feature subset selection techniques are usually applied for two reasons. Result Optimization Probably not all parameters combinations are equally well suited for describing the specific textural properties. Even more, when computing a large number of histograms, this set could contain a few “bad” histograms which reduce the discriminative power. Reduction of Dimensionality Depending on the chosen classification method large feature vectors might be suboptimal in terms of computational complexity and classification performance. Feature subset selection can be used to reduce the number of considered histograms and therefore the final feature vector dimensionality. The applied algorithm for histogram subset selection was the Sequential Forward Selection algorithm (SFS, [5]). The optimization criterion for this algorithm was the overall classification rate. The upper bound set on the number of selected histograms was 10. This technique of optimizing the feature subset might be subject to over fitting. We expect the operators computing a larger number of histograms (ELBP and ELTP) to be at higher risk of being over fitted when using “outer” optimization (see section 4.2 for a comparison of approaches for optimization).
Prediction Performance of Cross Validation Techniques in Medical Imaging
3.4
7
Classification
The k-nearest neighbors (kNN) classifier was used for classification. A rather weak classifier was chosen to give more emphasis on the selected histogram combinations. After the histogram subset selection the candidate histograms were combined and treated as a single histogram. To compute the distance (or similarity) of two different histograms we apply the histogram intersection metric. For two histograms (H1 , H2 ) with N bins and bin number i being referenced to as H(i), the similarity measure is defined as H(H1 , H2 ) =
N X
min(H1 (i), H2 (i)).
(6)
i=1
The k-value is subject to parameter optimization and was optimized in the corresponding cross validations based on the specific training set. By using the kNN classifier we are also able to study problems caused by multiple images from the same patient or parent frame within the training and test set.
4
Cross Validation Protocols
Cross validation is used to estimate the accuracy of the general prediction of the classification method. In 85 articles known to the authors of this work on automated diagnosis in the field of medical image classification, more than half resort to either leave-one-out (LOOCV) cross validation or k-fold cross validation. K-fold cross validation is a generalization of the leave-one-out cross validation technique. The k-fold cross validation partitions the original set of samples into k disjoint subsets. The classification uses k − 1 subsets as training input and classifies samples from the left out subset. This process is repeated k times. The leave-one-out cross validation can be seen as a k-fold cross validation with k corresponding to the number of data samples. Therefore each subset consists of only a single sample. Other approaches of cross validation such as random sub-sampling are special variations of the k-fold cross validation and were not considered in this work. When using k-fold cross validation, a balanced number of samples from each class should be available within the k − 1 subsets used for training. Theoretically all samples from a single class could be within one subset, leading to a bad estimation of the classification rate of this class. On the other hand using a high number of folds leads to small image subsets and usually brings up the problem that images from a single patient, or even worse from a single parent image, are within both the training and test data sets. 4.1
Leave-One-Patient-Out Cross Validation
The similarity of images from a single patient can be higher than the similarity between different patients from a class. A straight forward and clean solution is to use only a single image of each patient. Unfortunately in practice this is rarely possible due to a limited number of available data. An approach to take care
8
Hegenbart, Uhl and V´ecsei
of this problem is the leave-one-patient-out (LOPO) cross validation technique (also used by Andr´e et al. [1]). LOPO cross validation is based on the k-fold cross validation. The partitioning of the original set of samples however is done such that each partition contains only images from a single patient. This approach implies that patient information in some, usually unambiguously anonymized, form is available. A variation that is closely related to the LOPO cross validation method is the leave-one-parent-frame out cross validation. In this technique the partitioning is performed such that each partition consists of all sub-images from a parent image. This approach can usually be used if no patient information is available. However, the LOPO cross validation technique should be preferred over the leave-one-parent-image-out technique whenever possible. 4.2
Feature Optimization Combined with Cross Validation
We distinguish between two approaches to feature subset selection and parameter optimization in combination with cross validation. – The outer-approach optimizes features or parameters based on the results of the cross validation used for predicting the classifier’s accuracy. This means that the optimization criterion of the feature subset selection method is based on the estimates of a cross validation on the entire data set. These estimations are also used as classification rates later. – The inner-approach optimizes features or parameters within a separate cross validation based on the k − 1 partitions used for training within the cross validation used for predicting classification accuracy. This means that the optimization criterion of the feature subset selection method is based on a separate cross validation using the training set (k − 1 partitions) of the current “outer” cross validation. Therefore, for each partition an new feature subset is selected. The classification rate is the estimation of the “outer” cross validation. The outer-approach is the classical and easier approach frequently found within the literature. This approach however poses the problem that test data is used for optimizing feature subsets or parameters. This can have an influence on the optimization and therefore an effect on the prediction of how well the feature subset or optimized parameters generalize (the optimization over-fits the model towards the data). By using the inner-approach, the risk of over-fitting is reduced, the major drawback is that the computational power needed for this evaluation is considerably higher as compared to the other technique. This is caused by repeated feature subset selection and parameter optimization which is usually the most time consuming element in the automated classification chain.
5
Results
This Section presents the results of the experiments. Please note, that we use subscripts combined with the method names to indicate the type of optimization.
Prediction Performance of Cross Validation Techniques in Medical Imaging
9
The inner-approach is indicated by a “I”, while the outer-approach is indicated by a “O”. All results except the distinct set classification was computed using the specific cross validation technique on Image-Set1. The abbreviations “Spec.“ and “Sens.“ refer to the Methods’ specificity and sensitivity.
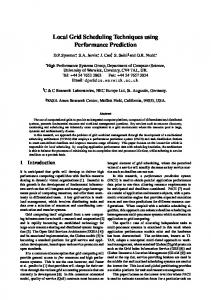
Fig. 2. Overall Classification Rate Estimates of k-FoldO (outer) Cross Validations.
Figures 2 and 3 show the overall classification rates predicted by using k-fold cross validation. Due to computational issues, the values were computed from 2 to 10 in single steps and from 12 to 112 in steps of 5. The mean classification rates are: LBP (93.75%, σ = 0.43), ELBP (93.48%, σ = 0.5) as well as ELTP (93.48%, σ = 0.64) in case of the outer-approach
Fig. 3. Overall Classification Rate Estimates of k-FoldI (inner) Cross Validations.
and LBP (90.98%, σ = 1.08), ELBP (90.48%, σ = 0.91) as well as ELTP (89.99%, σ = 1.07) in case of the inner-approach. The columns of Table 2 labeled as ∆ list the differences of the predictions of the overall classification rates between the outer- and inner-approach. The experiments based on the innerapproach used a leave-one-out cross validation as the “inner” cross validation method in all cases.
10
Hegenbart, Uhl and V´ecsei Table 2. Cross Validation Estimates using LOOCV and LOPO.
LBP ELBP ELTP
LOOCVO (outer) Spec. Sens. Overall 93.63 94.19 93.91 94.27 93.55 93.91 94.27 93.55 93.91
LOOCVI (inner) ∆ Spec. Sens. Overall 90.38 90.32 90.35 3.56 91.67 89.68 90.68 3.32 90.32 91.03 90.68 3.32
LBP ELBP ELTP
LOPOO (outer) Spec. Sens. Overall 85.99 95.48 90.71 91.08 94.19 92.63 89.81 94.19 91.99
LOPOI (inner) ∆ Spec. Sens. Overall 82.17 90.32 86.22 4.49 81.53 90.97 86.22 6.41 79.62 89.68 84.62 7.37
Table 3 compares the results achieved by using the “optimal” distinct set validation (Image-Set1 is used for training, Image-Set2 for evaluation) with the estimates provided by using the mentioned cross validation techniques. The columns labeled as ∆ show the differences of the specific methods’ overall classification rates to the overall classification of the distinct set validation. The results with the closest proximity to the distinct set results are displayed in bold. The columns labeled as mean and max show the differences to the mean overall classification rates of the k-fold cross validation as well as the differences to the maximum classification rates of the k-fold cross validations (which is also the maximum difference to all classification outcomes of the k-fold cross validation). Table 3. Results of the Distinct Set Classification using Image-Set1 as Training-Data.
5.1
LBP ELBP ELTP
Spec. 79.47 80.13 79.47
Distinct Sets Sens. Overall 87.25 83.33 92.62 86.33 92.62 86.00
∆
∆
∆
LBP ELBP ELTP
Spec. 79.47 80.13 79.47
Distinct Sets ∆ Mean ∆ Max ∆ Mean Sens. Overall k-FoldO k-FoldO k-FoldI 87.25 83.33 10.42 11.22 7.76 92.62 86.33 7.39 8.22 4.15 92.62 86.00 7.48 8.55 3.99
∆
LOPOO LOPOI LOOCVO LOOCVI
7.38 6.30 5.99
2.89 -0.11 1.38
10.58 7.58 7.91
7.02 4.35 4.68 ∆
Max
k-FoldI
9.62 6.30 5.67
Performance
Beside to the actual prediction accuracy of each method, the computational complexity plays an important role of how well the method is suited for application in experimentation. A major part of the computational efforts lies within the
Prediction Performance of Cross Validation Techniques in Medical Imaging
11
feature subset selection. The upper bound defined on the number of histograms used to build the feature vector in this work is 10. The feature subset selection method exits if no better configuration (in terms of overall classification rate) of histograms can be found. The maximum number of performed cross validations is n(n+1) − (n−10)(n−9) for n available histograms. The actual number of compu2 2 tations is highly dependent on the data. To be able to compare the performance among the techniques, we limit the upper bound on the histogram count to 1 for the experiments used for the performance assessment. Table 4 shows the time in seconds needed for a full cross validation of Image-Set1. Table 4. Time in Seconds for a Full Validation. Method Seconds LOOCV (Outer) 2.8 LOPO (Outer) 8.4 Distinct 2.9
6
Method Seconds LOOCV (Inner) 648.7 LOPO (Inner) 624.5
Discussion
The results show that there is a significant difference between the estimated rates of the cross validation methods and the distinct set evaluation. The rates of the outer-optimization indicate some degree of over-fitting during optimization. In case of the LOOCV method, the results show that the classification rates using outer-optimization are approximately 3.5 percentage points above the inner optimization. In case of the LOPO and the k-fold methods this effect can also be observed. For the LOPO method, the differences between inner- and outer-optimizations are even higher as compared to k-fold and LOOCV. We assume that this is due to a combined effect of over-fitting and image set bias of the LOOCV and k-fold methods. The mean estimates of the k-fold cross validations are comparable to the LOOCV cross validation. The prediction accuracy of methods using the outer-optimizations is further off the rates achieved by the distinct set evaluation as compared to the inner-optimization. Table 4 shows, that the higher accuracy of the inner-optimization, comes at the cost of a considerably higher computational effort. The differences in computational complexity among the cross-validation methods is significantly smaller. Considering the results we see that the inner-approach is the best suited technique (if its complexity can be handled) for evaluating methods using features optimization. Compared to the distinct set evaluation, the LOOCV method is off by a an average of 8.7 percentage points (outer) as well as 5.35 (inner). The prediction of the LOPO method seems to be more accurate with an average difference of 6.5 percentage points (outer) as well as excellent 1.39 percentage points (inner). Considering the results of the k-fold cross validations a significant variance of
12
Hegenbart, Uhl and V´ecsei
the rates at low number of folds is observed. In general the standard deviation is below one percentage point for both approaches. If k-fold validation is applied we suggest using a fixed number of folds for all experiments to avoid an additional effect of over-fitting. To avoid biased image sets caused by multiple images from a patient the LOPO method should be preferred whenever possible. In general the LOPO method combined with inner-optimization seems to be the most adequate approach if no distinct sets for training and evaluation can be constructed.
References 1. Andr´e, B., Vercauteren, T., Wallace, M.B., Buchner, A.M., Ayache, N.: Endomicroscopic video retrieval using mosaicing and visual words. In: Proceedings of the 7th IEEE International Symposium on Biomedical Imaging. IEEE (2010), to appear 2. Gasbarrini, A., Ojetti, V., Cuoco, L., Cammarota, G., Migneco, A., Armuzzi, A., Pola, P., Gasbarrini, G.: Lack of endoscopic visualization of intestinal villi with the immersion technique in overt atrophic celiac disease. Gastrointestinal endoscopy 57, 348–351 (2003) 3. Hegenbart, S., Kwitt, R., Liedlgruber, M., Uhl, A., V´ecsei, A.: Impact of duodenal image capturing techniques and duodenal regions on the performance of automated diagnosis of celiac disease. In: Proceedings of the 6th International Symposium on Image and Signal Processing and Analysis. pp. 718–723. Salzburg, Austria (2009) 4. Huang, X., Li, S., Wang, Y.: Shape localization based on statistical method using extended local binary pattern. In: Proceedings of the 3rd International Conference on Image and Graphics. pp. 1–4. Hong Kong, China (2004) 5. Jain, A., Zongker, D.: Feature selection: Evaluation, application, and small sample performance. IEEE Transactions on Pattern Analysis and Machine Intelligence 19, 153–158 (1997) 6. M¨ aenp¨ a¨ a, T.: The Local Binary Pattern Approach to Texture Analysis - Extensions and Applications. Ph.D. thesis, University of Oulu (2003) 7. M¨ aenp¨ a¨ a, T., Ojala, T., Pietik¨ ainen, M., Soriano, M.: Robust texture classification by subsets of local binary patterns. In: Proceedings of the 15th International Conference on Pattern Recognition. vol. 3, p. 3947. IEEE Computer Society, Los Alamitos, CA, USA (2000) 8. Oberhuber, G., Granditsch, G., Vogelsang, H.: The histopathology of coeliac disease: time for a standardized report scheme for pathologists. European Journal of Gastroenterology and Hepatology 11, 1185–1194 (1999) 9. Ojala, T., Pietik¨ ainen, M., Harwood, D.: A comparative study of texture measures with classification based on feature distributions. Pattern Recognition 29(1), 51–59 (1996) 10. Ojala, T., Pietik¨ ainen, M., M¨ aenp¨ a¨ a, T.: Multiresolution Gray-Scale and rotation invariant texture classification with local binary patterns. IEEE Transactions on Pattern Analysis and Machine Intelligence 24(7), 971–987 (2002) 11. Tan, X., Triggs, B.: Enhanced local texture feature sets for face recognition under difficult lighting conditions. In: AMFG. LNCS, vol. 4778, pp. 168–182. Springer (2007)