www.nature.com/scientificreports
OPEN
Received: 3 November 2017 Accepted: 10 April 2018 Published: xx xx xxxx
Systematic evaluation of RNA quality, microarray data reliability and pathway analysis in fresh, fresh frozen and formalin-fixed paraffinembedded tissue samples Isabella Wimmer 1, Anna R. Tröscher1, Florian Brunner1, Stephen J. Rubino2, Christian G. Bien3, Howard L. Weiner2, Hans Lassmann1 & Jan Bauer1 Formalin-fixed paraffin-embedded (FFPE) tissues are valuable resources commonly used in pathology. However, formalin fixation modifies nucleic acids challenging the isolation of high-quality RNA for genetic profiling. Here, we assessed feasibility and reliability of microarray studies analysing transcriptome data from fresh, fresh-frozen (FF) and FFPE tissues. We show that reproducible microarray data can be generated from only 2 ng FFPE-derived RNA. For RNA quality assessment, fragment size distribution (DV200) and qPCR proved most suitable. During RNA isolation, extending tissue lysis time to 10 hours reduced high-molecular-weight species, while additional incubation at 70 °C markedly increased RNA yields. Since FF- and FFPE-derived microarrays constitute different data entities, we used indirect measures to investigate gene signal variation and relative gene expression. Whole-genome analyses revealed high concordance rates, while reviewing on single-genes basis showed higher data variation in FFPE than FF arrays. Using an experimental model, gene set enrichment analysis (GSEA) of FFPE-derived microarrays and fresh tissue-derived RNA-Seq datasets yielded similarly affected pathways confirming the applicability of FFPE tissue in global gene expression analysis. Our study provides a workflow comprising RNA isolation, quality assessment and microarray profiling using minimal RNA input, thus enabling hypothesis-generating pathway analyses from limited amounts of precious, pathologically significant FFPE tissues. Pathological archives contain vast amounts of formalin-fixed paraffin-embedded (FFPE) specimen from routinely collected biopsies and autopsy tissue as well as precious material derived from rare disease cases or such with exceptional pathogenesis1,2. Contrary to experimental animal studies, which are often feasible with fresh frozen (FF) material, research relying on human tissues is predominantly dependent on FFPE material. FFPE tissue blocks are long-lasting and easy to archive. Formaldehyde fixation (using formalin or paraformaldehyde) excellently preserves cellular structures and tissue morphologies by introducing inter- and intramolecular cross-links between side chains of amino acids3,4, thereby maintaining secondary and tertiary structures of proteins5,6. However, the fixatives chemically modify nucleic acids as well7,8. The addition of methylol groups to bases leads to the formation of methylene bridges between amino groups similarly as for proteins. Furthermore, hydrolysis of N-glycosylic bonds creates abasic sites, while hydrolysis of phosphodiester bonds introduces breaking points in the sugar-phosphate backbone resulting in nucleic acid fragmentation. Moreover, proteins and nucleic acids are cross-linked to each other upon fixation9. In addition to fixation methods8,10, studies have identified tissue fixation time, specimen size, and tissue storage conditions as important factors influencing RNA quality11,12. Moreover, the choice of tissue lysis and isolation kits influences yield and quality of isolated RNA fragments13–16. However, available information on tissue 1
Department of Neuroimmunology, Center for Brain Research, Medical University of Vienna, Vienna, Austria. 2Ann Romney Center for Neurological Diseases, Brigham and Women’s Hospital, Harvard Medical School, Boston, USA. 3 Epilepsy Center Bethel, Krankenhaus Mara, Bielefeld, Germany. Correspondence and requests for materials should be addressed to I.W. (email:
[email protected]) SCIENtIfIC ReporTS | (2018) 8:6351 | DOI:10.1038/s41598-018-24781-6
1
www.nature.com/scientificreports/ processing of archival material is often incomplete. Thus, it is essential to integrate appropriate control steps to monitor RNA quality and functionality. Microarray technology and bioinformatics tools have advanced tremendously in recent years and their use has been extended to a broad spectrum of biologically relevant research questions. Together with advanced transcription kits specifically designed for low input derived from microdissected tissue, this opens up greater opportunities for basic and clinically-related research. In the present study, we assessed the usability of low quantities of FFPE tissue-derived RNA for microarray studies in comparison with FF tissue- and fresh tissue-derived samples using brain tissue derived from humans, rats and mice. Based on the results, we are able to provide an experimental workflow of RNA isolation, quality determination and microarray preparation that can be applied to as little as 2 ng total RNA input. Our findings pave the way for unlocking the transcriptome of countless FFPE material, which can be found in archives and tissue banks and is of great interest especially for human molecular pathology.
Results
To test for the effect of formalin fixation on microarray data reliability and reproducibility, we performed a side-by-side analysis of paired fresh frozen (FF) and formalin-fixed paraffin-embedded (FFPE) material derived from striatal and hippocampal tissue from rats (r_FF, r_FFPE) and humans (h_FF, h_FFPE_3 h and h_FFPE_10 h), respectively (Fig. 1).
Size distribution of RNA fragments combined with qPCR is suitable for quality assessment of FFPE-derived RNA. Total RNA from FF- and FFPE-derived samples was loaded on Agilent RNA Pico Chips
to determine RNA quantity and integrity. Rat and human FF samples showed clearly distinguishable 18 S and 28 S rRNA peaks (Fig. 2a,c) and RNA integrity numbers (RINs) were calculated to an average of 6.1 and 7.2, respectively (Fig. 2g,h). For FFPE samples, rRNA peaks were not identifiable (Fig. 2b,d–f) and RINs were reduced to a level considered as indicator for degraded RNA (Fig. 2g,h). Thus, as alternative quality measures for FFPE-derived RNA, we evaluated Bioanalyzer electropherograms and calculated DV200 values (percentage of RNA fragments with a length >200 nucleotides), reliable quality determinants for FFPE-derived RNA17. RNA electropherograms represent the size distribution of RNA fragments. Thus, for FFPE-derived samples, a long plateau is favourable, indicating a high number of long RNA fragments. However, after 3 hours of lysis of human tissue, a well delimited peak with an average size of 3,000–4,000 nucleotides was present (arrows in Fig. 2d,e) suggestive of remaining cross-linked nucleic acids18,19. When we increased the tissue lysis time to 10 hours, the high-molecular-weight species were decreased, putatively indicating more efficient retrieval of cross-linked RNA (absence of peak; Fig. 2f), without significantly affecting DV200 values (Fig. 2h). To increase RNA yields of human FFPE-derived samples, we included an incubation step at 70 °C (Fig. 1) resulting in almost 2.5-times higher average amounts of RNA for similar tissue inputs (h_FFPE_3 h w/o 70 °C: 37 ng; h_FFPE_3 h: 83 ng). DV200 values were not significantly affected by this advancement (Fig. 2h). Generally, all our FF and FFPE samples fell into the high-quality category (DV200 > 70%) according to the Illumina scale17. Moreover, they passed functional integrity testing by yielding sufficient amounts of PCR products for selected reference genes (Fig. 3). To keep this transcript analysis as uniform and unbiased as possible, we used a mix of oligo(dT) and random hexamer primers for reverse transcription and primer sets annealing near the 5′- and 3′-end of the mRNA for qPCR (Table 1). Although the same amounts of input were used for reverse transcription, FF samples resulted in smaller Cq values than FFPE samples for the tested reference genes (rat: Gapdh, Pgk1 and Actb; human: GAPDH, G6PD and SDHA) indicating more PCR products (Fig. 3c,d). Representative amplification plots illustrate the clear separation of FF from FFPE samples (Fig. 3a,b). Although Bioanalyzer profiles differed between h_FFPE_3 h and h_FFPE_10 h, no significant differences in the functional quality of the isolated RNA were observed (Fig. 3d). Also the additional incubation at 70 °C step did not influence any RNA quality-related parameters (Fig. 3e). Altogether, the combination of visual inspection of the shape of Bioanalyzer electropherograms, calculation of the DV200 and functional testing via qPCR proved as ideal for judging the suitability of FFPE-derived RNA for downstream applications.
Whole-genome microarrays can be reliably performed with low inputs of FF- or FFPE-derived RNA. For both FF and FFPE samples, the input for each Affymetrix GeneChipTM was only 2 ng of total RNA.
We aggregated and normalized the raw data from FF and FFPE microarrays of each species to gene level using RMA-Sketch algorithms. Histograms of normalized gene signals illustrate FF and FFPE arrays as separate data entities with FFPE datasets showing a more pointy distribution than FF datasets (Fig. 4a,b). Quality assessment metrics differed between FF and FFPE arrays as well as between species (Fig. 4c); nevertheless, all metrics were in optimal ranges. Background means calculated prior to normalization were higher in FFPE than in FF arrays. However, the average detection rate of true positive over true negative probe sets (pos vs neg area under curve; AUC) for FFPE samples was in the range of optimal signal separation (>0.5) similarly as for FF samples. Likewise, both the mean absolute deviation (MAD) residual mean and the mean absolute relative log expression (RLE) differed between FF and FFPE samples; however, no outlying datasets were detectable. Signal intensities of antigenomic probes, which can be used as estimates of post-normalization background noise, were slightly higher in FFPE microarrays than in FF arrays. Additionally to the joint normalization (for each species: FF and FFPE combined), we assessed quality metrics for separately normalized datasets (for each species: FF only and FFPE only) as well. No obvious differences in performance parameters could be detected (data not shown). For this reason and since the employed normalization algorithms are more robust with larger sample sizes, we based all further analyses on collectively normalized datasets, from which RefSeq- or ENSEMBL-annotated genes were included.
High intra- and inter-experimental group correlation of FF and FFPE whole-genome microarrays. Using Pearson’s correlation, we compared the individual array datasets with each other (intra- and
SCIENtIfIC ReporTS | (2018) 8:6351 | DOI:10.1038/s41598-018-24781-6
2
www.nature.com/scientificreports/
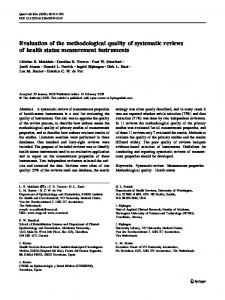
Figure 1. Schematic overview of the study. inter-experimental group comparisons; Fig. 4d–f). For rat and human samples, the biological replicates within each experimental group displayed high correlation coefficients of at least 0.93. For human microarrays, the comparison of the two different lysis time conditions showed a high correlation, not only between the biological pairs themselves but also between all replicates. Inter-experimental group comparisons between FF and FFPE arrays yielded slightly lower but still remarkably high correlation coefficients. Using unsupervised hierarchical clustering, the biological triplicates within the experimental groups r_ FF, r_FFPE and h_FF clustered closely together (Fig. 4g). In the case of h_FFPE arrays, the paired 3 h and 10 h arrays of each case were similar, while the distances between the three different human cases were slightly higher (Fig. 4h). Thus, cluster analysis strengthened correlation results indicating a close relation of h_FFPE_3 h and h_FFPE_10 h datasets as well as a clear separation but still tight relation between FF and FFPE arrays.
High reproducibility and concordant gene behaviour in FF and FFPE microarrays. We deter-
mined the consistency of microarray data by several different means. First, the reproducibility of gene expression signals within FF and FFPE datasets was measured by the coefficient of variation (CV), the ratio between the standard deviation and the mean. For each experimental group, we calculated the %CV for every RefSeq- or
SCIENtIfIC ReporTS | (2018) 8:6351 | DOI:10.1038/s41598-018-24781-6
3
www.nature.com/scientificreports/
Figure 2. Agilent Bioanalyzer electropherograms as suitable basis for RNA quality assessment. (a-f) Isolated total RNA was loaded on Agilent RNA Pico Chips, which were run in an Agilent 2100 Bioanalyzer. RNA profiles of microdissected rat (a) and human (c) FF samples show clearly distinguishable 18 S and 28 S rRNA peaks, which are absent in FFPE samples (b,d-f). Instead, we examined the shape of the plateau and used the DV200 to judge RNA quality of FFPE samples. In human FFPE samples, prolongation of tissue lysis led to a decrease of high-molecular-weight species, since the peak with an average size of 3,000–4,000 nucleotides (d,e; arrows) is no longer present after 10 hours incubation (f). Implementation of a 70 °C incubation step after tissue lysis (e,f) favoured cross-link reduction as well, noticeable by a reduction of the peak on the right-hand side as compared with corresponding untreated samples (d). FU, fluorescent units; nt, nucleotides; DV200, percentage of RNA fragments >200 nucleotides. (g,h) Overview of RIN and DV200 parameters of rat (g) and human (h) FF and FFPE samples to monitor RNA quality. Increasing the lysis time of human tissues (h) from 3 to 10 hours did not significantly affect DV200 values (unpaired two-tailed Student’s t-test; p = 0.2840, t(4) = 1.236), nor did the additional incubation step at 70 °C (p = 0.7292, t(4) = 0.3714). RIN, RNA integrity number; DV200, percentage of RNA fragments >200 nucleotides.
SCIENtIfIC ReporTS | (2018) 8:6351 | DOI:10.1038/s41598-018-24781-6
4
www.nature.com/scientificreports/
Figure 3. Functional RNA quality control by qPCR. (a,b) Representative amplification plots for the reference gene Gapdh (data for 5′-end primer pairs) using either rat (a) or human (b) templates derived from FF or FFPE tissue. (c,d) Cq values for reference genes using either rat (c) or human (d) templates isolated from FF and FFPE tissues. For each gene and template, qPCR with either 3′-end or 5′-end primer sets was run for 40 cycles in duplicates (rat) or triplicates (human). Cq values are depicted as geometric mean ± SD and represent the averages from 3′-end and 5′-end qPCRs. Cq values of h_FFPE_3 h and h_FFPE_10 h samples did not differ significantly (unpaired two-tailed Student’s t-tests; GADPH: p = 0.6935, t(4) = 0.4239; G6PD: p = 0.6398, t(4) = 0.5055; SDHA: p = 0.8427, t(4) = 0.2117). (e) Cq values for reference genes using human FFPE-derived cDNA. FFPE_3 h samples included an additional incubation step at 70 °C, which was omitted for FFPE_3 h w/o 70 °C samples. For qPCR, solely primer sets annealing to the 3′-end of the mRNA were employed. Cq values are depicted as geometric means ± SD. Cq values of h_FFPE_3 h and h_FFPE_3 h w/o 70 °C samples did not differ significantly (unpaired two-tailed Student’s t-tests; GADPH: p = 0.2075, t(4) = 1.502; SDHA: p = 0.5847, t(3) = 0.6104). Rn, fluorescence of SYBR Green in relation to the passive reference dye ROX; Δ Rn, Rn minus baseline; Cq, quantification cycle; Gapdh, glyceraldehyde-3-phosphate dehydrogenase; Pgk1, phosphoglycerate kinase 1; Actb, actin beta; G6pd, Glucose-6-phosphate dehydrogenase; Sdha, succinate dehydrogenase complex flavoprotein subunit A.
SCIENtIfIC ReporTS | (2018) 8:6351 | DOI:10.1038/s41598-018-24781-6
5
www.nature.com/scientificreports/ Gene symbol
Gapdh
Pgk1
Actb
Gfap
Species
rat
rat
rat
rat
Atrn
rat
Mbp
rat
Mag
rat
Cx3cr1
rat
GAPDH
G6PD
SDHA
human
human
human
ACTB
human
PGK1
human
CASP1
human
IL1R1
human
AIF1
human
IL18
human
TLR3
human
HMBS
human
CX3CR1
human
ITGAM
human
Primer sequence forward (5′ end)
5′-TGTGAAGCTCATTTCCTGGTA-3′
reverse (5′ end)
5′-TTACTCCTTGGAGGCCATGT-3′
forward (3′ end)
5′-GTCGGTGTGAACGGATTTG-3′
reverse (3′ end)
5′-TGATGGCAACAATGTCCACT-3′
forward (5′ end)
5′-AAAGGATCAAGGCTGCTGTC-3′
reverse (5′ end)
5′-GCTCATAAGCACAACCGACT-3′
forward (3′ end)
5′-GCCTGTGAAAGGAAGTGAGC-3′
reverse (3′ end)
5′-CCGTTATTTCCATGCTGTCA-3′
forward (5′ end)
5′-AGGCCAACCGTGAAAAGATG-3′
reverse (5′ end)
5′-ACCAGAGGCATACAGGGACAA-3′
forward (3′ end)
5′-GATTACTGCCCTGGCTCCTA-3′
reverse (3′ end)
5′-AGGATAGAGCCACCAATCCA-3′
Product size
Primer efficiency
88 bp
105%
85 bp
113%
74 bp
110%
98 bp
113%
101 bp
112%
90 bp
111%
98 bp
105%
110 bp
123%
108 bp
118%
101 bp
117%
121 bp
92%
120 bp
95%
146 bp
87%
141 bp
97%
126 bp
95%
150 bp
97%
123 bp
90%
109 bp
93%
72 bp
103%
102 bp
121%
99 bp
93%
95 bp
117%
115 bp
85%
95 bp
103%
100 bp
81%
100 bp
104%
Rn_Gfap_1_SG QuantiTect Primer Assay (QT00195517, Qiagen) forward
5′-GTTCGGAGGGAACACACACA-3′
reverse
5′-ACCATCGGTCACAAGCAATG-3′
forward
5′-AGAACATTGTGACACCTCGTA-3′
reverse
5′-GTAGCCAAATCCTGGCTTCT-3′
forward
5′-CAGACCATCCAACCTTCTGTA-3′
reverse
5′-AGTTGGGAATGTCTCCTGATT-3′
forward
5′-TGCTCAGGACCTCACCAT-3′
reverse
5′-CCACGATGTCACCCAAATAA-3′
forward (5′ end)
5′-ATATTGTTGCCATCAATGACCC-3′
reverse (5′ end)
5′-ATGACAAGCTTCCCGTTCTC-3′
forward (3′ end)
5′-CATTTCCTGGTATGACAACGA-3′
reverse (3′ end)
5′-CTTCCTCTTGTGCTCTTGCT-3′
forward (5′ end)
5′-GACATCCGCAAACAGAGTG-3′
reverse (5′ end)
5′-GCATTCATGTGGCTGTTGA-3′
forward (3′ end)
5′-ACCTACGGCAACAGATACA-3′
reverse (3′ end)
5′-CAGCAGTGGGGTGAAAATAC-3′
forward (5′ end)
5′-GGCAGGGTTTAATACAGCAT-3′
reverse (5′ end)
5′-TAGAAATGCCACCTCCAGTT-3′
forward (3′ end)
5′-AAGGTGCGGATTGATGAGTA-3′
reverse (3′ end)
5′-TTTGTCGATCACGGGTCTAT-3′
forward
5′-GCACCACACCTTCTACAATGAG-3′
reverse
5′-AAGGTCTCAAACATGATCTGGG-3′
forward
5′-TGCTGGACAAAGTCAATGAG-3′
reverse
5′-GCTCCCTCTTCATCAAACAG-3′
forward
5′-TGATGCTATTAAGAAAGCCCAC-3′
reverse
5′-GAAACATTATCTGGTGTGGAAGAG-3′
forward
5′-AGACAAGGCCTTCTCCAAGA-3′
reverse
5′-CGTTCCTTGCATTTATCAGCCTC-3′
forward
5′-TGAGCCAAACCAGGGATTTA-3′
reverse
5′-CGTCTAGGAATTGCTTGTTGA-3′
forward
5′-CCTTTAAGGAAATGAATCCTCCTG-3′
reverse
5′-CATCTTATTATCATGTCCTGGGAC-3′
forward
5′-TCATCCAACAGAATCATGAGAC-3′
reverse
5′-CTTCATGGCTAACAGTGCAC-3′
forward
5′-AGCCCAAAGATGAGAGTGAT-3′
reverse
5′-TACGAGGCTTTCAATGTTGC-3′
forward
5′-CCAGTGGGGCCTTCA-3′
reverse
5′-ACCACGATGTCCCCAATATAA-3′
forward
5′-TCAGTGGTGCCTGCAA-3′
reverse
5′-GACATAAGGTCAAGGCTGTTA-3′
Table 1. Details on qPCR primers. Gapdh, glyceraldehyde-3-phosphate dehydrogenase; Pgk1, phosphoglycerate kinase 1; Actb, actin beta; Gfap, glial fibrillary acidic protein; Atrn, attractin; Mbp, myelin basic protein; Mag, myelin-associated glycoprotein; Cx3cr1, chemokine (C-X3-C motif) receptor 1; G6pd, glucose-6-phosphate dehydrogenase; Sdha, succinate dehydrogenase complex flavoprotein subunit A; Casp1, caspase 1; Il1r1, interleukin 1 receptor, type I; Aif1, allograft inflammatory factor 1; Il18, interleukin 18; Tlr3, toll-like receptor 3; Hmbs, hydroxymethylbilane synthase; Itgam, integrin alpha M.
SCIENtIfIC ReporTS | (2018) 8:6351 | DOI:10.1038/s41598-018-24781-6
6
www.nature.com/scientificreports/ ENSEMBL-annotated gene (Fig. 5a,b). The median CV values of rat and human arrays were in a consistently low range indicative of high data repeatability. For human arrays, prolongation of tissue lysis time from 3 hours to 10 hours slightly decreased the median CV suggestive of an improvement in data reproducibility. However, effect size calculation indicated an only minor impact on the overall outcome (Fig. 5b). In the second analysis, we assessed the extent of concordant gene expression between FF and FFPE microarrays. Since FF and FFPE arrays constituted separate data entities (Fig. 4a,b), absolute gene signals could not be directly compared between the different experimental groups. Instead, relative expression changes between triplicates of each group are evaluable and should stay relatively constant between FF and FFPE datasets. To test this, ratios between the biological replicates within each experimental group (represented by arrows in Fig. 5e) were calculated for each RefSeq- or ENSEMBL-annotated gene. Concordant relative gene expression was attested if the ratios of the FF and the FFPE group were either within a certain fold-change cut-off range (conditions (1) and (2) in Fig. 5e) or showed comparable up- or down-regulation (conditions (3) and (5) in Fig. 5e). We tested concordant relative gene expression for four different fold-change cut-offs: 1.3, 1.5, 1.7 and 2.0. Concordance levels steadily increased with augmenting fold-change cut-offs from 40% at a fold-change cut-off of ±1.3 to 90% at a fold-change cut-off of ±2 (Fig. 5f). We further pursued the question whether the analysis of FFPE-derived data reliably yields the same results as for FF datasets. For this, we sorted all RefSeq- or ENSEMBL-annotated genes within each experimental group according to their mean expression values and assigned ascending ranks. The ranks of the 100 highest expressed genes in FF arrays were compared with the ranks of these genes in FFPE arrays (Fig. 5g). For rat and human microarrays, more than 55% and 60%, respectively, of the top 100 FF genes (out of >23,000 genes), could be found within the 100 highest expressed genes in FFPE microarrays; 26–29% could be found within a rank difference of 400. Only for less than 16% of the 100 highest expressed genes in rat and human FF arrays, the rank difference was greater than 400. For selected reference and CNS-relevant genes (rat: Pgk1, bAct, Atrn, Gfap, Mbp, Mag, and Cx3cr1; human: G6PD, PGK1, IL1R1, AIF1, IL18, TLR3, HMBS, CX3CR1, ITGAM and CASP1), expression levels were additionally determined by qPCR, sorted within each experimental group according to transcript abundance and assigned ascending ranks. For microarray- as well as qPCR-derived data, the ranks of genes in FF datasets were compared with the ranks of the same genes in FFPE datasets (Fig. 5h). The minimal rank differences upon comparison of the selected genes clearly indicated high data concordance between rat and human FF and FFPE microarrays. Only for 1 to 2 genes per comparison, the rank differences were greater than 1. For Gapdh-normalized qPCR results, the order of gene expression ranks varied to a higher degree. For the last comparison of data consistency between FF and FFPE arrays, we changed data normalization to exon level. For each annotated gene with more than one exon, a ratio between the signals derived from the most 3′-end- and most 5′-end-located probe set was calculated (Fig. 5c,d). All FF arrays as well as human FFPE arrays showed a slight tendency for stronger signals at the 3′-end. Rat FFPE arrays showed a minimal trend towards the 5′-end. Increasing tissue lysis time for human samples from 3 to 10 hours did not significantly affect the 3′-end/5′-end ratio (p = 0.3587). Altogether, a broad range of tests to examine data reproducibility and consistency demonstrated a high overall concordance rate within and between the FF and FFPE datasets.
Gene set enrichment analysis (GSEA) detects similar pathways in FFPE-derived microarrays and fresh tissue-based RNA-Seq datasets. For the final confirmation that gene expression profil-
ing with small input amounts of FFPE tissue is reproducibly feasible, we used an experimental mouse model (CX3CR1-CreERT2+/−/iDTR+/−; “MGD mice”) characterized by an inducible depletion of microglia, which is followed by microglia repopulation in a pro-inflammatory milieu. For the present study, we used affected cortical areas from MGD mice at a stage of acute microgliosis. For microarray analysis, RNA from laser-microdissected FFPE sections was processed according to established protocols. Transcriptome profiling from manually dissected fresh tissue was done via RNA-Seq (Fig. 6a). All data analyses were based on annotated genes from microarray and RNA-Seq datasets. Also here, reproducibility and concordance of gene signals were assessed. The median %CV of microarray and RNA-Seq datasets were in a consistently low range (Fig. 6b,c). RNA-Seq data, however, showed a higher degree of variability than microarray data. In a next step, we sorted all annotated genes of each control and experimental group based on their mean expression value and assigned ascending ranks for the 500 highest expressed genes per group. Subsequently, we compared the ranks between the two control (ma_CO vs seq_CO) and the two experimental (ma_MGD vs seq_MGD) groups and categorized them according to the rank differences (Fig. 6d). Around 50% of the 500 highest expressed genes from the microarray datasets could be detected among the top 500 genes within the RNA-Seq datasets; 20% were even found within a rank difference lower than 100. 25% of the 500 highest expressed genes from microarray datasets, however, were found within rank differences of more than 2,500 in the RNA-seq datasets, which contained a total of >16,000 genes. Since microarray and RNA-Seq data constitute separate entities, we followed the principle of concordant gene behaviour and evaluated whether the relative expression changes between the mean expression values of the control (CO) and MGD groups were comparable between microarray and RNA-Seq experiments. Concordant relative gene expression was assumed if the ratios between the microarray and the RNA-Seq group were either within a certain fold-change cut-off range (conditions (1) and (2) in Fig. 6e) or showed comparable up- or down-regulation (conditions (5) and (7) in Fig. 6e). Calculations were performed using four different fold-change cut-offs: 1.3, 1.5, 1.7, and 2.0. At a fold-change cut-off of ±1.3, a concordance level of 70% was achieved, which steadily increased to more than 90% at a fold-change cut-off of ±2 (Fig. 6f). In order to verify that transcriptome profiling with FFPE tissue detects similar differentially regulated pathways compared with fresh tissue, we performed gene set enrichment analysis (GSEA) with the genes differentially
SCIENtIfIC ReporTS | (2018) 8:6351 | DOI:10.1038/s41598-018-24781-6
7
www.nature.com/scientificreports/
Figure 4. Microarray performance metrics. (a,b) Frequency distribution of normalized microarray data. Histograms depict rat (a) and human (b) gene signals (rat: n = 36,685 genes; human: n = 53,617 genes) after data normalization and transformation (Log2). Each microarray dataset is represented by a distinct line. (c) Quality assessment metrics for each experimental group. Performance parameters before (background mean) and after (all other parameters) data normalization were monitored via Affymetrix Expression ConsoleTM software. Reported values are mean ± SD (n per experimental group = 3 microarrays). AUC, area under curve; MAD, mean absolute deviation; RLE, relative log expression (d,e) Correlation matrices of Pearson’s correlation coefficients. Intra- and inter-experimental group correlations were calculated based on Log2-transformed rat (d; n = 23,243 genes) and human (e; n = 33,424 genes) data. All correlations were highly significant (p