i
i
i
“outline” 2005/5/2 page 1 i
Taking a New Look at the Latent Semantic Analysis Approach to Information Retrieval E. R. Jessup1
J. H. Martin2
May 2, 2005
1
Department of Computer Science, University of Colorado, Boulder, CO 80309-0430 (
[email protected]). 2 Department of Computer Science, University of Colorado, Boulder, CO 80309-0430 (
[email protected]).
i
i i
i
i
i
i
“outline” 2005/5/2 page 2 i
2
0.1
Introduction
Latent Semantic Analysis (LSA) [4] is a mathematical approach to the discovery of similarity relationships among documents, fragments of documents, and the words that occur within collections of documents. Although LSA was originally applied in the context of information retrieval [4], it has since been successfully applied to a wide variety of text-based tasks [16]. LSA is a variant of the vector space model for information retrieval that uses a reduced-rank approximation to the term-document matrix. In the information retrieval domain, rank reduction is applied in an effort to remove the “noise” that obscures the semantic content of the data [4]. In this context, two claims are typically made for LSA: that it provides a substantial improvement in retrieval performance over the standard vector space model and that this improvement results from LSA’s ability to solve what is known as the synonymy problem. Despite the many successful applications of LSA, there are a large number of unanswered questions that bear on where, and in what manner, LSA should be applied. The purpose of this paper is to begin to investigate these issues in LSA’s original context of information retrieval and to pose new directions for future work. Among the more critical questions that we address in this paper are the following: • Does LSA reliably improve retrieval performance as compared to the vector space model? • Does LSA improve retrieval performance by addressing the synonymy problem? • How can the optimal rank be chosen? • How can relevant and irrelevant documents be distinguished? • And are there alternative matrix techniques that can be used to discover reduced representations? This paper is organized as follows. In Sections 0.2–0.3, we review the details of the vector space model and LSA. In Section 0.4, we outline our empirical methods. In Section 0.5, we compare the retrieval performances of LSA and the full-rank vector space model. In Section 0.6, we evaluate how the performance of LSA depends on its ability to handle synonyms. In Sections 0.7–0.8, we consider the choice of rank and how best to identify relevant documents. In Section 0.9, we examine the use other orthogonal decompositions for rank reduction. Finally, in Section 0.10, we summarize our results.
0.2
The Vector Space Model
In the vector space model, a collection of documents is encoded as a term-document matrix A, where each column of that matrix represents a single document in the collection. The ith element of the jth column is a function of the frequency of term i in document j. When a collection of d documents is indexed by t terms, the
i
i i
i
i
i
i
0.3. Reduced-Rank Vector Space Model
“outline” 2005/5/2 page 3 i
3
term-document matrix is t × d. A user’s query is translated into a t-dimensional column vector q in the same way with the ith element giving the weighted frequency of term i in the query. In the vector space model, a document is deemed similar to a query if the vector representing it is similar to the vector representing the query according to some measure, typically the cosine of the angle between the two vectors. The full set of cosines is defined by cos θj =
q T (Aej ) , k q k2 k Aej k2
j = 1, . . . , d,
where d is the number of documents, q is the query vector, and ej is the jth canonical vector.
0.3
Reduced-Rank Vector Space Model
LSA is a variant of the vector space model that uses a reduced-rank approximation to the term-document matrix. That approximation Ak is derived from the SVD by retaining only the largest k singular values and corresponding left and right singular vectors. That is, Ak = Uk Σk VkT , where Σk is the k × k diagonal matrix with the largest k singular values on its diagonal, Uk is the t × k matrix with the corresponding left singular vectors as columns, and Vk is the d × k matrix with the corresponding right singular vectors as columns. The matrix Ak = Uk Σk VkT is the optimal rank-k approximation of A in that it minimizes the Froebenius norm distance between A and its rank-k approximations [11, 20]. In LSA, the query-document comparison is carried out by computing the cosines of the angles between the query vector and the columns of Ak : cos θj =
eTj Vk Σk (UkT q) (Ak ej )T q , = k A k ej k2 k q k 2 k Σk VkT ej k2 k q k2
(1)
for j = 1, . . . , d. Rank reduction is touted as a mechanism for dealing with imprecision in the term-document matrix. This uncertainty arises primarily from the wide array of lexical choices available to writers. In particular, synonymy permits writers to refer to the same concept with any number of distinct terms, and polysemy permits the same term to refer to an array of distinct concepts. Furnas et al. [12] demonstrate the pervasive nature of these linguistic problems experimentally. Note that this uncertainty is not overcome by expert intervention: there is an average 20% disparity in decisions made by professional indexers [13]. Imprecision also results from artifacts of data collections: a database can be repetitive, containing multiple copies of the same document. For these reasons, no single term-document matrix can be considered an exact representation of a given document collection. Rank reduction
i
i i
i
i
i
i
“outline” 2005/5/2 page 4 i
4
Collection
Number of Terms
Number of Documents
Number of Queries
CF TIME MED
9529 20853 12672
1238 424 1033
100 83 30
Table 1. Numbers of terms, documents, and queries in the test collections.
is applied in LSA in an effort to find an approximation Ak that actually better represents the semantic content of a collection than does the original term-document matrix A. Another advantage of rank reduction is that, when k is much less than d, the reduced-rank representation of the database (saved as Uk , Σk , and Vk ) requires much less storage than does the full term-document matrix A. Changes to the database are accommodated by updating or downdating the factors. See [23] for details of those procedures.
0.4
Testing the Methods
We set out to answer questions about the performance of LSA by means of a series of empirical tests. In this section, we describe our experimental methodology by introducing the test collections and presenting our mechanisms for judging retrieval quality. We also describe our testing programs.
0.4.1
The Test Collections
To test our methods and hypotheses, we make use of three widely available standard information retrieval test collections: a collection of articles from TIME magazine (TIME) from 1963 [25], a collection of a set of Medline (MED) [19] articles on various medical topics, and the Cystic Fibrosis collection (CF) [22] which consists of a set of Medline articles containing the phrase Cystic Fibrosis. Each of these test collections consists of a set of short articles, a set of queries, and a set of querydocument pairs indicating which documents are relevant to which queries. Table 1 provides more of the details of these collections. Various methods can be used to create the entries of a term-document matrix from a test collection. For the purposes of these experiments, we elected to use the simplest, most widely employed methods of creating the matrix. Namely, • No stop lists were used (although numbers were removed). • No stemming was performed.
i
i i
i
i
i
i
0.4. Testing the Methods
“outline” 2005/5/2 page 5 i
5
• Term weighting consists of the standard term frequency times inverse document frequency (TFxIDF) method, for both documents and queries. We should note that TFxIDF weighting describes a family of related methods. We define the i, j element of the t × d term-document matrix A as ai,j = tfi,j ∗ idfi with idfi = log
d , ni
where tfi,j is the raw term frequency of term i in document j, and ni is the number of documents in the collection that contain term i. This method balances the importance of a term to a document, evidenced by its frequency in that document, against a term’s overall discriminative ability, based on its distribution across the collection as a whole.
0.4.2
Our Metrics
We evaluate the methods by means of two standard metrics: recall and precision. Recall, which is the fraction of the total number of relevant documents in the collection that are returned, is a measure of completeness. Precision, which is the fraction of the total number of documents returned that are relevant, is a measure of accuracy. Note that these metrics are based on the notion of a return set of fixed size, and make no use of the notion of the total ranking that is central to the vector space model. To adapt these recall and precision measures to systems that rank an entire collection, it is traditional to present results as a plot of average precision measured at various levels of recall. More specifically, given a query, a ranking, and a set of relevance judgments, we collect the precision values when each of a fixed set of recall levels is achieved. These results are then averaged over the results for all the queries in the collection and plotted. There is an inherent tension between recall and precision. The simplest way to achieve 100% recall (i.e., to find all the relevant documents) is to return all of the documents in the collection. Of course, doing so normally results in an abysmal precision score. On the other hand, any attempt to be careful and return only relevant documents results in a low recall score. As a result, recall-precision curves tend to display high levels of precision at low levels of recall, accompanied by a drop off in precision at higher levels of recall. Any two systems that provide a ranking of documents with respect to a query can be compared by plotting their respective recall-precision curves on the same plot. In general, systems with higher precision values across a wide range of recall values are superior. That is, the higher the curve on the plot, the better.
i
i i
i
i
i
i
“outline” 2005/5/2 page 6 i
6
0.4.3
Our Methodology
For ease of code development and data manipulation, we ran our experiments using prototype Matlab codes based on dense matrix representations and operations. Sparse implementations will be necessary for our future studies of complexity issues.
0.5
How well does LSA work?
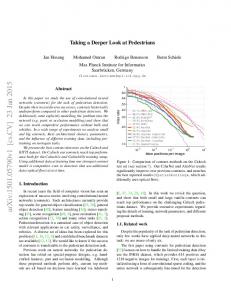
The results of our retrieval experiments are summarized in Figures 1, 2, 3 and 4. In each of these figures is plotted average precision at ten levels of recall, where the averages are computed over the complete set of queries for each collection. Figure 1 shows the performance of our baseline vector space model for each of the three collections. Each of the remaining figures shows the performance of the LSA model across a range of reduced ranks for one of the collections. 80 CF Vector Space Model (9529x1238) Time Vector Space Model (20853x424) Medline Vector Space Model (12762x1033)
70
60 Vector Space Model Results
Precision
50
40
30
20
10
0 10
20
30
40
50
60
70
80
90
100
Recall
Figure 1. Precision vs. recall results for the A vector space model for all three collections. Before discussing our results with the LSA models, a few words about the basic vector space model results given in Figure 1 are warranted. The curves for the CF and the TIME collections display a fairly typical pattern that illustrates the wellknown tradeoff between precision and recall: high precision at low levels of recall with a relatively rapid drop in precision as recall is increased. The curves for the MED collection illustrate an abnormally high level of performance, with relatively high levels of precision maintained across an unusually wide-range of recall levels. As discussed by Deerwester et al. [4] this appearance is likely a result of the way
i
i i
i
i
i
i
0.5. How well does LSA work?
“outline” 2005/5/2 page 7 i
7
that the document set was created, MED itself being a collection of the results of document searches using the provided query set. The LSA results for the CF collection shown in Figure 2 demonstrate that the models at and above rank 300 match the vector space model at low levels of recall and outperform the vector space model at recall levels above 30%. The best overall performance is given by the rank 300 model. Note also that, although the 100 and 50 rank models show degraded performance at the lowest levels of recall, they outperform the vector space model at recall levels above 40%. 60 Full Rank Matrix (9529x1238) Rank 1200 SVD Rank 900 SVD Rank 600 SVD Rank 300 SVD Rank 100 SVD Rank 50 SVD Rank 20 SVD
50
Precision
40 Cystic Fibrosis Collection: SVD Experiments 30
20
10
0 10
20
30
40
50
60
70
80
90
100
Recall
Figure 2. Precision vs. recall results for the vector space model and 7 LSA models for the CF collection. The LSA results for the TIME collection are not as encouraging. The best rank choice matches the performance of the vector space model, but the performance of LSA steadily degrades as the rank is reduced. Yet another pattern of results emerges with the MED collection. As can be seen in Figure 4, every LSA model, except the lowest rank model, outperforms the original vector space model. Moreover, the observed improvements in precision are substantial and hold across the entire range of recall levels. These results are particularly impressive given the already high level of performance in the vector space model. Note that although these experiments were not performed in precisely the same fashion as those described in [4], the pattern of results reported here substantially mirrors the results reported there. Again, these exceptional results are likely explained by the method of construction of the MED document collection. Except for the MED collection, the results from our LSA models do not meet the levels of performance that are anecdotally cited for LSA. It is often stated that LSA models outperform standard vector space models by an average of 30% (see,
i
i i
i
i
i
i
“outline” 2005/5/2 page 8 i
8 70 Full Rank Matrix (20853x424) Rank 400 SVD Rank 300 SVD Rank 200 SVD Rank 150 SVD Time Collection: SVD Experiments Rank 100 SVD Rank 50 SVD Rank 20 SVD Rank 10 SVD
60
Precision
50
40
30
20
10
0 10
20
30
40
50
60
70
80
90
100
Recall
Figure 3. Precision vs. recall results for the vector space model and 8 LSA models with the TIME collection. for example, [17, 24]), but there is no evidence in our results or in the published literature indicating that LSA can reliably be expected to deliver such performance on any given collection [4, 6, 7, 8, 9, 10]. Rather an LSA model can almost always be found that can match, or slightly outperform, the performance of an unadorned vector space model across a wide range of collections. As we discuss in Section 0.7, the best level of performance is often obtained using a significantly reduced rank. The published literature does, however, mirror our finding that LSA clearly outperforms the vector space model by a wide margin on the MED collection for most rank choices. Note that our primary interest here is in gaining a better understanding of the details of the LSA model, its relation to the vector space model, and other methods of rank reduction. We have made no attempts to optimize the performance of either the vector space model or the LSA models with any of the standard information retrieval methods that almost always improve the performance of models such as these. In particular, we did not attempt to assess the impact of stemming, alternative term weighting schemes, or relevance feedback.
0.6
What about synonymy?
One of the most interesting claims made about LSA is that it addresses the phenomenon of synonymy. Although synonymy is a complex issue that has long resisted simple definitions, the core of the issue is the notion that different words can be used to refer to the same, or at least highly similar, concepts. A traditional linguis-
i
i i
i
i
i
i
0.6. What about synonymy?
“outline” 2005/5/2 page 9 i
9
90 Full Rank Matrix (12762x1033) Rank 1000 SVD Rank 900 SVD Rank 600 SVD Rank 300 SVD Rank 150 SVD Rank 100 SVD Rank 50 SVD Rank 20 SVD
80 70
Precision
60 50 40
Medline Collection: SVD Experiments
30 20 10 0 10
20
30
40
50
60
70
80
90
100
Recall
Figure 4. Precision vs. recall results for the vector space model and 8 LSA models with the MED collection. tic test for the synonymy of two words is substitutability: two words are said to be synonyms if they can be substituted in some context with no effect on the resulting meanings. This phenomenon is relevant in the context of information retrieval because synonymy-based mismatches between the words used in a query and the words used in a document inevitably lead to decreased retrieval performance. Consider the following example queries Tell me about Ford car sales last month. Tell me about Ford automobile sales last month. In the first example, the use of car may fail to rank highly documents that use the word automobile, while the second example may fail to rank highly documents that use the word car. The claim made for LSA is that the representations of documents that make of use different synonyms, but which are otherwise similar, are quite similar to one another in their reduced-rank representations. Returning to our examples, the claim is that documents that make use of either car or automobile and which are otherwise similar are given similar document vectors by LSA. Correspondingly, query vectors using either of the terms are similar to the reduced-rank representations of documents using either of the terms. Note that synonymy is just one example of a large class of lexical phenomena that can lead to term mismatches in information retrieval settings. For example, queries such as Ford vehicle sales or Ford SUV sales, which do not involve the use of synonyms, run into the same mismatch problems as the ones given above. In
i
i i
i
i
i
i
“outline” 2005/5/2 page 10 i
10 these cases, the mismatch arises from the use of terms that denote different levels of specificity. See [14] for a longer discussion of various lexical relations that can cause problems for information retrieval systems. Deerwester et al. [4] claim that overcoming these lexical mismatch problems is the main benefit that LSA provides. More specifically, they claim that the primary benefit that LSA provides is to increase precision at higher levels of recall. The logic of this claim is that query/relevant-document pairs with a high degree of term overlap are already handled well by the normal vector space model, leaving little room for LSA to improve things by increasing the ranking of such documents. On the other hand, query/relevant-document pairs that have little or no term overlap can be improved by LSA since the vector space model has no hope of giving these relevant documents high rankings. Although the logic of this claim seems clear, it has never been directly verified. A direct approach to assessing this claim would involve identifying naturally occurring synonym sets as they are used in both queries and documents in standard test collections. An assessment could then be made for how well these documents and queries fare in both the vector space and LSA models. Unfortunately, the rather technical nature of the vocabularies in the CF and MED collections make this set rather difficult to identify, and the TIME collection is far too small to yield a reasonable sample of queries and relevant documents making use of such synonym sets. Because of these issues, we decided to explore a simpler approach that directly addresses the broader term mismatch issue mentioned earlier. The basic idea is to identify all those query/relevant-document pairs that have no terms in common. In the ordinary vector space model, these pairs produce a cosine of zero, and a correspondingly low ranking. If the synonymy claims for LSA are correct, then these pairs should produce higher cosines and improved rankings in the better LSA models. We tested this hypothesis using the MED collection. An examination of this collection revealed that only two of the original 33 MED queries have relevant documents containing no terms in common with the query. However, a considerable amount of the term overlap among the remaining queries is due to the presence of high frequency, low content, function words. We therefore relaxed our criteria and considered all query/relevant-document pairs that had no content words in common. Following this strategy, we found that of the total 696 query/document relevance judgments in the MED collection, 100 have no content word overlap between the query and the relevant document. Using the rank 100 SVD MED matrix as a comparison, these documents were observed to improve their rankings by an average of 188 positions for an average 11% improvement in rank over the normal vector space model. By comparison, relevant documents with term overlap improve their positions on average by less than one position. This observation is consistent with the notion that, when it works, the primary benefit conveyed by LSA is on relevant documents with little term overlap with their queries. Of course, it is possible that LSA is achieving this benefit in a way that would have little impact in realistic settings. For example, an improvement of 100
i
i i
i
i
i
i
0.7. What is the right choice of rank?
“outline” 2005/5/2 page 11 i
11
places from position 1110 to 1010 is of far less benefit in this collection than is an improvement from position 110 to 10. We, therefore, employed a metric designed to assess the nature of the improvement that LSA is providing. This metric is based on the notion of the gap to be closed from a relevant document’s position in the vector space model to the top position in the ranking. Consider, for example, a document ranked 100 in the original model and 80 in an LSA model. In terms of position, it has improved by 20 places, but it can also be said to have closed 20% of the distance to the top of the ranking. On the other hand, a move of 20 from position 1000 to 980 has closed a much less impressive 2% of that gap. More formally, we employed the metric ∆/p, where ∆ is the difference between the start and end positions of the document and p is the lower of these two positions. In the case where the document has improved its rank this metric is positive; in the case where a document moves down, it reflects a negative score of the same magnitude as an equivalent upward move. Using this measure, we observe that the zero-overlap relevant documents close on average 20% of their gap in the LSA model, while relevant documents with term overlap on average close only 3% of their gap. In sum, these results indicate that a considerable amount of the benefit conveyed by LSA results from the upward re-ranking of relevant documents that lack terms in common with their queries. Moreover, it appears to be the case that this benefit is significant because relevant documents are moved a considerable distance towards the top of the ranking. Note, that these results do not show that LSA solves the synonymy problem, nor that synonymy is even a problem in this domain. Nevertheless, they do show that LSA can overcome the broader problem of term mismatch between queries and their relevant documents.
0.7
What is the right choice of rank?
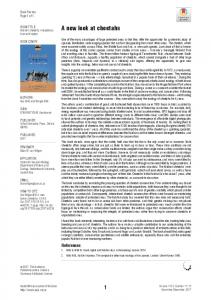
Rank reduction was first promoted by Deerwester et al. [4] as a mechanism for removing the “noise” that obscures the latent semantic structure of the document collection. Which singular values to retain to best capture that structure remains an unanswered question, but, roughly 100-300 singular values are typically retained regardless of the matrix size (see [2, 6, 18], for example.) In an effort to better quantify that choice, we now take a closer look at the effect of the rank on the performance of LSA. We begin our search for a natural choice of rank by examining the singular values of the term-document matrices. Anecdotally, removing noise has become associated with removing “small” singular values. Yet, as Table 2 shows, the termdocument matrices we tested are all of full rank, and the range of singular values is not large. No singular value can immediately be considered negligible. A plot of the singular values gives no more clues. Figure 5 shows the singular values of the termdocument matrix for the MED collection. This plot has the form typical for the matrices we examined. The singular values decrease smoothly, with no significant gaps or steps to identify natural breaks. Moving away from the individual singular values, we turn instead to the testing
i
i i
i
i
i
i
“outline” 2005/5/2 page 12 i
12
Collection
Dimensions of Matrix
Rank
Minimum Singular Value
Maximum Singular Value
CF TIME MED
9529 × 1238 20853 × 424 12672 × 1033
1238 424 1033
8.40 2.45 8.84
290.05 523.09 283.45
Table 2. The ranges of singular values for tested term-document matrices. 300 Singular Values of MED Matrix
250
singular value
200
150
100
50
0
0
200
400
600 index
800
1000
1200
Figure 5. A plot of the singular values of the MED collection. of various ranks. Tables 3 shows the precision at 20% and 50% recall at all tested ranks for the three test collections. Also shown is the percent relative error in the low-rank approximation Ak to the full-rank term-document matrix A in each case. kAk kF ), a measure computed conveniently from the The error reported is 100(1 − kAk F recorded singular values.
i
i i
i
i
i
i
0.7. What is the right choice of rank?
CF:
13
Rank
% Relative Error in Ak
Precision at 20% Recall
Precision at 50% Recall
1238 1200 900 600 300 100 50 20
0.0 0.1 2.5 8.0 19.8 38.8 49.4 61.1
45.02 45.62 45.26 46.91 46.76 40.18 34.41 23.34
16.60 16.70 17.69 18.45 20.68 21.44 18.05 13.60
Rank
% Relative Error in Ak
Precision at 20% Recall
Precision at 50% Recall
424 400 300 200 150 100 50 20 10
0.0 0.3 3.3 8.8 13.1 19.3 29.4 40.8 47.6
40.15 40.28 37.34 38.95 36.89 35.99 35.37 29.97 23.12
18.36 17.91 17.53 17.24 16.54 17.18 17.21 15.43 12.70
Rank
% Relative Error in Ak
Precision at 20% Recall
Precision at 50% Recall
1033 1000 900 600 300 150 100 50 20
0.0 0.1 1.0 6.2 18.3 31.1 38.4 49.9 62.4
70.39 72.53 72.56 73.72 77.95 76.18 81.95 74.81 53.03
49.98 51.52 53.42 55.39 61.19 67.61 68.75 60.66 46.49
TIME:
MED:
“outline” 2005/5/2 page 13 i
Table 3. Relative error in Ak and retrieval performance.
i
i i
i
i
i
i
“outline” 2005/5/2 page 14 i
14 As noted in Section 0.3, an uncertainty of roughly 20% might naturally be expected in the matrix representation of any collection. For both the CF and MED collections, the LSA rank (300) that results in an error near 20% does in fact provide an improvement in retrieval performance over the full-rank vector space model. More surprising is the fact that the best performance for the MED collection is recorded when the low-rank approximation imposes a nearly 40% error. The LSA results are still better than those for the vector space model when the error is almost 50%. The results for the CF collection are similar. The best precision at 20% recall is found at an error of 8.0%, but a nearly identical precision is recorded at an error of 19.8%. At errors near 40 and 50%, respective precisions of 86% and 73% of optimal are noted. At 50% recall, the results more closely resemble those for the MED collection: best performance is seen at a nearly 40% error, and there is still an improvement over the vector space model at an almost 50% error. What these numbers tell us is that the pro forma rank range of 100-300 is a reasonable one for the rank 1238 CF and rank 1033 MED collections but that reasonable performance is also realized for ranks as small as 50. The TIME collection provides a slightly different scenario. In this case, the best results are seen for full or nearly full rank matrices, but there is actually little difference between the results over a range of relative errors from 3.3 to 29.4% (ranks 300 through 50). When the error grows to 40.8%, the precisions are 75 and 84% of the full rank values for 20 and 50% recall, respectively. Only when the error reaches 47.6% does the performance degrade markedly. Thus, again, a rank range of 50-300 provides acceptable performance although, for this collection, any sizable rank reduction is something of a detriment. Our results indicate that LSA is doing quite a bit more than merely removing “noise” from the original representation of the term-document matrix: far too much error is present in the models with the best retrieval performance to be consistent with that notion. These results are consistent with those reported by Ding [5]. He presents a probablistic mechanism for selecting the optimal rank based on an analysis of the sizes of the singular values. This result relies on the observed Zipf-like distribution among the singular values found in these models. For MED, the one dataset that we have in common, Ding’s model predicts an optimal rank of 184. This is quite close to the rank of 150 which represents the best MED model we found (note that we did not do a fine-grained search in this range and hence did not examine the performance of a model at rank 184). Clearly, further work is warranted into the relationship between the degree of error introduced by rank reduction and the empirical distribution of singular values observed in these test collections.
0.8
Which documents are relevant?
In the literature [2, 10, 21], cosine cutoffs as large as 0.9 are recommended. That is, a document is judged relevant to a query only if the cosine defined in equation (1) is at least 0.9 in magnitude. Our tests show that 0.9 is not a good choice. We examined the cosines computed for the 1,396,056 query-document pairs
i
i i
i
i
i
i
0.8. Which documents are relevant?
“outline” 2005/5/2 page 15 i
15
Interval
Number of Query/Doc Pairs
Percentage of All Pairs
[0.7, 1.0] [0.6, 0.7) [0.5, 0.6) [0.4, 0.5) [0.3, 0.4) [0.2, 0.3) [0.1, 0.2) [0.0, 0.1)
0 28 95 422 1397 4423 45784 1343907
0% 0% 0.01% 0.03% 0.10% 0.32% 3.27% 96.26%
Table 4. The cosine magnitudes for 1,396,056 query-document pairs.
from the three databases. Table 4 shows the magnitudes of those cosines. The largest recorded cosine is 0.6781, and over 96% of the cosines are less than 0.1. These results are consistent for all of the contrived and real term-document matrices we tested and are also typical for other large-order applications [15]. The failure of the 0.9 cutoff does not, however, signal a failure of the method. Figures 2–4 show that LSA does deliver high precision at low recall levels. That is, LSA does produce a reasonable ordering of the first few documents returned. Thus, in applications where only a few of the relevant documents are needed, LSA can indeed be expected to return them early in the retrieval process. Table 5 shows the retrieval results for two sample queries from the MED database. There are 28 documents relevant to query 9, and the first five documents returned by LSA are among them. Nonetheless, the cosines corresponding to those relevant documents are quite small, the maximum being 0.1727. Query 10 provides even more extreme results. There are 24 documents relevant to that query, and four of them are among the first five returned. A fifth relevant document is returned ninth. In this case, the largest cosine is only 0.0190. Note that these queries were chosen to illustrate some sample cosines with relevant documents. The precision values averaged across the entire range of queries is, of course, lower. These results suggest two alternatives to a fixed cutoff value like 0.9. If recall is not an issue, a small, fixed number of documents can be returned. This solution might be appropriate for a search engine for which the volume of data returned should be limited. When users are interested in a larger number of relevant documents, we suggest the use of a relative cosine cutoff. That is, the computed cosines are all divided by the cosine of largest magnitude, and a fixed cutoff is applied to the results. Table 6 shows the average recall and precision values for various fixed relative cutoffs. The results for TIME and MED are similar. At a relative cutoff of 0.7,
i
i i
i
i
i
i
“outline” 2005/5/2 page 16 i
16
QUERY 9
Position
Document Number
Cosine
Recall
Precision
1 2 3 4 5
409 422 56 30 268
0.1727 0.1643 0.1570 0.1569 0.1547
3.57 7.14 10.71 14.29 17.86
100.00 100.00 100.00 100.00 100.00
QUERY 10
Position
Document Number
Cosine
Recall
Precision
1 2 3 4 9
543 532 58 540 542
0.0190 0.0159 0.0125 0.0107 0.0095
4.17 8.33 12.50 16.67 20.83
100.00 100.00 100.00 100.00 55.56
Table 5. Retrieval performance in terms of cosine value, recall, and precision for two MED queries. Values are listed for the first five relevant documents retrieved. The position of each document in the retrieved set is also given.
meaning that all documents with cosines at least 70% of the maximum cosine are returned, about half of the relevant documents are found. For the TIME collection, on average roughly half of the documents returned are relevant (56% precision) while, for the MED collection, almost three quarters are relevant (72% precision). These results suggest that a relative cutoff of 0.7 is a reasonable choice.
i
i i
i
i
i
i
0.8. Which documents are relevant?
CF:
TIME:
MED:
“outline” 2005/5/2 page 17 i
17
Relative Cutoff
Recall
Precision
Number of Documents Returned
0.90 0.80 0.70 0.60 0.50 0.40 0.30 0.20 0.10
5.88 9.07 13.30 19.26 25.37 34.44 46.11 59.42 78.47
73.84 72.77 63.53 53.03 45.59 37.49 28.09 19.42 10.04
2 4 7 15 27 54 106 211 453
Relative Cutoff
Recall
Precision
Number of Documents Returned
0.90 0.80 0.70 0.60 0.50 0.40 0.30 0.20 0.10
35.65 46.44 55.96 65.81 69.56 75.25 79.15 82.50 89.98
57.73 57.14 56.00 55.08 53.61 51.95 51.00 47.69 43.33
1 2 3 5 6 8 10 14 26
Relative Cutoff
Recall
Precision
Number of Documents Returned
0.90 0.80 0.70 0.60 0.50 0.40 0.30 0.20 0.10
16.54 31.52 46.30 62.59 71.98 81.71 90.20 94.14 97.40
84.82 76.82 72.00 63.36 56.65 47.43 38.98 32.06 22.55
4 9 16 25 32 49 77 126 193
Table 6. Average precision, recall, and total numbers of documents returned for various relative cutoff values.
i
i i
i
i
i
i
“outline” 2005/5/2 page 18 i
18 The CF collection, however, puts this selection in question. At a relative cutoff of 0.7, the precision is high (64%), but the recall is very low (13%). To find about half of the relevant documents, we need instead to use a relative cutoff in the range 0.2–0.3. Note, that there is a substantial penalty involved in going below this to a cutoff into the range of 0.1 even though it boosts recall to around 78%. At this level of recall, the number of documents that need to be examined is quite large (453), representing nearly one third of the entire collection. As with many of our other findings, the lesson to take away from this section is somewhat application dependent. However, there are some general guidelines that appear to hold across collections: • Absolute cosine cutoffs are unlikely to give reasonable performance. • Applications where precision is critical can use relative cosine cutoffs as high as 90%. • In settings where recall is critical, cutoffs as low as 20% should give high levels of recall with manageably sized return sets.
0.9
Are other factorizations good?
The inherent imprecision of the term-document matrix leads to the question of whether an optimal matrix decomposition is actually necessary for rank reduction. In [3], a variant of LSA based on the ULV decomposition is introduced. In this section, we briefly examine another variant, first described in [1], that is based on the QR decomposition. In the latter case, the term-document matrix is factored as A = QR with orthogonal Q and upper triangular R, and its low rank approximation is constructed from reduced-rank forms of these factors. Query-document comparison again requires computation of the cosines between the query vector q and the columns of A. Those cosines are determined from q T A or, in terms of the QR factors, q T QR. The ULV decomposition is computed directly from the QR decomposition. That is, if A = QR, we can compute the QR decomposition of R T = V T LT so that A = QLV . Setting Q = U completes the ULV decomposition A = U LV (ignoring column pivoting). For the term-document matrix with normalized columns, the cosines are now q T U LV = q T QLV = q T QR. That is, for query-document comparison, the QR-based variant of LSA gives the same results as the ULV-based variant, but at half the computational cost. Note, however, that, unlike the ULV- and SVDbased methods, QR-based LSA does not provide an orthogonal basis for the term space and so may not lend itself to some functions involving term-term comparison. In the remainder this section, we first give the details of the QR-based method then compare it to SVD-based LSA in terms of precision vs. recall. No such comparison is provided in [3], so these results provide the first validation of the use of alternative decompositions. The QR-based method begins with the QR decomposition of the term-document matrix A using column pivoting, so that AΠ = QR or A = QRΠT , where Q is a t × t orthogonal matrix, R is a t × d upper triangular matrix, and Π is a d × d
i
i i
i
i
i
i
0.9. Are other factorizations good?
“outline” 2005/5/2 page 19 i
19
permutation matrix. QR decomposition with column pivoting tends to push the smaller elements of R to the bottom rows; thus rank reduction is carried out by setting those rows to zero. We denote as Rk the k × d matrix whose rows equal the first k rows of R and as Qk the t × k matrix whose columns equal the first k columns of Q. Then the rank-k approximation to A is (QR)
Ak
= Q k Rk ΠT .
A document is judged relevant to a query if the angle between the vectors representing the document and query are sufficiently small. Recalling equation (1), we compute the cosines cos θj =
(QR) eTj (ΠRkT QTk q) (Ak ej )T q = , k A k ej k2 k q k 2 k RkT QTk ej k2 k q k2
(2)
for j = 1, . . . , d. Figures 6-7 compare the precision vs. recall curves for the best choices of ranks for the QR- and SVD-based methods. On all of these plots, the solid line shows the precision vs. recall for the full-rank vector space model. These QR results follow the same problem dependent pattern as observed in Figures 2-4 for SVD-based LSA. Moderate improvement over the vector space model is seen for the CF collection; little or no improvement is seen for the TIME collection; and extraordinary improvement is noted for the MED collection. For the CF collection, rank 300 is the best choice for both methods. Both provide improvements over the vector space model for recall levels over about 20% with standard SVD-based LSA giving slightly better performance than the QR version. For the TIME collection, 200 is the best rank for both methods, but neither technique provides significant gain over the vector space model. The situation is a little different for the MED collection. Figure 8 shows the precision vs. recall curves for ranks 100 and 600 for both methods for that collection. In this case, the best rank choice for the SVD is 100 while the best rank choice for QR is 600. Despite the large difference,the SVD performs notably better than does QR for the best ranks, although both provide an improvement over the vector space model. More interesting is the fact that the rank 100 performance is substantially better than the rank 600 performance for the SVD-based method while the behavior is the opposite for the QR-based method. Indeed, the 100-rank QR version actually performs worse than the vector space model. These preliminary results suggest that the best choice of rank may be even more strongly problem dependent for the QR-based method than for standard LSA. And how best to choose that rank is not easy to say. Because the SVD provides the optimal low-rank approximation to the term-document matrix, we can expect that the relative error in the approximation derived from the QR decomposition is worse than that derived from the SVD, but we did not compute those errors in this preliminary study. From these results, we see that, for a good choice of rank, the QR-based and ULV-based methods work similarly to the standard SVD-based LSA. Whether it makes sense to consider these alternatives depends on their costs. In the case of
i
i i
i
i
i
i
“outline” 2005/5/2 page 20 i
20
60 Full Rank Matrix (9529x1238) Rank 300: Best SVD Rank 300: Best QR 50
Precision
40
Cystic Fibrosis Collection: QR and SVD Compared
30
20
10
0 10
20
30
40
50
60
70
80
90
100
Recall
Figure 6. Maximum precision vs. recall curves for QR and SVD for the CF collection.
70 Full Rank Matrix (20853x424) Rank 200: Best SVD Rank 200: Best QR
60
Precision
50
Time Collection: QR and SVD Compared
40
30
20
10
0 10
20
30
40
50
60
70
80
90
100
Recall
Figure 7. Maximum precision vs. recall curves for QR and SVD for the TIME collection.
i
i i
i
i
i
i
0.10. Summary
“outline” 2005/5/2 page 21 i
21
90 Full Rank Matrix (12762x1033) SVD Rank 600 SVD Rank 100 QR Rank 600 QR Rank 100:
80 70
Precision
60 50 40 Medline Collection: QR and SVD Compared
30 20 10 0 10
20
30
40
50
60
70
80
90
100
Recall
Figure 8. Maximum precision vs. recall curves for QR and SVD for the MED collection. Curves for rank 100 and 600 are also provided for both methods. dense matrices, the rank-k QR-based and SVD-based methods have similar storage requirements (O(tk + dk − 21 k 2 ) and O(tk + dk), respectively), while the ULV-based method requires slightly more space (O(tk + dk + 21 k 2 )). For sparse matrices, those comparisons depend on the degree of fill, and the QR factors are generally dense while the SVD factors may not be. Thus, a true comparison requires study of fill in the decompositions. Similarly, the relative computational costs depend as well on fill, rank, and the number of iterations needed to compute the SVD. Furthermore, different rank choices may be required for the different methods. For example, the optimal rank choices differ by a factor of six for the MED collection, and it is unlikely that the QR method could provide any cost benefit in that case. No comparative complexity data are provided in [3], and we are not able to gather them with our dense Matlab prototypes. A more thorough complexity study of these methods will be part of our future work.
0.10
Summary
Our goal in writing this paper was to improve our understanding of LSA for information retrieval through empirical testing. We set out to address a series of specific questions about the implementation and performance of the method. In this section, we summarize our findings and suggest future research areas. A primary concern was the reliability of LSA as compared to the full-rank vector space model. From every angle, we found retrieval performance to be strongly dependent on both the rank chosen for LSA and on the document collection used.
i
i i
i
i
i
i
“outline” 2005/5/2 page 22 i
22 These results are somewhat unsatisfying as little can be said about either factor a priori, but some general observations can be made. We found that, at best, LSA with the optimal rank choice delivers modest performance gains for test collections without special LSA-friendly structure. These results echo those in the literature. We saw that the performance gains are a result of LSA’s ability to partially overcome the problems of term mismatch between queries and their relevant documents that are endemic in the vector space model. Clearly, further research into both the nature of the term mismatch problem and how LSA handles it is needed. The problem of best rank choice remains open although we have established that the range of 100-300 used in practice and supported by statistical analysis [5] remains an acceptable option. We believe that further research into the connection between rank reduction induced error and retrieval performance will shed more light on this problem. On the question of how to identify relevant documents, we have made more concrete progress. We have established that absolute cosine cutoffs are unlikely to lead to reasonable retrieval performance but that relative cutoffs are a tractable alternative. Again, what cutoff to use is application dependent, but we have made recommendations both for the case where recall is a priority and for the case where precision is the prime concern. Finally, we wanted to learn if other matrix decompositions could be applied in place of the SVD. We demonstrated that document retrieval methods based on the QR and ULV decompositions provide competitive performance to the standard SVD-based LSA method. Determination of the true value of these alternatives awaits a careful complexity analysis.
i
i i
i
i
i
i
“outline” 2005/5/2 page 23 i
Bibliography ˇ, and E. Jessup, Matrices, vector spaces, and infor[1] M. Berry, Z. Drmac mation retrieval, SIAM Review, 41 (1999), pp. 335–362. [2] M. Berry, S. Dumais, and G. O’Brien, Using linear algebra for intelligent information retrieval, SIAM Review, 37 (1995), pp. 573–595. [3] M. Berry and R. Fierro, Low-rank orthogonal decompositions for information retrieval applications, Numerical Linear Algebra With Applications, 3 (1996), pp. 301–328. [4] S. Deerwester, S. Dumais, G. Furnas, T. Landauer, and R. Harshman, Indexing by latent semantic analysis, Journal of the American Society for Information Science, 41 (1990), pp. 391–407. [5] C. H. Q. Ding, A similarity-based model for latent semantic indexing, in Proceedings of 22nd International Conference on Research and Development in Information Retrieval, Berkeley, CA, 1999, SIGIR. [6] S. Dumais, Improving the retrieval of information from external sources, Behavior Research Methods, Instruments, & Computers, 23 (1991), pp. 229–236. [7]
, LSI meets TREC: A status report., in The First Text REtrieval Conference, D. Harman, ed., National Institute of Standards and Technology Special Publication 500-207, March 1993, pp. 137–152.
[8]
, Latent semantic indexing (LSI) and TREC-2, in The Second Text REtrieval Conference, D. Harman, ed., National Institute of Standards and Technology Special Publication 500-215, March 1994, pp. 105–116.
[9]
, Latent semantic indexing (LSI): TREC-3 report, in The Third Text REtrieval Conference, D. Harman, ed., National Institute of Standards and Technology Special Publication 500-226, March 1994, pp. 219–230.
[10] S. Dumais, G. Furnas, T. Landauer, S. Deerwester, and R. Harshman, Using latent semantic analysis to improve access to textual information, in CHI ’88, ACM, 1988, pp. 281–285. [11] C. Eckart and G. Young, The approximation of one matrix by another lower rank, Psychometrika, 1 (1936), pp. 211–218. 23
i
i i
i
i
i
i
24
“outline” 2005/5/2 page 24 i
Bibliography
[12] G. Furnas, T. Landauer, L. Gomez, and S. Dumais, The vocabulary problem in human-system communication, Communications of the ACM, 30 (1987), pp. 964–971. [13] D. Harman, Overview of the Third Text REtrieval Conference (TREC-3), in Overview of the Third Text REtrieval Conference, D. Harman, ed., National Institute of Standards and Technology Special Publication 500-226, April 1995, pp. 1–21. [14] D. Jurafsky and J. H. Martin, Speech and Language Processing: An Introduction to Natural Language Processing, Computational Linguistics and Speech Recognition, Prentice Hall, Upper Saddle River, New Jersey, 2000. [15] T. Landauer. personal communication. [16] T. Landauer, P. Foltz, and D. Laham, Introduction to latent semantic analysis, Discourse Processes, 25 (1998), pp. 259–284. [17] T. Letsche and M. Berry, Large-scale information retrieval with latent semantic indexing, Information Sciences, 100 (1997), pp. 105–137. [18] K. Lochbaum and L. Streeter, Comparing and combing the effectiveness of latent semantic indexing and the ordinary vector space model for information retrieval, Information Processing and Management, 25 (1989), pp. 665–675. [19] Medline, ftp://ftp.cs.cornell.edu/pub/smart/med/. May 27, 1998. [20] L. Mirsky, Symmetric gauge functions and unitarily invariant norms, The Quarterly Journal of Mathematics, 11 (1960), pp. 50–59. [21] G. O’Brien, Information management tools for updating an SVD-encoded indexing scheme, Master’s thesis, University of Tennessee, Knoxville, TN, 1994. [22] W. Shaw, J. Wood, R. Wood, and H. Tibbo, The cystic fibrosis collection: Content and research opportunities, Library and Information Science Research, 13 (1991), pp. 347–366. [23] H. Simon and H. Zha, On updating problems in latent semantic indexing, SIAM Journal on Scientific Computing, 21 (1999), pp. 782–791. [24] Telcordia latent semantic indexing software (LSI): Beyond keyword retrieval. http://lsi.research.telcordia.com/lsi/papers/execsum.html, December 5, 2000. [25] Time, ftp://ftp.cs.cornell.edu/pub/smart/time/. December 5, 2001.
i
i i
i