International Journal of Marketing Studies; Vol. 7, No. 1; 2015 ISSN 1918-719X E-ISSN 1918-7203 Published by Canadian Center of Science and Education
Taking or Not Taking a Class: Students’ Perceived Physiognomies Associated with Syllabi Reza Motameni1, William Rice1 & Patricia LaRosa1 1
Craig School of Business, California State University, Fresno, USA
Correspondence: Reza Motameni, Craig School of Business, California State University, 5245 North Backer Avenue M/S PB7, Fresno, California 93740-8001, USA. Tel: 1-559-278-2750. E-mail:
[email protected] Received: November 19, 2014 doi:10.5539/ijms.v7n1p78
Accepted: December 22, 2014
Online Published: January 26, 2015
URL: http://dx.doi.org/10.5539/ijms.v7n1p78
Abstract This paper has tried to reconcile and synthesize the existing literature on course syllabi and create an interconnected and cohesive conceptual framework capable of bringing together the findings of previous conceptualization. The spin-off objectives involved conducting a survey to establish the students’ overall perceptions regarding the course syllabi in general and the most recent syllabi they have been exposed to in particular. More importantly, we wanted to find out if the students’ current perceptions were significantly different from an ideal syllabus perception and whether students’ gender, ethnicity, academic standing, option, time of class, and class structure (i.e., regular vs. totally online) influenced students’ perception of a syllabus. This study identified four factors contributing to an ideal syllabus. This study extended the previous research on syllabi because no other study has focused on syllabus format and its visual presentation. The findings suggest that alternative strategies should be used to communicate syllabus information. Keywords: syllabus, ideal syllabus, syllabus presentation format 1. Introduction What is meant by a “syllabus” varies considerably among educators. A consensus can conventionally be established, vis-à-vis the definition of “syllabus” and its commencement, by referring to well-known and authoritative dictionaries, including the Oxford English Dictionary, American Heritage Dictionary of the English Language, and Merriam-Webster Dictionary. The primary definitionof “syllabus” by such dictionaries refer to “An outline or a summary of the main points of a text, lecture, or course of study”, and the origination of the “syllabus” as a word has been referred to as a medieval alteration of the Latin word “sillybus”, meaning a label for a book. In academic context, the concept of the “syllabus” has been comprehended in numerous ways, and its prescribed usefulness and roles are explained as: a gold mine of information from which material can be extracted for a study guide and other applications. (Sayles, 1985).
an introduction to both the course and the instructor (Baecker, 1998).
minimizing student misunderstandings about expectations for the class(Royse, 2001; Dominiowski, 2002).
a contract, a permanent record, and a learning tool(Parkes & Harris, 2002).
the mindset of a professor’s philosophy of teaching and learning (Weimer, 2002).
playing three diverse roles of motivational, structural, and evidentiary (Slattery &Carlson 2005).
a facilitator of student learning (Cullen &Harris, 2009; Borus, 1994).
a communication tool to manage the tension that exists between being caring while simultaneously establishing authority and the rigor of the course (Thompson, 2007). setting the stage &Fynewever,2011).
for
effective
use
of
assessment-for-learning
principles
(Ludwig,
Bentz,
a communication mechanism, a planning tool for instructors, a course plan for students, a teaching tool or resource, an artifact for teacher evaluation, and evidence for accreditation (Fink, 2012).
78
www.ccsenet.org/ijms
International Journal of Marketing Studies
Vol. 7, No. 1; 2015
a tool to (re)socialize students for success in the college setting by establishing student-teacher roles and norms and setting the tone for classroom interactions (Sulik&Keys, 2013). The above conceptualizations that prescribethe practicality and roles of a syllabus are beneficial and constructive. Nevertheless, standing alone, they represent a set of disjointed and dispersed proclamations. We believe that there is a need to reconcile and synthesize the existing conceptualizations, findings, and outcomes in order to create an interconnected and cohesive conceptual framework capable of bringing together the findings of previous studies and guiding future research. 2. The Objectives of This Study A.
The primary objective of this article is to synthesize the noteworthy previous studies, and based on that, to
propose an integrated and unifying conceptual framework, capable of speculatively explaining students’ decision to take or drop a class based on syllabus content and presentation. B. Utilizing the proposed conceptual framework to present and discuss our survey findings, the spin-off objectives of the survey were: 1. To establish the students’ overall perception regarding the course syllabus in general and the most recent syllabi they have been exposed to in particular. 2.
Todiscover the characteristics that students associate with an ideal syllabus.
3.
To measure students’ perception of the ideal format for presenting daily/weekly class assignments and
activities specified in the syllabus. 4. To determine which factors students consider most important when deciding whether to stay in a course or drop it onthe first day of class. 5. To find out whether the overall perception of students regarding the most recent syllabi issignificantly different than an ideal syllabus perception. 6.
Todetermine if students’ perception of a syllabus depends on their gender, ethnicity, academic standing,
option, time of class, and class structure (i.e., regular or totally online). 7.
Tofind out the statistically significant factors directly associated with the perception of an ideal syllabus.
3. Literature Review 3.1 The Conceptual and Prescribing Articles Smith and Razzouk (1993) have pointed out that a syllabus is a useful permanent public record of what was taught in a course and can serve a variety of roles such as assisting the accreditation assessment requirements, tenure review, and credit transfers. Matejka and Kurke (1994) have maintained that “A syllabus serves as a contract between student and instructor, and subsequently it should include the instructor's plan of action for the course, the course's general purpose, and the instructor's orientation to the content”.Beaudry and Schaub (1998) developed guidelines for developing a learner-centered syllabus, suggesting the inclusion of instructional goals and performance objectives. Parkes and Harris (2002) analyzed more than two hundred course syllabi from eleven colleges in a single university; based upon their investigation, they listed a number of important elements that should be included in a syllabus including: “instructor contact information, course objectives, grading policies, textbook information, attendance rules, assignment policies, and descriptions of assessment policies”. Diamond (1998), Dominowski (2002), and Grunert (1997) have endorsed inclusion of similar elements in a syllabus. Brosman (1998) dated the contractual aspect of the syllabus to the 1970s, when students first began to challenge expectations that were not described in course syllabi. Slattery and Carlson (2005) proposed a set of three diverse roles of a syllabus as “motivational (e.g., excellence should be encouraged by setting achievable goals), structural (e.g., specifying the methods to assess and/or evaluate student achievement of these goals), and evidentiary (e.g., syllabus serves as a contract between faculty and students)”. As Cunninghamand Omolayole(1998) have pointed out “The American Assembly of Collegiate Schools of Business (AACSB) is interested, among other things, in seeing evidence of continuing improvement in the program offered, through program assessments”. Black, Harrison, Lee, Marshall, and William (2004) advocated that “Assessment information can provide powerful feedback that the student can use to improve or confirm his or her understanding of the related topics. Naturally the analysis of syllabi contents can be very advantageous in that process”. Cunningham and Omolayole (1998) proclaimed that “the foundation of program assessment lies in the development of an assessment-oriented syllabus model for the courses offered in the 79
www.ccsenet.org/ijms
International Journal of Marketing Studies
Vol. 7, No. 1; 2015
program. Each course syllabus should include learning outcomes from which the degree program assessment tools should be developed”. Black, et al., (2004) also proposed “Assessment for Learning (AFL)”conceptual framework. In their viewpoint AFL is “any assessment that provides information to be used as feedback by teachers and by their students in assessing themselves and each other, to modify the teaching and learning activities”. They suggested that core principles of AFL can be summarized into the three actions: “communicating clearly defined and measureable learning objectives prior to instruction”, “providing usable feedback to the student to ensure prompt guidance”, and “using feedback to improve teaching and learning”. Ludwig, Bentz, and Fynewever (2011) suggested that the syllabus can set the stage for all three AFL actions by explicitly describing each one of them. Halbesleben, Becker, and Buckley (2003), and Shelley (2005) promoted the idea that students are indeed customers and the instructors should determine what their customers want and need when using a syllabus. In “Death to the Syllabus”, Singham (2007) described the syllabus as “an overtly oppressive instrument designed to manage students”. He also indicated that “most syllabi have a tone more akin to the first day of incarceration than of learning”. He declared war on the traditional course syllabus, which is a rule-infested, punitive, controlling mechanism handed out to students on the first day of class. Cullen and Harris (2009) elaborated on the role of a course syllabus as a facilitator of student learning. They asserted that: “One attempt to revitalize undergraduate education has been by shifting the dominant pedagogy to a learner‐centered focus and supporting an emphasis on the scholarship of teaching and learning”; they offered a system of evaluating the degree of learner‐centeredness in current teaching practices through a systematic review of course syllabi. Doolittle and Siudzinski (2010) also critically examined and evaluated the contents of 1,000 syllabi and concluded that “Overall, faculty tended to include more professor information, course information, and grading information than policy information”. 3.2 The Empirical Articles As demonstrated in the previous section, many articles have discussed the overall characteristics of a typical syllabus and what should be included in a syllabus. Nevertheless, empirical studies of syllabus components are generally a less explored area. Smith and Razzouk (1993) did a study to measure the nature and degree of usage of course syllabi by 152 students enrolled in two undergraduate upper-division marketing courses. The survey instrument was composed primarily of open-ended questions that were dependent upon a student's ability to recall specific information from the course syllabus. Becker and Calhoon (1999) conducted a survey of undergraduate students who were asked to view 29 items that are likely to appear on a course syllabus and indicate how much they would attend to each. The four items that were most important to students were: "examination and quiz dates”, “due dates of assignments”, the "reading material covered by each exam or quiz”, and “the grading procedures and policies." Four items were the least important to the students: “the titles and authors of textbooks”, “the drop dates”, the “course information such as course number and title, section number, and credit hours”, and the “academic dishonesty policy." Garavalia, Hummel, Wiley, and Huitt (1999) compared survey responses of undergraduate students and faculty. The results of the study indicated that students and faculty members differed in the amount of importance assigned to 15 suggested syllabus components. Items students and faculty disagreed upon include: "examples of completed projects/papers”, the "basic format of examinations", and the "length of required projects/papers". Examples of items that faculty members and students rated similarly in importance were: “the instructor's e-mail address", "the grading scale for final course grade", and "the syllabus adjustments periodically throughout the semester." Dewald (2003) undertook a study to learn how much library use or research was expected of students by business faculty. From the study of business syllabi, the author was able to develop strategies for outreach and improving service to the students and faculty in the business administration program. According to Williams, Cody, and Parnell (2004) “the key to embedding the library into the student experience is to be an integral part of the course work.The most detailed evidence of what that coursework entails is the syllabus”. Smith, Doversberger, Jones, Ladwig, Parker, and Pietraszewski (2012) conducted a syllabus study to identify those courses which might benefit from library instruction that are not currently utilizing these services. They concluded that examining course syllabi is a useful method for uncovering opportunities for instruction and outreach is valuable. Herbeck and Lockhart (2004) conducted a survey of 129 undergraduate students that asked them to rate the importance of 15 potential components of syllabi and the occurrence of these elements in their course syllabi. The high priority syllabus components for students included: “instructor contact information, assignments, 80
www.ccsenet.org/ijms
International Journal of Marketing Studies
Vol. 7, No. 1; 2015
required text/reading materials, assessment procedures, and grading scale”; the moderate priority syllabus components for students included: “course content, attendance policy, objectives of the course, and late assignment policy”. The low priority syllabus components for students included: “citation style for papers, incomplete work policy, make-up policy, accommodation of disabilities, academic dishonesty policy, and in-class behavior expectations”. Keller, Marcis and Deck (2008) have also assessed the relative importance students place on different items that frequently appear on a course syllabus. The findings indicated that students do not attach the same amount of importance to all syllabus components and that the level of perceived importance varies by demographic factors. 3.3 Synthesizing the Literature The above literature review revealed:
A syllabus should have capabilities or functionalities that assist students, instructors, and administrators in
their respective learning, teaching, and administrative processes.
The contents that should be included in a typical syllabus.
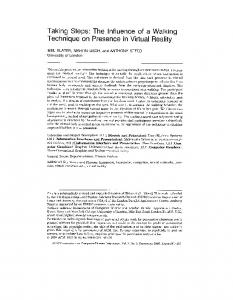
A Google Scholar search surprisingly indicated that Babad, Icekson, and Yelinek (2008)conducted the only study focusing on how students make a decision to take or drop a course based on syllabus content. The authors investigated antecedents and correlates of course cancellationduring the add/drop period, the first 2–3 weeks of each term. The characteristics of the syllabi distributed in the first class session were investigated as predictors of course cancellation. Rates of cancellation were significantly predicted from syllabus workload difficulty. They concluded that the more the instructor presented high demands in terms of tasks, readings, and assignments, the greater the chance that a larger proportion of students would drop out of the elective course. One more study has also implicitly and succinctly mentioned that new information technologies should be used topresent the syllabus content more effectively(Behnke & Miller 1989), but no study has actually measured students’ perception regarding the visually appealing features of a syllabus; doing so was one of the objectives of this study. Figure 1 visually presents the findings of the literature review and interrelationships among previous studiesand the gap that exists in the literature (e.g., scarcely any research had been done on taking or not taking a class based on syllabus content, and no research has been done measuring the preferredpresentation method of a syllabus from the students’ viewpoint). Only Behnke and Miller (1989) suggested that the most recent technological advances can be used to build a useful and user-friendly course syllabus. 4. The Proposed Conceptual Framework
Figure 1. The interrelationship among previous studies 81
www.ccsenet.org/ijms
International Journal of Marketing Studies
Vol. 7, No. 1; 2015
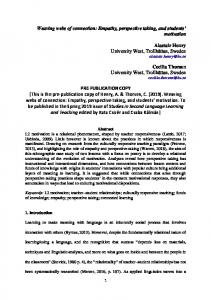
Based on the outcomes of the above literature review and utilizing the findings of previous conceptual and empirical findings delineated in Figure 1, we propose an integrated conceptual framework depicted in Figure 2, which is capable of speculatively explaining students’ decision to take or drop a class based on syllabus contentand functionalities, moderated by students’ academic standing, option, gender, and ethnicity. The proposed conceptual framework was used as a guideline to conduct a survey and to attain the spin-off objectives of this study specified on page 2 and to confirm the practicality of our proposed conceptual framework.
Figure 2. The proposed conceptual framework 5. Research Methodology The information for this study was gathered from 307 undergraduate students enrolled in ten sections of a required principles of marketing course (266 students) and one section of an upper-level writing course (41 students, pre-requisite to the required marketing course) at a major western state university. The survey consisted of LikertScalesand open-ended questions.Questions 1-3 (with eight statements for each question) asked students to express their overall opinion regarding “course syllabi in general”, “the most recent syllabi they have received in their classes”, and “what would be the best or an ideal syllabus from their perspective”. Students selected from the following answers: 1 = strongly agree, 2= agree, 3= neither agree nor disagree, 4= disagree, and 5= strongly disagree. Question 4 showed students one section of a syllabus presented in four different ways and asked them to answer seven questions such as “which example is appealing to you?”, “which example is easiest to look at?”,etc. Question 5asked them “On the first day of class when you may be deciding whether to stay in a course or drop it, which of the following seven factors do you consider important”. Studentsselected from the following answers: 1 =very important factor, 2= important factor, 3= neutralfactor, 4= unimportantfactor,and 5= very unimportant factor. Other questions included in the survey were: “How many courses have you taken in which there was no syllabus?”, “Of the syllabi you have received in the last year, what percent would you rate as Excellent?”, “Of the syllabi you have received in the last year, what percent would you rate as Very Poor?”. Finally, questions were asked about the respondents’ gender, ethnicity, academic standing, and option, and whether they have taken an online or offline section of the course.Out of 307 respondents, 77% were taking classes during the day and 23% in the evening; 85% were taking regular sectionsand 15% were taking two totally online sections of the marketing course. 6. Findings and Discussion This section of the paper reports the major findings revealed from our survey. The “Preliminary Findings” concentrate on Objectives 1-4, the “t-tests” spotlightObjective 5, the “Analysis of Variance (ANOVA)” focuses on Objective 6, and the “Factor Analysis” addresses Objective 7. 6.1 Preliminary Findings (Related to Objectives 1-4) The first question in the questionnaire (parts a-h; please refer to Table 1 and Appendix A) aimed at measuring the students’ overall opinion regarding course syllabi. The major findings indicated:
The course syllabus should cover all major activities involved in a course.
The syllabus should be easy to read and understand.
The style or layout of the syllabus is an indicator of the type of personality or demeanor of the instructor.
The second question (parts a-h, please refer to Table 1, and Appendix A) measured the respondents’ perception of the most recent syllabi they have received in their classes. The major findings indicated:
Students prefer to keep the syllabus with them in class.
Students usually copy important information from the syllabus to their calendar or day planner.
82
www.ccsenet.org/ijms
International Journal of Marketing Studies
Vol. 7, No. 1; 2015
The third question in the questionnaire (parts a-h; please refer to Table 1 and Appendix A) aimed at measuring students’ perception of the best or ideal syllabus. The four highest rated items students felt should be included in a syllabus were:
Key deadlines in boldface type.
Correct grammar, spelling, and punctuation.
The instructor’s expectations for student participation.
Daily course work described in a table instead of in paragraphs.
Question 4 aimed at measuring the students’ perception of preferred layout style of a syllabus. Students were presented with four different formats and visual styles. Each example covered the same material and measured students’ preferences (Please refer to Table 1and Appendix A). Most students have seen a variety of syllabus types that fit somewhere in the spectrum of “straight text” to “high use of tables and visual displays”. Example 4 was seen as:
The “easiest to glance at before the week (or day) starts to understand class preparation expectations”.
“Most visually appealing”.
“Best explains the requirements of the course”.
The most difficult to understand or comprehend quickly was Example1. Students also felt that Example 1 was one of the easiest for an instructor to create. The more visually separated and accentuated a syllabus is the more students see it as most usable. They want a syllabus that is more visual than textual and more structured with separations than with block text. Question 5 (please refer to Table 1 and Appendix A)aimed at measuring the factors students considered importantwhen deciding to stay in a course or drop it on the first day of class.There is a debate as to why students stay in a course they signed up for. In this study the top four reasons students stay were:
“Day and time of the class”.
“Instructor’s reputation”.
“Input from friends and classmates”.
“Instructor’s demeanor during the first class”.
The least important factor was “the syllabus length”. It seems that the primary reasons for staying in a course are convenience and emotional fit. Students want to optimize their use of time and ensure that the environment fits their psychological capacity and their ability to deal with unknowns and expected pressures. The answers to question 6 indicated that only one percent of students have taken a course in which there was no syllabi. Questions 7 and 8 asked students to assign a percentage to the number of syllabi they had received in the last year that were either Excellent or Very Poor. The students’ response was that fifty percent of the time they had seen an “excellent” syllabus. They also stated they had seen a “very poor” syllabus about thirteen percent of the time. The full results of the preliminary findings are presented in Table 1. Table 1. The descriptive statistics Q1. Please share with us your overall opinion regarding the course syllabi. Strongly Agree % a) The course syllabus should cover all major 85 activities involved in a course. b) The syllabus should be easy to read and 85.3 understand. c) The length/size of the syllabus is usually a 12.4 measure of the difficulty of a class. d) The style or layout of the syllabus is an indicator 15.3 of the type of personality or demeanor of the instructor. e) I have decided to take or not to take a class based 5.5 solely on the syllabus.
83
Disagree %
13
Neither Agree nor Disagree% 1.3
.3
Strongly Disagree % .3
12.4
1
1
.3
18.6
31.6
28.3
9.1
38.1
24.4
16
6.2
17.9
17.6
29.3
29.6
Agree %
www.ccsenet.org/ijms
International Journal of Marketing Studies
Vol. 7, No. 1; 2015
f) I have complained openly in class or privately to 4.2 11.7 16 37.5 30.6 the instructor about a course syllabus. g) I have judged how beneficial a class may be by 9.1 37.1 24.8 19.5 9.4 looking at the syllabus. h) I feel that a syllabus is a picture of the potential 14.3 48.5 22.5 10.7 3.9 benefits of a class. Q2. Thinking about the most recent syllabi you have received in your classes, please indicate your level of agreement or disagreement with the following statements. a) The typical syllabus is too long to truly 10.4 23.8 25.7 34.2 5.9 understand. b) The typical syllabus is confusing and lacks 4.9 19.9 26.1 44 5.2 continuity. c) The typical syllabus is NOT visually appealing or 11.1 30 27 27.4 4.6 user friendly. d) The typical syllabus is like reading a good road 8.1 40.4 30.9 16.3 4.2 map. e) I usually have to add explanations to parts of my 11.1 32.9 20.8 31.9 3.3 syllabus. f) I usually read my syllabus only a few times during 8.1 36.2 15.6 33.9 6.2 the course. g) I usually keep my course syllabus with me in 39.1 46.9 5.9 5.5 2.3 class. h) I usually copy important information from the 39.1 33.2 11.7 8.5 7.2 syllabus to my calendar or day planner. Q3. What would the best syllabus for you look like? Please answer the following questions by indicating your level of agreement or disagreement. a) It should have good use of white or open space to 26.4 49.8 17.6 4.9 1.3 separate key areas. b) Daily course work should be described in a table 44.6 39.4 9.4 5.5 .7 instead of in paragraphs. c) Key deadlines should be indicated in boldface 62.9 32.6 2.9 1 1.3 type. d) It should have a personal touch such as graphics or 9.1 15.3 53.1 14.3 8.1 cartoons. e) It should explain the possibilities for earning extra 52.8 35.8 8.5 2 1 points and also outline the grading criteria. f) It should include the instructor’s philosophy of 23.5 35.5 30.9 6.2 3.9 teaching. g) It should include the instructor’s expectations for 34.9 52.4 10.1 1.6 1 student participation. h) It should contain correct grammar, spelling, and 55.7 33.2 6.8 3.3 1 punctuation. Q4. Shown at the bottom of this page is one section of a syllabus presented in 4 different ways. Use the 4 examples to respond to the following questions. Example 1 % Example 2 % Example 3 % Example 4 % a) Which of the four examples is the most visually 5.2 2.9 14 77.9 appealing to you? b) Which example is the most difficult for you to 86.6 2.9 2.6 7.8 understand or comprehend quickly? c) Which example is easiest to look at before your 3.9 2.3 12.7 81.1 week (or day) starts in order to understand what you must do to prepare for class? d) Which example is closest to the typical syllabus 6.8 18.2 34.5 40.4 you receive? e) Which example do you think is the easiest for an 24.8 15.3 16 43.3 instructor to create? f) Which example best explains the requirements of 18.2 11.1 22.5 47.6 the course? Example 1 =12.76%, Example 2 = 18.14%, Example 3 =30%, g) Of the syllabi you have received in last year, what Example 4 =39.1? percent of them looked like Example 1, Example 2, Example 3, and Example 4?
84
www.ccsenet.org/ijms
International Journal of Marketing Studies
Vol. 7, No. 1; 2015
Q5.On the first day of class when you may be deciding whether to stay in a course or drop it, which of the following factors do you consider important? Very Important Neutral Unimportant Very Important Factor Factor Factor Unimportant Factor Factor a) Course catalog description 20.8 34.5 28.3 11.4 4.6 b) Input from friends and classmates 39.5 37.9 15.7 5.2 1.6 c) Instructor’s demeanor during the first class 35.2 43 16 3.9 2 d) Syllabus length 4.2 22.1 45.3 19.2 9.1 e) Day and time of the class 48.9 35.5 11.7 2.9 1 f) Workload presented in the syllabus 35.8 39.1 18.2 4.6 2 g) Instructor’s reputation 43 38.1 13.7 2.6 1.3 Q6. How many courses have you taken in which 1% there was no syllabus? Q7.Of the syllabi you have received in the last year, 50% what percent would you rate as EXCELLENT? Q8. Of the syllabi you have received in the last year, 12.88% what percent would you rate as VERY POOR?
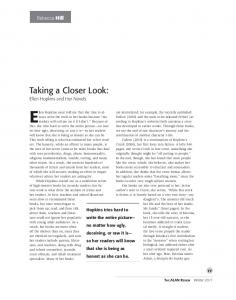
6.2 T-Test (Related to Objective 5) To find out whether the students’ overall perception regarding the most recent syllabi is different from an ideal syllabus, an overall perception score toward the Most Recent Syllabi (MRS), and an Ideal Syllabus (IS) was calculated by adding the students’ responses to Question 2 (parts a-h) and Question 3 (parts a-h), respectively. The students’ perceptions were measured by their answers to Questions 2 and 3 using Likert Scale types of questions, with minimum scale value of 1 and maximum scale value of 5 (1= strongly agree and 5=strongly disagree). In the calculation of overall scores, 8 variables were used; therefore, the possible total minimum score will be 8, and the possible total maximum score will be 40. In this continuum any value below 24 indicates that students hold a positive overall perception, and any average score above 24 indicates students had a negative perception. Refer to Figure 3.
Figure 3. Overall average perception scores continuum Figure 3 indicates that overall, students formed a positive attitude toward the Most Recent Syllabi (MRS) they had been exposed to, andthey hadcorrespondingly formed a positive pre-disposition toward an Ideal Syllabus (IS). This finding is not surprising because in our university, a policy and a mandatory template exist for facultyto follow when preparing their syllabi, making certain that they meet the minimum university requirements. The template actually embraces all prescribed components supported in the literature review section of this paper. Although both MRS and IS scores indicated positive perceptions, it seems nonetheless that a significant gap exists between them.In fact,a t-test for equality of two average scores was rejected (t= -8.212, d.f =290, Sig. 2-tailed = 0.00), so we concluded that there was a statistically significant difference between students’ perception of the most recent syllabi and their perception of an ideal syllabus. 6.3 Analysis of Variance (ANOVA, Related to Objective 6) One of the objectives of the study was to determine if respondents’ gender, ethnicity, academic standing, option,time of taking a class, and taking a regular or a totally online classinfluenced their perceptionofthe most recent syllabi or an ideal syllabus. To answer theabove questions, a series of Analysis of Variance (ANOVA) wasperformed with overall perception scores toward the “Most Recent Syllabi (MRS)” and “Ideal Syllabus (IS)” as dependent variables, and thegender, ethnicity, academic standing, option,the time of taking a class, and taking a regular or a totally online class as grouping variables. The results of ANOVA are presented in Table 2
85
www.ccsenet.org/ijms
International Journal of Marketing Studies
Vol. 7, No. 1; 2015
Table 2. Analysis of Variance (ANOVA) Was the overall perception of an ideal syllabus affected by respondents’:
F
d.f
Sig.
Conclusion
gender? ethnicity? academic standing? option? taking a day versus an evening class? taking an online versus an offline class?
.740 1.046 1.002 .639 .926
1 5 4 10 1
.390 .391 .407 .78 .337
No No No No No
10.61
1
.001
Yes
Was the overall perception of the most recent syllabus affected by respondents’: gender? ethnicity? academic standing? option? taking a day versus an evening class? taking an online versus an offline class?
F
d.f
Sig.
Conclusion
.199 1.015 1.338 1.543 .395
1 5 4 10 1
.656 .409 .256 .124 .530
No No No No No
9.278
1
.003
Yes
The resultsindicated that the overall perception of “MRS” and “IS” was independent of the respondents’ gender, ethnicity, academic standing, option, time of taking a class. However, their perceptions regarding “MRS” and “IS” were significantly different if they had taken a totally online class. 6.4 Factor Analysis (Related to Objective 7) Since the above mentioned t–testindicated a statistically significant difference between “MRS” and “IS” perceptions, a succession of Factor Analysis wasperformed, which is discussed in this section of the paper; the results of factor analysisare presented in Table 3. Table 3. The overall factor analysis
Teaching Philosophy
Length of the Syllabus
Planner Basis
Daily Schedule Specification
Consequential Information Exclusion
Syllabus UserFriendliness
Course Usefulness
Taking / Dropping a Class Based on Syllabus
Course Rigor
Syllabus Comprehensiveness
Questions
Factors
Q1a
0.771
0.121
-0.024
0.029
-0.022
0.018
0.038
0.026
0.075
0.079
Q1b
0.788
-0.024
-0.062
0.059
-0.006
-0.073
0.156
0.053
-0.056
-0.015
Q1c
0.051
0.753
0.168
-0.018
-0.011
-0.05
0.11
-0.021
-0.004
-0.029
Q3e
0.111
0.645
-0.052
-0.03
0.153
0.081
-0.201
0.094
0.284
0.166
Q1e
0.091
0.074
0.732
0.143
0.072
0.016
-0.14
0.092
-0.031
-0.023
Q1f
-0.191
0.043
0.698
0.014
0.109
0.085
0.151
-0.169
-0.073
-0.02
Q1g
-0.037
-0.035
0.307
0.750
0.165
-0.023
-0.017
0.012
0.066
0.022
Q1h
0.122
-0.064
-0.057
0.722
0.081
-0.091
-0.071
0.146
-0.062
0.169
Q2a
0.083
0.06
-0.004
0.108
0.836
0.022
0.151
-0.082
-0.107
-0.064
Q2b
-0.08
0.059
0.082
0.119
0.852
0.039
0.064
0.006
-0.026
-0.065
Q2c
-0.024
-0.021
0.185
-0.084
0.708
-0.04
-0.079
-0.002
0.273
0.167
Q2f
0.039
0.051
0.165
-0.038
0.099
0.755
0.143
-0.031
0.173
0.002
Q2g
0.105
-0.105
-0.108
0.096
-0.052
-0.031
0.537
0.416
-0.099
-0.038
Q3b
0.13
0.051
-0.052
-0.138
0.173
0.036
0.699
0.056
0.046
0.143
Q2h
0.046
0.05
-0.018
0.079
-0.076
0.019
0.098
0.854
0.168
-0.021
Q3c
0.048
0.149
-0.055
0.041
0.098
0.063
0.13
0.188
0.774
0.052
Q3g
0.055
0.295
-0.052
0.03
0.005
0.154
-0.053
-0.048
-0.067
0.796
Q3h
0.029
-0.21
0.011
0.133
-0.018
-0.121
0.286
0.044
0.079
0.711
Kaiser-Meyer-Olkin Measure of Sampling Adequacy = 0.683, Approx. Bartlett's Test of Sphericity, Chi-Square =1381.943, d.f=2300, Sig. = 0.000, Total Variance Explained = 64.5%.
86
www.ccsenet.org/ijms
International Journal of Marketing Studies
Vol. 7, No. 1; 2015
In factor analysis the co-variations among the variables are described in terms of a small number of factors. The first factor accounts for the highest variance in the data and the second factor, the second highest, and so on. To begin with, an overall factor analysis was done using the answers to Questions 1-3 in order to reveal the underlying factors behind students’ perception of syllabi (refer to Appendix A to see the wording of the questions in the questionnaire). Ten factors shown in Table 2 were revealed. As it is customary, the examinations of the wording of questions in the questionnaire which have been significantly loaded on corresponding factors were utilized to name the factors. To a greater extent, the identified factors in our study were consistent with the findings in previous studies discussed in Section 3.1 and 3.2 of the literature review. The key statistics associated with factor analysis are Barlett’s test of Sphericityand Kaiser-Meyer-Olkin (KMO) measure. A high value of KMO (between 0.5-1.0) indicates the factor analysis is appropriate (Malhotra, 2004). The value of KMO statistics in our study was relatively large (0.683). The related test statistic is based on a chi-square transformation of the determinant of correlation matrix. Bartlett's Test of Sphericity associated with chi-square test also indicated that the finding is statistically significant. The total variance explained by 10 factors was 64.5%. The preliminary findings discussed in Section 6.1 pointed out that the top four reasons students stay in a class were “day and time of the class”, “instructor’s reputation”, “input from friends and classmates”, and “instructor’s demeanor during the first day of class”. To find out what statistically significant factors played a role in students’ decision to stay in a course or drop it on the first day of class, we performed another factor analysiswith responses to Question 5 of the questionnaire (Please refer to Appendix A). Table 4 presents our findings. Table 4. Factors Underlying Staying or Dropping a Course on the First Day of a Class Factors
Rotation Sums of Squared Loadings
Instructor
Syllabus Length &
Total Variance Explained
Reputation
Workload
Q5b
.777
.027
Factors
Q5c
.531
.312
1
Q5g
.728
.172 2
Q5a
-.131
.540
Q5d
.096
.810
KMO and Bartlett's Test of Sphericity
Q5f
.371
.653
Kaiser-Meyer-Olkin Measure of Sampling Adequacy = .666.
Total
% of Variance
Cumulative %
1.830
26.147
26.147
1.543
22.046
48.193
Approx. Chi-Square = 247.596, d.f.= 21, Sig. =0.000
The findings in Table 4 indicate that the most important factor was the “InstructorsReputation” in conjunction with “Syllabus Length & Workload”, a proxy indication of the difficulty of the course. However, it should be pointed out that total variance explained by these twofactors wasonly 48%, which implies that other factors that existin students’ minds were not considered in our questionnaire. To find out what factors are directly associated with the perception of an ideal syllabus, we performed another factor analysis with questions that directly asked students what should be included in an ideal syllabus. In Table 5 the four factors identified, in terms of their importance, were: “Syllabus Completeness”, “User-Friendly Format”, “Teaching Philosophy & Expectations”, and “Personal Touch”. From this factor analysis, we could deduce that students prefer a comprehensive syllabus that covers the most important course requirements, but not necessarily a lengthy one. We could also conclude that students perceive the syllabus as a fundamental tool for navigating a course. They favor a syllabus with perfect guidelines and apparatus that should effectively capture the connotation and direction for what they should do in the course. A syllabus is also preferred when it is configured in a user-friendly format and with personal touches and particularly when it includes clear explanation of the instructor’s teaching philosophy and expectations. The above findings particularly apply to 87
www.ccsenet.org/ijms
International Journal of Marketing Studies
Vol. 7, No. 1; 2015
totally online courses in which students may never see the instructor in person. Table 5. Factors underlying an ideal syllabus Factors Question
Rotation Sums of Squared Loadings
Syllabus Completeness
UserFriendly Format
Teaching Philosophy & Expectations
Personal Touch
Total Variance Explained
Q1a
0.829
-0.012
0.116
0.095
Factors
Total
% of Variance
Cumulative %
Q1b
0.777
0.211
-0.039
-0.028
1
1.82
18.203
18.203
Q3a
-0.12
0.563
0.277
0.436
2
1.583
15.826
34.029
Q3b
0.136
0.585
0.233
0.005
3
1.511
15.114
49.143
Q3c
0.249
0.518
0.352
-0.192
4
1.377
13.769
62.912
Q3h
0.041
0.726
-0.227
0.009
Q3f
0.032
-0.07
0.786
0.351
Kaiser-Meyer-Olkin Measure of Sampling Adequacy =0.697
Q3g
0.05
0.275
0.740
-0.224
Q3d
0.135
0.033
0.042
0.856
KMO and Bartlett's Test of Sphericity Approx. Chi-Square= 447.68 d.f. = 45, Sig. = 0.000 Extraction Method: Principal Component Analysis.
The second factor indicates that students prefer a visually mapped-out syllabus rather than a textual one. They also like a more structured type of syllabus, separated by segments, rather than one with a long block of text. They also prefer bold print dealing with key issues, instead of lengthy paragraphs of explanation. The more visually separated and accentuated a syllabus, the more students see it as most usable. 7. Conclusion and Future Research Recommendations The primary purpose of this research was to synthesize the noteworthy previous studies, and based on our findings, to propose an integrated and unifying conceptual framework capable of speculatively explaining students’ decision to take or drop a class based on syllabus content. The spin-off objectives of the surveywe conducted were to establish the students’ overall perceptions regarding the course syllabi in general and the most recent syllabi to which they have been exposed. More importantly, we wanted to find out if the students’ current perceptions were significantly different from an ideal syllabus perception. If not, our next step was to discover the underlying characteristics that students associate with an ideal syllabus. Our literature review established that the syllabus has become a more comprehensive document of course content and policies. It also pointed out that the syllabus has evolved, having multiple functions including serving as a contract, a permanent record, an aid for student learning, and finally, an aid to learning and program assessment. We also tried to establish a logically consistent interrelationship among the previous research by proposing a conceptual framework. The results of the study, through performing factor analysis, revealed the most important factors that students perceived in a syllabus in general and in an ideal syllabus in particular. Based on our findings, it became clear that students do not attendequally to all information in a syllabus. Consequently, instructors should put more emphasis on information that students most attendtoand present it in a visually appealing manner such as using different fonts, underlining, or italics. This study extended the previous research on syllabi because no other study has focused on syllabus format and its visual presentation. Our findings suggest that alternative strategies should be used to communicate syllabus information. But there is still a large number of instructors who create syllabi that are easy for them to create but do not optimize the students’ ability to get the most out of the syllabus. Clear guidelines keep misunderstanding, confusion, and disagreements to a minimum level. The amount of confusion, lost hours of effort, and missed opportunities are obvious when a student considers a syllabus very poor in communicating to them course realities. In regards to future research, it should be noted that in our study the factor analysis indicated that the 88
www.ccsenet.org/ijms
International Journal of Marketing Studies
Vol. 7, No. 1; 2015
totalvariance explained by 10 factors in Table 3 was 64.5% and for the Ideal Syllabus shown in Table 5was 62.9%. Both of these percentages indicate that there are other factors that shape students’ perception of a syllabus. Future studies should try to identify those factors. The best strategy is first to conduct focus groups with potential respondents, and based on those findings, develop a more comprehensive questionnaire. We have no doubt that due to the impact of the Internet and its embedded technologies, the new generation of students is processing information differently than the older generation and certainly prefer a visually appealing format and concise, relevant information. In our study we presented a very short textual paragraph in four different formats (refer to Appendix A). Future studies can replicate our study by creating at least one full, comprehensive page of a typical syllabus, in different formats, and then use an online method of delivery capable of showing the various formats entirely. Behnke and Miller (1989), in the same line of reasoning, have suggested that “Recent improvements in instructional theory and practice, coupled with advances intechnology, provide the modern instructor with the necessary tools for improvingcourse information documents. These improvements hold considerable promise for increasing student involvement and interest in a course and for improving the effectiveness of instruction.” Another stream of research should focus on answering similar questions raised in this study in the context of finding what type of syllabus is appropriate for totally online courses. References Babad, E., Icekson, T., & Yelinek, Y. (2008). Antecedents and correlates of course cancellation in a university “drop and add” period. Research in Higher Education, 49(4), 293-316. http://dx.doi.org/10.1007/s11162-007-9082-3 Baecker, D. L. (1998). Uncovering the rhetoric of the syllabus: The case of the missing I. College Teaching, 46(2), 58-62. http://dx.doi.org/10.1080/87567559809596237 Beaudry, M., & Schaub, T. (1998). The learning-centered syllabus. Teaching Professor, 12(3), 5. Becker, A. H., & Calhoon, S. K. (1999). What introductory psychology students attend to on a course syllabus. Teaching of Psychology, 26(1), 6-11. http://dx.doi.org/10.1207/s15328023top2601_1 Behnke, R. R., & Miller, P. (1989). Information in class syllabus may build student interest. Journalism Educator, 44(3), 45-47. http://dx.doi.org/10.1177/107769588904400308 Black, P., Harrison, C., Lee, C., Marshall, B., & Wiliam, D. (2004). Working inside the black box: assessment for learning in the classroom. Phi Delta Kappan, 86, 9-21. http://dx.doi.org/10.1177/003172170408600105 Borus, E. Z. (1994). A student role in syllabus planning. Exercise-Exchange, 39(2), 10-11. Brosman, C. S. (1998). The case for (and against) departmental syllabi. Academic Questions, 11(4), 58-65. http://dx.doi.org/10.1007/s12129-998-1060-5 Cullen, R., & Harris, M. (2009). Assessing learner‐centeredness through course syllabi. Assessment & Evaluation in Higher Education, 34(1), 115-125. http://dx.doi.org/10.1080/02602930801956018 Cunningham, B., & Omolayole, O. (1998). An assessment-oriented syllabus model for business courses. The Journal of Education for Business, 73(4), 234-240. http://dx.doi.org/10.1080/08832329809601637 Dewald, N. H. (2003). Anticipating library use by business students: The uses of a syllabus study. Research strategies, 19(1), 33-45. Diamond, R. M. (1998). Designing and assessingcourses and curricula: a practicalguide (2nd ed.). San Francisco: Jossey-Bass. Dominowski, R. (2002). Teaching Undergraduates. Mahwah, N.J.: Lawrence Erlbaum Associates. Doolittle, P. E., & Siudzinski, R. A. (2010). Recommended syllabus components: what do higher education faculty include in their syllabi? Journal on Excellence in College Teaching, 21(3), 29-61. Fink, S. B. (2012). The many purposes of course syllabi: which are essential and useful? Syllabus, 1(1). Garavalia, L. S., Hummel, J. H., Wiley, L. P., & Huitt, W. H. (1999). Constructing the course syllabus: faculty and student perceptions of important syllabus components. Journal on Excellence in College Teaching, 10(1), 5-21. Grunert, J. (1997). The course syllabus: A learning- centered approach. Bolton, MA: Anker Publishing Co, Inc. Habanek, D. V. (2005). An examination of the integrity of the syllabus. College Teaching, 53(2), 62-64. http://dx.doi.org/10.3200/CTCH.53.2.62-64 Halbesleben, J. R. B., Becker, J. A. H., & Buckley, M. R. (2003). Considering the labor contributions of students: 89
www.ccsenet.org/ijms
International Journal of Marketing Studies
Vol. 7, No. 1; 2015
an alternative to the student-as-customer metaphor. Journal of Education for Business, 12(May/June), 255-257. http://dx.doi.org/10.1080/08832320309598610 Herbeck, J., & Lockhart, M. (2004). Syllabi for today's college classes. Academic Exchange Quarterly, 8(2), 45-49. Keller Jr, C. E., Marcis, J. G., & Deck, A. B. (2008). Demographic factors and student preferences on the syllabus in the principles of accounting course. Academy of Educational Leadership Journal, 12(2), 11-34. Ludwig, M. A., Bentz, A. E., & Fynewever, H. (2011). Your syllabus should set the stage for assessment for learning. Journal of College Science Teaching, 40(4), 20-23. Malhotra, N. K. (2004). Marketing Research, an Applied Orientation. Pearson Prentice Hall. Matejka, K., & Kurke, L. B. (1994). Designing a great syllabus. College Teaching, 42(3), 115-117. http://dx.doi.org/10.1080/87567555.1994.9926838 Parkes, J., & Harris, M. B. (2002). The purposes of a syllabus. College Teaching, 50(2), 55-61. http://dx.doi.org/10.1080/87567550209595875 Royse, D. D. (2001). Teaching tips for college and university instructors: A practical guide. Allyn & Bacon. Sayles, J. W. (1985). Course information analysis: Foundation for creative library support. Journal of Academic Librarianship, 10(6), 343-345. Shelley, P. H. (2005). Colleges need to give students intensive care. The Chronicle of Higher Education, 51(18), B 16. Singham, M. (2007). Death to the syllabus. Liberal Education, 93(4), 52-56. Slattery, J. M., & Carlson, J. F. (2005). Preparing an effective syllabus: Current best practices. College Teaching, 53(4), 159-164. http://dx.doi.org/10.3200/CTCH.53.4.159-164 Smith, C., Doversberger, L., Jones, S., Ladwig, P., Parker, J., & Pietraszewski, B. (2012). Using course syllabi to uncover opportunities for curriculum-integrated instruction. Reference & User Services Quarterly, 51(3), 263-271. http://dx.doi.org/10.5860/rusq.51n3.263 Smith, M. F., & Razzouk, N. Y. (1993). Improving classroom communication: The case of thesyllabus. Journal of Education for Business, 68, 215-221. http://dx.doi.org/10.1080/08832323.1993.10117616 Sulik, G., & Keys, J. (2013). Many students really do not yet know how to behave! The syllabus as a tool for socialization. Teaching Sociology, 151-160. Thompson, B. (2007). The syllabus as a communication document: Constructing andpresenting the syllabus. Communication Education, 56(1), 54-71. Weimer, M. (2002). Learner-centered teaching: Five key changes to practice. San Francisco: Jossey-Bass/Wiley. Williams, L. M., Cody, S. A., &Parnell, J. (2004). Prospecting for new collaborations: Mining syllabi for library service opportunities. Journal of Academic Librarianship, 30(4), 270-275. http://dx.doi.org/10.1016/j.acalib.2004.04.009 Appendix A Questionnaire 1. Please share with us your overall opinion regarding course syllabi. a) The course syllabus should cover all major activities involved in a course. b) The syllabus should be easy to read and understand. c) The length/size of the syllabus is usually a measure of the difficulty of a class. d) The style or layout of the syllabus is an indicator of the type of personality or demeanor of the e) I have decided to take or not to take a class based solely on the syllabus. f) I have complained openly in class or privately to the instructor about a course syllabus. g) I have judged how beneficial a class may be by looking at the syllabus. h) I feel that a syllabus is a picture of the potential benefits of a class. 90
instructor.
www.ccsenet.org/ijms
International Journal of Marketing Studies
Vol. 7, No. 1; 2015
2. Thinking about the most recent syllabi you have received in your classes, please indicate your level of agreement or disagreement with the following statements. a) The typical syllabus is too long to truly understand. b) The typical syllabus is confusing and lacks continuity. c) The typical syllabus is NOT visually appealing or user friendly. d) The typical syllabus is like reading a good road map. e) I usually have to add explanations to parts of my syllabus. f) I usually read my syllabus only a few times during the course. g) I usually keep my course syllabus with me in class. h) I usually copy important information from the syllabus to my calendar or day planner. 3. What would the best syllabus for you look like? Please answer the following questions by indicating your level of agreement or disagreement. a) It should have good use of white or open space to separate key areas. b) Daily course work should be described in a table instead of in paragraphs. c) Key deadlines should be indicated in boldface type. d) It should have a personal touch such as graphics or cartoons. e) It should explain the possibilities for earning extra points and also outline the grading criteria. f) It should include the instructor’s philosophy of teaching. g) It should include the instructor’s expectations for student participation. h) It should contain correct grammar, spelling, and punctuation. 4. Shown at the bottom of this page is one section of a syllabus presented in 4 different ways. Usethe 4 examples to respond to the following questions. a) Which of the four examples is the most visually appealing to you? ____ b) Which example is the most difficult for you to understand or comprehend quickly? ____ c) Which example is easiest to look at before your week (or day) starts in order to understand what you must do to prepare for class? ____ d) Which example is closest to the typical syllabus you receive? ____ e) Which example do you think is the easiest for an instructor to create? _____ f) Which example best explains the requirements of the course? _____ g) Of the syllabi you have received in the last year, what percent of them looked like Example 1: _____ %
Example 2: _____%
Example 3: ____%
Example 4: _____%
EXAMPLE 1: Monday, October 12, - Topic for the Day: The International Marketplace; Chapters to be read are Chapters 9 and 10 from Elwood and Dean, Capturing the World Market; We will be breaking into groups for discussions of “What do you do to prepare for International Representation?”; The daily assignment is handwritten responses to end-of-chapter questions: Chapter 9 - Questions 4 and 8; Chapter 10 - Questions 3 and 11; You will also turn in your business outline for your product and targeted country; Please also spend some time on Table 9.14 and Checklist 10.3 EXAMPLE 2:
Monday, October 12, Topic for the Day: The International Marketplace
From Elwood and Dean, Capturing the World Market: Read Chapters 9 and 10
Small Group Discussion: “What do you do to prepare for International Representation?”
Turn-Ins: Written responses to end-of-chapter questions: Ch 9 - Q 4 & 8; Ch 10 - Q 3 & 11;
Business outline for your product and targeted country.
Spend additional time on Table 9.14 and Checklist 10.3 91
www.ccsenet.org/ijms
International Journal of Marketing Studies
Vol. 7, No. 1; 2015
EXAMPLE 3: Monday, October 12, 2008 Topic: The International Marketplace; Chapters 9 & 10 (Elwood & Dean, Capturing the World Market) Be prepared: Discussion “What do you do to prepare for International Representation?” Turn-Ins: End of Ch 9 Q 4 & 8; Ch 10 - Q 3 & 11; Business Outline for product and country you plan to market in Second Look At Table 9.14 & Checklist 10.3 EXAMPLE 4: Date Oct. 12
Topic International Marketplace
Chapters 9 & 10 Elwood/Dean
Discussion What do you do to prepare for International Representation?
Turn-ins C9: Q 4, 8 C10: Q 3,11
2nd Look Table 9.14 Checklist 10.3
5. On the first day of class when you may be deciding whether to stay in a course or drop it which of the following factors do you consider important? a) Course catalog description b) Input from friends and classmates c) Instructor’s demeanor during the first class d) Syllabus length e) Day and time of the class f) Workload presented in the syllabus g) Instructor’s reputation 6. How many courses have you taken in which there was no syllabus? ____________ 7. Of the syllabi you have received in the last year, what percent would you rate as EXCELLENT? ___% 8. Of the syllabi you have received in the last year, what percent would you rate as VERY POOR? ___% 9. What is your gender? 10. What is your ethnicity? 11. What is your academic standing? 12. What is your option? Copyrights Copyright for this article is retained by the author(s), with first publication rights granted to the journal. This is an open-access article distributed under the terms and conditions of the Creative Commons Attribution license (http://creativecommons.org/licenses/by/3.0/).
92