Vol. 269,No. 49,Issue of December 9,pp. 31051-31058, 1994 Printed in U.S.A.
“ H E JOURNAL OF BIoLoClcm CHEMISTRY 0 1994 by The American Society for Biochemistry and Molecular Biology, Inc.
Targeting DNA-binding Drugsto Sequence-specific Transcription FactoreDNA Complexes DIFFERENTIAL EFFECTS OF INTERCALATING AND MINOR GROOVE BINDING DRUGS* (Received for publication, August 1, 1994, and in revised form, October 3, 1994)
John J.Welchi, Frank J. Rauscher IIIPII, and Terry A. Beermanill From the $Experimental Therapeutics Department, Roswell Park Cancer Znstitute, Buffalo, New York 14263 and the SWistar Znstitute, Philadelphia, Pennsylvania 19104
ieshavedemonstrated that minor groove bindingdrugs Intercalating, minor groove binding, and covalently bonding drugs were evaluatedby mobility shift assays (MGBDs) can block TFs bindingt o DNA(9-16). We have sought for their ability to interfere with transcription factors to identify drug properties contributing t o the specificity and binding to their respective DNA recognition sequences. potency of drug inhibition of TF-DNA interactions. Drugs can be mechanistically divided into a few broad catTheCys,His, zincfingerproteins EGR1, WT1, and NILBA, the basic leucine-zipper protein wbJudwbFos, egories: intercalating drugs, MGBDs, and drugs which chemiand the minor groove binding proteinhTBP were cho- cally bond to DNA. Intercalators bind DNA by inserting their sen as representative transcription factors. TheirDNA planar chromophores between DNA bases. In addition to stackrecognition sites include G/C-rich, mixed, and APT-rich ing interactions, some of these drugs are furtherstabilized by sequences. The intercalators nogalamycin and hedamy-hydrogen bond formation between DNA bases and the sugars appended to the central chromophore. Most intercalators demcin, and the G/C-specificminorgroovebindingdrug onstrate either a preference for G/C regions (bleomycin, doxochromomycinA, were the most potent drugs, preventing transcription factorDNA complex formation at concen- rubicin, ethidium, and echinomycinj or no defined preference and menogaril). Amiloride and trations less than 1 m. Similar concentrationsof chro- (hedamycin,nogalamycin, mAMSA are examples of APT-specific intercalators. EchinomymomycinA, disrupted preformed complexes while nogalamycinandhedamycinwere50-fold less potentif cin is a bisintercalator, possessing two intercalating chroproteins were allowedto bind DNA prior to drug treat- mophores (3). MGBDs have a crescent shape and fit snugly ment. Echinomycin inhibited EGRl-DNA complex for- within the curvatureof the minorgroove where they form hymation 50%at 5 m but hadlittle effect onthe formation drogen bonds to the DNA bases. Except for the aureolic acids, of NILBA-DNAcomplexes. Conversely, doxorubicin was natural MGBDs bind toAPT-rich sequences and cannot tolerate found to inhibit NIL2A complex formation 50% at less the N,-amino of guanine in theminor groove. Classic MGBDs than 1p ~but , did not achieve this level of inhibitionof include distamycin, netropsin, andHoescht 33258 (bisbenzimEGRl/DNA complex formation even at 50 p ~ The . A/”- ide) (4).CC-1065 (17) and tomamycin (18) are covalently bonddirected minor groove binding drugs, while inhibiting ing MGBDs. Chromomycin A, binds G/C-rich sequences (19hTBP at submicromolar concentrations, had no effect on 211, and DAPI binds t o A/Tsequences as a MGBD, but to G/C either EGRl or NIL2A. sequences by intercalation (22). Dimethyl sulfate (DMS) (23) and cis-platinum (24)covalently modify guanines in themajor groove. Finally, the polyamine spermidine associates nonspeMany DNA-binding drugs appear to function by interfering cifically with DNA by an electrostatic interaction. This specwith critical cellular processes such as inhibitionof DNA and trum of chemical agents which interact with DNA in different RNA polymerases, topoisomerases, and nucleases (1-5). modes should show specificity with respect to their ability t o Mechanistically, such drugs mayblock the progress of procesinfluence DNA recognition by proteins. sive enzyme complexes or interfere with protein access to DNA. Drugs in all three categories were assayedfor their ability to Since the binding of transcription factors (TFs)’ t o DNA cisinhibit archetypal TFsfrom binding to consensus site-containelements is centralt o cellular regulation, this interaction has ing double stranded (dsj-oligonucleotides. The selected TFs been proposed as a drug target(6-8). A number of recent studwere EGR1, WT1, NILBA, the wbJudwbFos heterodimer, and hTBP. The first three TFs bind DNA through zinc finger do* This work was supported in part by Grants CA16056,CA09072, CA52009, CA47983, and core grant CA10815 from the National Insti- mains of the TFIIIA class (25-27). EGRl and NIL2A DNAtutes of Health and Grant CH293 from the American Cancer Society, binding domains bothcontain three zinc finger modules, while and by grants from the W. W. Smith Charitable Trust, The Hansen WT1 contains four. Both EGRl and WT1 bind the EGRl conMemorial Foundation, and the Mary A. H. Rumsey Foundation. The sensus site, but other sequences have been found to which costs of publication of this article were defrayedin part by the payment of page charges. This article must thereforebe hereby marked “aduer- EGR1, but not WT1, can bind (26). The wbJudwbFos hettisement” in accordance with 18 U.S.C. Section 1734 solely to indicate erodimer, representative of the basicleucine-zipper motif, this fact. binds the AP-1 site through the interaction of its positively 1 Pew Scholar in the Biomedical Sciences. I1 To whom correspondence should be addressed. Fax: 716-845-8857; charged a-helical domains with theDNA major groove, a relationship described as the “scissor grip” (28). The hTBP binds E-mail:
[email protected]. a saddle-shaped The abbreviationsused are: TFs, transcription factors; MSA, mobil- via the minor groove of DNA (29, 30) and has ity shift assay; hTBP, human TATA box binding protein;NILZA, nega- P-barrel configuration (31, 32). EGRl and WT1 bind to an extive regulatorof IL-2; EGR1,early growth response gene-1; WT1, Wilms clusively G/C-rich sequence within themajor groove (33),while tumor supressor gene-1; wbJun, “weebug“ Jun; wbFos, “weebug” Fos; MGBDs, minorgroove binding drugs; Me,SO, dimethyl sulfoxide; DMS, hTBP bindsa sequence consistingsolely ofA/T base pairs in the 4’-(9-acridinylamino)- minor groove (34). NIL2A and wbJudwbFos consensus sites dimethyl sulfate; ds, double-stranded; &SA, methane-sulfon-m-aniside; DAF’I, 4,6-diamidino-Z-phenylindole. have a mixed A/Tand G/C composition (27, 35,361. This choice ~
~~~~
3 1051
31052
Drugs Prevent and Disrupt Danscription Factor*DNAComplexes
of factors allows comparisons to be made among the related zinc finger factors, betweentwo different types of major-groove binding motifs, and contrasts proteinswhich bind in themajor versus the minor groove.
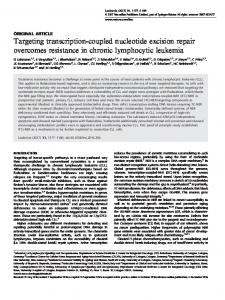
was added and allowed to incubate another 15 min at room temperature. Inspecified experiments, the order of addition of drug andprotein on a polyacrylamide gel and were reversed. Reactions were then loaded electrophoresed. In experiments involving chromomycin A,, Mg2’ was added to a final concentration of 6.5 mM in thebinding reaction. In experimentsinvolvEXPERIMENTAL PROCEDURES ing tomamycin and CC-1065, DNA and drug were prereacted for 2 h, Intercalating D r u g s S t o c k s of 10 mM nogalamycin and 10 mM me- while cis-platinum was incubated for 24DNA h. modification reactions nogaril (kindlyprovided by Upjohn Pharmaceuticals) were prepared in with hydrazine, piperidine, KMnO, (40,41), cis-platinum,CC-1065, and dimethyl sulfoxide (Me,SO). Stocks of 50 mM mAMSA(Warner Lambert DMS were followed by ethanol precipitation and resuspension of the Pharmaceuticals, Morris Plains, NJ) were prepared inMe,SO. Stocks modified oligonucleotides in TE, pH7.6. of 1 mM bleomycin in ddH,O were prepared from Blenoxane (BristolThe following buffer was used in EGRI, WT1, NILPA, and wbJud Myers, Syracuse, NY). Stocks of 1 mM dactinomycin (Sigma) were pre- wbFos MSks: 25mM HEPES-KOH, pH 7.5,lOOm~ KCl, 10 p~ ZnS04, pared in ethanol and stored at 4 “C. Stocks of 10 mM doxorubicin-HC1 5%glycerol, 0.1% Nonidet P-40,200pg/ml bovine serum albumin, 2mM (Aldrich) and5 mM echinomycin (kindly provided by the National Can- dithiothreitol. These proteins were stored at -70 “C as concentrated cer Institute) were prepared in Me,SO. Stocks of 3.1 m~ ethidium stock solutions in the same buffer and diluted with this buffer prior to bromide (Fisher) were prepared in ddH,O. A 5 m~ hedamycin stock use. In thecase of wbJudwbFos, equal volumes of 10 PM protein were (NCI) was preparedby first dissolving in1/10 volume 0.1 N HCl, adding incubated togetherfor 1h at 37 “C to allow dimerization of the proteins. 8/10 volume ddH,O, and neutralizing with 1/10 volume 0.1 N NaOH. In the EGRl and WT1 assays, 4 n~ ds-oligonucleotide was used. For Stocks of 10 mM T4PyMP (kindly provided by Dr. Robert Fiel, Roswell NILBA, 1 nM ds-oligonucleotide was used, andfor wbJudwbFos 0.4 MI was used. Park Cancer Institute) were prepared inddH,O. The hTBP MSA binding buffer contained: 20 mM HEPES-KOH, pH MGBDs-A 1.2 mM chromomycin A3 (Sigma) stock was prepared in ethanol orMe,SO. Stocks of 2.5 mM CC-1065 (Upjohn) were preparedin 7.9, 25 mM KCl, 10% glycerol, 0.025% Nonidet P-40, 100 pg/ml bovine dimethyl acetate. Stocks of 10 mM DAPI (Boehringer Mannheim), 10 m~ serum albumin, 0.5 m~ dithiothreitol, 0.1m~ EDTA, and 2 mM MgCl,. distamycin A (Sigma), 20m~ Hoescht 33258 (Aldrich), and 10 mM ne- In the hTBPMSA, 3.8 n~ ds-oligonucleotide was used. In all MSAs, no tropsin (Boehringer Mannheim), were prepared in ddH,O. A 10 mM competing DNA was present during drug experiments, although earlier experimentsincluded nonspecific competitor DNAs todemonstrate tomamycin stock (NCI) was prepared inMe,SO. Other Agents-Stocks of 10 mM cis-platinum (Bristol-Meyers, Syra- specificity of binding. Electrophoresis a n d Quantitation-Electrophoresis was conductedat cuse, N Y ) were prepared in 0.9% saline. Spermidine trihydrochloride (Sigma) was prepared in ddH,O at a concentration of 10 mM. Except 4 “C with a running buffer of 0.5 x TBE (44.5 mM Tris base, 44.5 m~ where noted, drug stocks were stored polypropylene in microcentrifuge boric acid, 1 mM EDTA). For all TFs except hTBP, a 6% native polyacrylamide gel was used with a 29:l acrylamidehisacrylamide ratio. For tubes at -20 “C and were not exposed to light. hTBP, electrophoresis was performed through a 4% (39:l acrylamide/ Reagents-DMS was obtained from Aldrich. Hydrazine and piperidine were obtained from Kodak. KMnO, was from Sigma. Acrylamide bisacrylamide) native polyacrylamide gel containing 0.025% Nonidet and bisacrylamide were purchased from Bio-Rad. All other chemicals P-40. 16 x 20-cm gels were prerun 15 min and then loaded withpower on t o minimize possible dissociation of the complex in thewells of the were of reagent grade or better and were obtained from Sigma. Oligodeoxynucleotides-Double-stranded oligodeoxynucleotides were gel. Electrophoresis was continuedfor 5 min at300 V and then 45 min prepared by phosphoramidite synthesis at the Wistar Institute oligo- at 250 V. Gels were fixed 5 min in 10% acetic acid, then driedon a gel by exposing dried gelst o Kodak nucleotide synthesis facility and purified by denaturing polyacrylamide dryer. Autoradiography was performed yield exposures gel electrophoresis. Equimolar amounts of complementary strands were XRP-5 film. The time of exposure was adjusted to annealed in 10 mM Tris, 1 mM EDTA (TE), pH 7.6. For mobility shift within the linear response rangeof the film. Levels of free and bound DNA were determined by scanning the films with a computing laser with T4 assays (MSAs), ds-oligonucleotides were 5’ end-labeled polynucleotide kinase (New England Biolabs) and [y2PlATP (SO00 densitometer (Molecular Dynamics). Ci/mmol, Amersham), and sequentially extracted with equal volumes of phenollchloroformhsoamyl alcohol, 25:24:1, and chlorofodisoamyl alRESULTS cohol, 24:l. Unincorporated ATP was removed using a Sephadex G-25 Intercalating, minor groove binding and covalently bonding spin column (Boehringer Mannheim). Probes were used within 2 weeks of labeling. The following ds-oligonucleotides were used in MSAs: MO drugs were assayedfor their ability to inhibitcomplex forma(EGRl,WT1)5’-TCGACGCCCTCGCCCCCGCGCCGGG-3’, 3”GCGGG- tion between DNA oligonucleotides and TFs representingzinc AGCGGGGGCGCGGCCCAGCT-5’; M1 (EGRI, WTl)5“TCGACGAA- finger, basic leucine zipper, and minor groove motifs. An MSA ATCGCCCCCGCGCCGGG-3’, 3’-GC~AGCGGGGGCGCGGCCC- was used to measure this inhibition. Fig. 1 demonstrates a AGCT-5‘; M4 (EGR1, WT1) 5’-TCGACGCCCTCGCCCCCGCTAAG- typical EGRl titration conducted in the absence of drugs. At GG-3’, 3’-GCGGGAGCGGGGGCG~CCCAGCT-5’; N1 (NIL2A) 5” low protein concentrations, the majority of the DNA appears in CGGTTAGACAGGTAAATTGGC-3’,3“GCCAATCTGTCCAITTAAthe lower band which represents freeds-oligonucleotide. As the CCG-5’; AP (WbJudwbFos) 5’-TCGAAAGCATGAGTCAGACA-3‘, 3” TTCGTACTCAGTCTGTACGT-5‘;T1 (hTBP) 5”AAGGGGGGCTATAA- concentration rises and EGR1.oligonucleotide complexes form, AAGGGGGTGG-3’, 3‘-TTCCCCCCGATATTTTCCCCCACC-5’. DNA this band is gradually lost in proportion to the appearance of binding sites are shown inbold type. theupper complexed band.Within therange 0.2-3 ng of TFs-All TFs used in this study were expressed as histidine-tagged proteidreaction, MSAs responded linearly to the addition of fusion proteins in Escherichia coli, purified on nickel columns, and EGRl and were saturatedabove 3 ng of EGR1. Prior to each dialyzed against the binding buffer used MSA. in the These proteins are series of drug experiments, this type of titration wasperformed greater than 98% pure based on SDS-polyacrylamide gel electrophoreof TF sufficient to resultin sis analysis and Coomassie Blue staining. The 21.5-kDa WT1 (371, to determine the minimum amount maximum complex formation (3 ng in this case) and confirm to 13.5-kDa EGR1, and 15-kDa NILPA (27) peptides are truncated versions of the full-length proteins, possessing their zinc finger regions. linearity of the assay. To measure drug inhibition of complex The production and characterizationof wbJun (19 kDa) andwbFos (15 formation, drug and ds-oligonucleotide were preincubated tokDa) proteins has been described in detail (38), and the production of gether. The TF was added, and incubation was continued to full-length 37.7-kDa hTBP is as described (16). The majority of this allow the TF t o bind to its DNA recognition site. These reacwork was performed in the EGRl system. Previous experiments have established that EGRl’s transcriptional activation and zinc finger bind- tions were loaded on a polyacrylamide gel, and the amountof ing domains are structurally and functionally separable modules(39). DNA present in complex with the TF versus free DNA was The EGRl zinc finger domain peptide used in these experiments has determined for each lane. The percent inhibition was calcuDNA binding abilities similar to the full-length protein (261, and its use lated relative to the maximal shift in the absence of drug. has facilitated manipulations and interpretation. Experiments conducted in this mannerwere summarized in DNA Binding Assaysand DrugI).eatment-In general, experiments were performed in the following manner: 2 pl of drug, 1 pl of double- Table I. Drugs were grouped according t o their DNA binding stranded, 5’-32P-radiolabeled oligonucleotide, and 5 p1 of binding buffer mechanism: intercalators, MGBDs, andotheragents.Each of drug required were incubated for 15 min a t room temperature. Next, 2 pl of protein drug wasscored according to the concentration
Drugs Prevent and Disrupt
!Dunscription Factor-DNA Complexes
A
12.5 6.25 2.34 1.76 1.32 0.99 0.74 0.56 0.42 0.31 0.23
0.18 0.13 0.09
ng EGRl
r j”* I J. I
0
I./,
,
1.o 10.0 EGRl nanograms FIG.1. Titration of EGRl to determine amount of protein required for complete shift in MSA. A, 4 nM ‘”P-labeled ds-oligonu-
0.1
cleotide MO containing an EGR1-binding site was incubated 15 min with varying concentrations of EGRl followed by resolution on a 6% polyacrylamide gel and autoradiography.Lanes 1-14 contain 12.5,6.25, and 0.09 ng 2.34, 1.76, 1.32,0.99,0.74,0.56,0.42,0.31,0.23,0.18,0.13, of EGRl protein, respectively. B, similar experiments using the same stock of EGRl were performed in duplicate on separate days, and the results were averaged.
31053
TARLE I Summary of drug inhibition of TFDNA complex formation Drugs which bind DNA by a numberof mechanisms were assayedfor their ability to inhibit formation ofTF.DNA complexes. In the first column, drugsaregroupedintothreesets:intercalatingagents, MGBDs, and other compounds. The factors which were assayed are given across the top of the table. Listed under each factor is its DNA motif sequence specificity, the DNA groove to which i t binds, and the TF which it represents. The columns beneath these factors summarize the ability of each drug to inhibitcomplex formation for each factor. A “3” indicates potent inhibition,defined as a 50%reduction in complex formation versus drug-free control (IC,,,), occurring at drugconcentrations less than or equal to 1 p ~ “2” . indicates IC,, between 1-10 VM, “1” indicates IC,, between 10 and 50 pnl, and “0”indicates littleor no effect a t 50 p . A dash indicates that the particular combination was not tested. Covalently bondingdrugs which inhibited TF binding were rated as“+.” Refer to ”Experimental Procedures” for details of the assay. Factors
EGRl
WT1
”
Groove Mode Specificity
Drugs Intercalators mAMSA Bleomycin Dactinomycin Doxorubicin Echinomycin Ethidium Hedamycin Menogaril Nogalamycin T4PyMP Minor groove binders CC-1065 Chromomycin A, DAPI Distamycin A Hoescht 33258 Netropsin Tomamycin Other Cis-platinum DMS Spermidine
NILSA
-
Major Major ZFP ZFP GIC G/C
0 0 0 0 2 1 33 0 3 1
0 1 0 3 0 3 -
0
-
3 0 0 0 0 0
-
+ +
-
3 0 0
Major ZFP Mixed
t?,: Major P-harrel hZip Mixed
0
-
0 3
0
0 1 2
3 0
3 0 0 0 0 0
-
hTBP
~
0 1 0 1
3
-
-
i\Tr
0“
2 1” 3”
3 -
-
3“ 3 3“ 3“ 3“ 3“
0
-
0 0 0
-
-
Minor
-
-
-
0 to inhibit 50% of TF.oligonucleotide complex formation (the IC,,). The most potent drugs received a “3,”indicating an IC,, a Indicates data from Ref. 16. of less than1PM. Drugs with an IC,, between 1and 10PM were In addition toequilibrium binding drugs, theEGRl/MO sysstill considered relatively strong inhibitors and ranked as “2.” Weak inhibitors, IC,, values between 10 and50 PM, were rated tem wasused to examineseveral agents which covalently mod“1.”Drugs which had littleor no effect a t 50 PM are represented ify DNA. Treatments which alter guanine sites in the major groove such as pretreatment ofDNA withcis-platinum or by a “0.” Varying levels of inhibition were demonstrated by interca- methylation by DMS inhibited complex formation. Depyrimlating agents. The most potent inhibitors were hedamycin and idization with hydrazine and opening of thymidine rings by nogalamycin, which inhibited complex formation at less than1 KMn04 treatment hadno effect on complex formation (results VM for all factors. In contrast, the intercalators&SA, bleo- not shown). These results are consistent with previously remycin, dactinomycin, and menogaril displayed no inhibitory ported chemical interference experiments (33) and the x-ray crystal structure(42)’ which shows EGRl zinc fingers interactactivity againstany factor. The classic intercalatingagent ethidium was found to be a nonspecific and weak inhibitor of ing almost exclusively with the guanine-rich strand of the each TF.DNA complex. Doxorubicin inhibited NIL2A with an EGR1-binding site. , WT1 and wbJun/wbFos required 10 IC,, less than 1 p ~ but A quantitative studyof selected drugs wasperformed in the times this amountof drug for similar inhibition. Doxorubicin’s EGRl MSA system. This TF was chosen as the model zinc IC,, for EGRl was greater than 50 PM. Specificity was also finger protein in part because its interaction with DNA had observed for the bisintercalator echinomycin which inhibited been determined a t high resolution by x-ray crystallography EGR1.oligonucleotide complex formation a t low micromolar (42). Based on the initial evaluation, a large number of drug concentrations, yet had no effect on other TF.oligonucleotide concentrations were evaluated in each drug’s effective range. The intercalating agentsnogalamycin and hedamycin and the complexes. MGBDs were observed either to inhibit TF.oligonucleotide MGBD chromomycin A3 were found to be the threemost potent complex formation a t submicromolar concentrations or not to The murine protein zif268 is also known a s mouse EGR1. Human inhibit them a t all. Distamycin A is representative of the AB” specific MGBDs; it potently inhibited hTBP/oligonucleotide and mouseEGRl are100%identical in aminoacid sequence throughout their DNA-binding domains. Since both this paper and Ref. 42 emcomplex formation (16), but had no effect against the other ployed recombinantproteinscontaining only the DNA-binding dofactors. The G/C-specific drug chromomycin A3is unique among mains, these proteins are identicalexcept for small flanking sequences from the expression vectors used to produce these proteins. the MGBDs because it potently inhibits all TFs assayed.
Drugs Prevent and Disrupt Danscription FactoraDNA Complexes
31054
A ."".
~-
,
10
50
0
8
4
6
2
1.5
0.5 0.1 0.01
1
0
[Nogalamycin] JLM
B L
0.01
I
I
1.oo
100.00
.,
[Drug1 PM FIG.3. Inhibition of EGR1.DNAcomplex formation by weaker drugs. Less potent drugs evaluated were: V,doxorubicin; A,echinomycin; , ethidium; 0, menogaril; and distamycin A. The clashed line 0
10
2
1 0.75 0.56 0.42 0.32 0.24 0.18
0
represents nogalamycin's inhibition curve, for comparison. Reactions were performed a s described for Fig. 1.
0
[Hedamycin] pM
C
u
5u
25
1u
5
L.3
L
1.5
1
u.5
u.1 u.u3
u
[Chromomycin] pM
0.01
1.oo
100.00
[Drug1PM FIG.2. Potent inhibitors of EGRl binding to DNA. A, representative MSAdemonstrating inhibition of EGRl binding tods-oligonucleotide MO in the presence of varying concentrations of the intercalating agent nogalamycin. 4 nM "P-labeled ds-oligonucleotide MO was incubated with nogalamycin for 15 min, and then 3 ng of EGRl was added to each reaction. After an additional 15-min incubation, the reactions were applied to a 6% acrylamide gel, electrophoresed, and autoradiographed. The concentrationof drug in each lanewas: lunes 1 and 13,O; lunes 2-12, 50, 10,8, 6,4, 2, 1.5, 1, 0.5,0.1,and 0.01 PM nogalamycin. B, representative MSA demonstrating inhibitionof EGR1,MO complex formation by the intercalating agent hedamycin. The experiment was performed a s above. The concentration of drug ineach lane was:lunes 1, 11,and 12.0; lunes 2-10,10,2,1,0.75,0.56,0.42,0.32,0.24,and 0.18 PM hedamycin. C , representative MSA demonstratinginhibition of EGR1.MO complex by chromomycin A3. The experiment wasperformed as above except that Mg2' was present at a final concentration of 6.5 mM. Drug concentrations in each lane were: lunes 1 and 13, 0;lunes
inhibitors of the EGR1.MO complex, with IC,, values of approximately 0.8 PM (Fig. 2, A-C). Inhibition by nogalamycin is first seen a t less than0.2 PM, and greater than90% inhibition is reached a t 7 PM. By contrast, hedamycin's inhibition curve is practically a step function. For hedamycin, inhibition is first seen a t 0.6 PM, but greater than 90% inhibition occurs a t less than 1 p ~ The . potency of inhibition by other intercalators ranged from moderate to undetectable. Several weaker inhibitors of EGRl binding to DNA are presented in Fig. 3. For purposes of comparison, the nogalamycin inhibition curve is represented as a dashed line. The classic intercalating agent . bisinethidium was determined to have anIC,, of 20 p ~ The tercalator echinomycin was 4-fold more potent, with an IC,, of 5 PM.Doxorubicin was found to be a surprisingly weak inhibitor of the EGR1.MO complex and was only able to inhibit 22% of . concentrations of doxoEGR1.DNA complex at 25 p ~ Higher rubicin could not be evaluated due to retentionof DNA in the wells of the gel. Menogaril, a derivative of nogalamycin, failed to demonstrate any inhibition of the EGR1.MO complex. As Table I indicates, none of the AiT-specific drugs inhibited EGRl complex formation with MO, which contained an EGR1binding site from the human EGRl promoter sequence. This was not surprisingconsidering that the siteconsisted entirely ofG/C bases. An attempt was made to retarget AiT-specific MGBDs by conducting the MSA with ds-oligonucleotides M1 and M4 which contained AiT sequences on either side of the EGR1-binding site. Treatment of DNA with the minor groove binders DAPI, distamycin, and Hoescht 33258 had no effect on complex formation. The one MGBD which inhibited EGR1.MO complex formation was chromomycin A3 (Fig. 2). In theabsence of M e , chromomycin 4had little effect on EGRlSMO complex formation. Since DNA binding by chromomycin 4is dependent on the concentration of M e (43), it wasexpected that chromomycin A3 inhibition ofEGR1.MO complex formation would also be Me-dependent. In an experiment which in M e was titrated, maximal inhibition of EGR1-MO complex by chromomycin A, was reached at approximately 12 mM M e (Fig. 4). This obser2-12, 50,25, 10, 5 , 2.5, 2, 1.5, 1,0.5,0.1,and 0.05 PM chromomycinq. 0,quantitation of the inhibition of EGR1.MO complex formation by: 0, nogalamycin; m, hedamycin; andA,chromomycin A,. Experiments were performed a s above. The data represent the average of a t least three independent experiments. Error burs indicate standard error of the mean. Complex formation is inhibited by 50% a t approximately 0.8PM for each of these drugs.
and Disrupt Dunscription FactoreDNA Complexes
Drugs Prevent
31055
A
[M$]mM 0
"""2.5
5
12.5
25
37.5
50
0
"
*
80 C
0 ._ .L
0
% - 60 L
c
8 t a
40
*
*
*
-
*
Chromomycin
Nogalamycin
Frc. 5. The effects of increasedamount of EGRl on drug inhibition of EGRl-MO complex. 4 n y MO ds-oligonucleotidecontaining the EGRI-binding site was treated with 5 p f chromomycin A:, or nogalamycinfor15 min. Either 3 ng (saturating, white bars) or 12.5 ng (over-saturating, shaded bars) EGRl was added to these reactions, and incubation continued an additional 15 min. The reactions were then autoradiographed. loaded on a polyacrylamide gel, electrophoresed, and For each drug-treated lane, the percent inhibition was calculated relative to non-drug-treated controls of the same protein level.
To test the hypothesis that higher drug concentrations would be required to disrupta preformed TF.DNA complex, a second series of experiments were conducted with selected drugs and 0 30 60 EGRl (Figs.6 and 7). The ability of a drug to preventcomplex [Mg2'] mM formation was compared to its ability to disrupt a preformed FIG.4. Relationship of Mgl' to chromomycin 4 inhibition of complex. The orderof drug and protein addition was reversed: EGRl-MO complex formation.A , 4 nhl "P-labeled ds-oligonucleotide MO containing an EGRI-binding site was incubated 15 min in protein protein and ds-oligonucleotide were preincubated 15 min, folEGR1, binding buffer containing varying concentrations of MgCI,. 3 ng of lowed by addition of the drug. In experiments with EGRl protein were then added to each reaction, and incubation contin- chromomycin A i s effectiveness appears to be relatively indeued an additional 15 min. Reactions were then loaded on a 6% polyac- pendent of the order of operations; the IC,, values remain berylamide gel, electrophoresed, and autoradiographed. Pairs of lanes received the same amount of MgCI,; in each pair the first lane received tween 0.1 and l PM. Nogalamycin and hedamycin,however, are no drug, the second lane was treated with 1 pu chromomycin A, (de- more than two ordersof magnitude less potent when added to noted by an asterisk). The final Mg?' concentrations were: lanes l , 2, a pre-existing complex. Even in the presenceof 50 PM nogalaand 15, 0;lanes 3 and 4, 2.5; lanes 5 and 6,5; lanes 7 and 8,12.5; lanes mycin, 54% of theds-oligonucleotideremains complexed to 9 and 10,: 25; lanes 11 and 12,37.5; and lanes 13 and 14,50 mM. B, the amount of complexed and free DNA was quantitated using a densitom- EGR1. eter, and the percent inhibition of EGR1.MOcomplexin each drugDISCUSSION treated lane was determined relative to the paired drug-free lane. In this study, the abilityof drugs to interfere withTF.DNA vation also supports the assumption that chromomycin A i s complex formation was examined.TFs and drugs were chosen inhibitory effect is due tothe drug bindingDNA rather than a to represent well characterized DNA binding motifs and DNA direct interaction with the EGRl protein. The Mg" concentra-sequence specificities ranging from G/C- to A/"-rich. Intercalattion was maintained at 6.5 mM for all other experiments ining agents, MGBDs, and covalently binding drugs were found volving chromomycin A,. At thisMg2+level, the inhibition curveto interfere withTF binding toDNA. Neither the intercalators for chromomycinA, in theEGRl/MO system is nearly identical nor the minor groove binders inhibited uniformlyas a g o u p , to that of nogalamycin (Fig. 2). but every TF examined was potently inhibitedby at least one Because both WT1 and EGRl can bind the same site, it was intercalatorandone MGBD. Certaindrugsinhibited DNA possible to compare drug inhibitionof each factor's binding to binding by all of the TFs, others hadno inhibitory activity, and MO. As TableI indicates, these two factors were inhibited by the still others demonstrated selectivityby strongly inhibiting only same drugs and to the same degree for each drug examined. one TF. From thecomplex pattern of drug inhibitionof TF-DNA WT1 inhibition curves generatedby nogalamycin and chromo- binding which has emerged from this study, several general mycin A, (data not shown) were superimposable on the analo- observations can be made which relateDNA binding by drugs gous curves generated in the EGRl/MO system (Fig. 2). EGRlto inhibition of TF.DNA complex formation. was determined to bind MO morestronglythan WT1, and Intercalating drugs demonstrated a range of abilities to inE G R l MSAs were more reproducible, so further experiments hibit TF.DNA complex formation. While submicromolar conwere not conducted with WT1. centrations of nogalamycin and hedamycin were sufficient to In the EGRl MSA, the potency of drugs was affected by the inhibit each TF.DNA complex formation by more 5076, than the absolute amount of protein in the system. In an experiment in intercalators &SA, bleomycin, dactinomycin, and ethidium which 3 ng of protein completely shifted MO, 3 ng (saturating) had little or no effect on the binding of any TF toDNA even a t and 12 ng (over-saturating) amounts of protein were compared concentrations up to 50 p ~ Doxorubicin . had little effecton (Fig. 5 ) . Both chromomycin A3 and nogalamycin demonstrated EGR1, WT1, and wbJudwbFos, but had IC,, an of 1pnf against diminished ability to prevent complex formation in the pres- NIL2A. Likewise,echinomycininhibitedEGRlbindingto ence of excess protein.However, nogalamycin appears to be lessDNA, with an IC,, of 5 PM, but had almost no effect on w b J u d affected than chromomycin A, (Fig. 5). Varying the amount of wbFos or NIL2A. DNA in the reaction between 0.4 and 80 nM had little affecton The contributions of drug sugar placement, sequence specithese drugs' inhibitionof EGR1.MO complex. ficity, and DNA unwinding angle were considered with respect 20
"
31056
Drugs Prevent
A
*
0
0
50
50
*
*
10
10
2
2
and Disrupt Dunscription Factor-DNA
*
1
I 0.1
*
A
*
"-.
0.1 0.01 0.01
0
0
*
0
*
0
*
0 50 50
*
10
10
*
2
2
*
1
*
."""
50
[Nogalamycin] pM
B
Complexes
50
10
10
*".
*
-
2
2
1
1
~~
0.5 0.5 0.05 0.05
0
[Chromomycin] pM *
I 0.5 0.5 0.05 0.05
*
0
[Hedamycin] pM
C L,
0.01
100
7-
1.oo
.~
100.00
[Chromomycin] pM FIG.7. Disruption of pre-existing EGR1-MO complex by a MGBD. An experiment similar to that presented in Fig. 6 was performed, with chromomycin A,. 6.5mM MgCI, is present inall reactions. A, lanes with an asterisk above them were first incubated with EGRl to allow formation of the EGR1,MO complex. The amountof chromomycin A, in each lane was: lanes I, 2, and 15,O; lanes 3 and 4,50; lanes 5 and 6, 10; lanes 7 and 8,2; lanes 9 and 10, 1; lanes 11 and 12,0.5; and lanes 13 and 14,:0.05 p~ chromomycin A,. B , the ability of chromomycin A, to disrupt a preformed EGR1.MO complex).( is similar to its ability to
0
prevent formation of the complex (e).The inhibition profiles do not differ greatly, with ICs, values of 0.7 and 0.35 p ~ respectively. ,
0.01
1.oo
100.00
[Nogalamycin] pM Flc. 6. Disruption of pre-existing EGRleMO complex by threading intercalators. 4 nhl "P-labeled ds-oligonucleotide MO was incubated for 15 min with either 3 ng of EGRl or with various concentrations of nogalamycin. At the end of this incubation, tubes containing nogalamycin received EGR1, and those that had first received EGRl were now treated with nogalamycin.All tubes were incubated an additional 15 min. These reactions were then electrophoresed on a 6% polyacrylamide gel and autoradiographed. A, a representative gel showing an order of addition experiment. Lanes with an asterisk above them were first incubated with EGRl to allow formation of the EGR1,MO complex. The amount of nogalamycin in each lane was:lanes 1,2, and 15, 0;lanes 3 and 4 , 50; lanes 5 and 6, 10; lanes 7 and 8,2; lanes 9 and 10, 1; lanes I 1 and 12, 0.1; and lanes 13 and 14, 0.01 p~ nogalamycin. B, a similar experiment wasperformed with hedamycin. The amount of hedamycin in each lane was: lanes 1, 2, and 15, 0;lanes 3 and 4, 50; lanes 5 and 6,lO; lanes 7 and 8,2; lanes 9 and 10, 1; lanes11 and 12,0.5; lanes 13 and 14, 0.05 p~ hedamycin. C, the amount of MO present in EGR1.MO complex and free was determined by densitometry, and the percent inhibition was calculated with respect to no-drug controlsrun on the samegel. This graph represents an average of three experiments; error bars indicate standard errorof the mean. Inhibitionof EGR1.MO complex formation when drug is addedbefore EGRl (e),and after( W .
to each intercalator's ability to prevent TF.DNA complex formation. The most potent inhibitorsof TF.DNA complex formation, nogalamycin and hedamycin, share the unusual feature of projecting a sugar group from the intercalated chromophore into themajor groove of the DNA helix. X-ray crystal structures (44-46) of DNA-bound nogalamycin indicate thatnogalamycin
places its aminoglucose sugar in theDNA major groove and its nogalose sugar in theminor groove. The aminoglucose sugar of nogalamycin has been shown stabilize DNA-nogalamycin interaction (47, 481, and drugs substituted inboth grooves have been shown to have unusually slow dissociation kinetics (49) consistent with a threading mechanism of intercalation (50, 51).Hedamycin is also believed to thread sugars into both DNA grooves and undergoes slow dissociation (52,53). The presence of a sugar in themajor groove may also interfere directly with protein binding to that side of the helix. Of the intercalating agentsexamined, those which are least inhibitory toTF.DNA complex formation either lack sugar moieties all together (T4PyMP) or have sugars (bleomycin) or other groups (ethidium, mAMSA, dactinomycin) directed only into the minor groove. The two intercalators which demonstrated specific effects, echinomycin and doxorubicin, have only minor groove sugars. The importance of sugars is illustrated by the anthracyclines doxorubicin, nogalamycin, and menogaril, which differ only in their sugars, yet havemarkedly different TF-DNA inhibition profiles. Surprisingly, the reported DNA binding preferences of intercalators in this study correlated poorly with their ability to prevent complex formation as measured in theMSA. Based on the reported binding preferences of bleomycin (GpY) (54),doxorubicin (CpG) (5,55, 56), and echinomycin (CpG) (57), these drugs were expected to interfere most potently withDNA-binding siteswith high G/C content such as theEGR1-binding site,
Drugs Prevent and Disrupt DanscriptionFactoraDNA Complexes but they are poor inhibitors of EGRl binding to DNA. The classical G/C intercalator dactinomycin (58) does not appear to prevent EGRl binding to DNA at all. Both doxorubicin and echinomycin are morepotent against NIL2A, whose site is relatively rich in APT sequence. Conversely, based on its reported APT preference (59), it would be predicted that mAMSA would inhibit the most APT-rich factor, hTBP, from binding t o DNA, but 50 V M mAMSA demonstrated almost no inhibition. In comparison, the G/C-specificagent ethidium's IC,, for this factor was 6.8 m. These results indicate that thereported DNA sequence specificity of intercalating agentsis not a useful criterion in targeting these agents specific to TF-DNA interactions. The number of degrees by which the helix is unwound for each insertion of a drug molecule (unwinding angle) did not correlate well with inhibition of TF.DNA complex formation. Of the intercalators studied, the bisintercalator echinomycin resulted in the greatest helical extensionand unwinding (46") per bound drug molecule (60). However, it is less potent thannogalamycin, which potently inhibited theDNA binding of every TF examined, but has an unwinding angle of only 18"(61). The less effective agents &SA, dactinomycin, and ethidium have larger unwinding angles (21, 26, and 26", respectively) (62). Despite its unwinding angle of 11" (621, doxorubicin potently inhibited NIL2A.DNA complex formation. The diversity of effects seen with intercalators may mirror a variety ofDNA structural distortions induced by binding of intercalators to DNA. In addition towinding, these agents havebeen reported to lengthen andbend the helix and to disrupt the placement of DNA bases around the intercalation site(62-65). The inhibitionprofile of the MGBD chromomycin pS is nearly indistinguishable from nogalamycin under the conditions employed in the EGRl MSA (Fig. 2). Chromomycin A, is a member of the aureolic acid family of MGBDs which includes mithramycin and olivomycin. Mithramycin has beenshown to inhibit the zinc finger protein S p l from binding its G/C-rich site (66). Unlike most MGBDs, these agents bindpreferentially to G/Crich sequences instead of the more common MGBD APT preference. NMR solution studies (67-69) and footprinting studies (70) indicate thatchromomycin A, binds to the minor groove as a dimer. As a result, the minor groove is expanded, and the major groove is correspondingly compressed. Given the G/C-richness of the EGR1-binding site, it was not surprising thatchromomycin A3 potently inhibited EGRlbinding within the major groove of ds-oligonucleotide MO. Contrary to expectations, chromomycin A, was also very inhibitoryto the other TFsexamined, possessingmixed or evenA/T-rich binding sites. Chromomycin 4 s specificity may be more a matter of G/C tolerance in contrast to the majority of minor groove binders which cannot tolerate the2-amino group of guanine in the floor of the minor groove. Although chromomycin A3 normally binds t o more G/C-rich sequences, there areno such competing sequences present in the assay and chromomycin A, may bind the suboptimal site by default.Alternatively, the mixed sequences mayhave sufficient G/C content for chromomycin A3 to bind the minor groove of the TF-binding site according to its sequence preference. The TATA box-containing oligonucleotide is heavily G/C-rich in the regions flanking both sides of the TATA box. It is possible that chromomycin A3 binds here, with structural effects extending into the hTBP-binding site. Such an effect is seen in footprinting studies of chromomycin A3 where A/T regions flanking G/C sequences experience increased nuclease sensitivity duet o altered local structure (20). Distamycinmay be considered representative of thefar larger group of MGBDs which show preference for binding APTrich DNA sequences.Binding of distamycin has also been shown to induce changes in DNA structure, as manifestedby
31057
enhanced rates of DNase I cleavage of neighboring sites (71) and alteration of nucleosomal rotation in the presence of the drug (72). These effects have again been attributed to major groove compression which may be exacerbated if distamycin is present in a dimeric state, as proposed for higher concentrations of the drug(73). In the presentstudy, distamycin failedto inhibit DNA binding by TFs havingmixed or G/C preferences. As we reported in an earlier study, distamycin can also directly inhibit binding of hTBP in the DNA minor groove (16). The mixed-mode agent DAPI, which binds APT sequences in the minor groove, but intercalates intoG/C sequences, was just as poor an inhibitor of TF.DNA complex formation as the AfI" specific MGBDs. In studies whereAPT sequences were placed adjacent to the EGR1-binding site (ds-oligonucleotides M1 and M4)', nogalamycin and chromomycin A, inhibition curves were unchanged. None of the A/"-specific minor groove binding agents had an effect on complex formation. Apparently, these drugs do not induce sufficient distortion from the flanksor are displaced by the incoming protein. The question of whether the strong inhibitorsof EGRl.MO complex (nogalamycin, hedamycin,and chromomycin A,) would be effective at disrupting a pre-existing TF.DNA complex was also addressed. Sincechromomycin A, binds DNA in theminor groove, it is not indirect competition with EGR1, as the x-ray crystal structureof the EGR1.DNA complex (42) indicates that the minor groove remains accessible and relatively unaltered after protein binding. To test the hypothesis that this accessibility would give chromomycin A3 an advantage in displacing prebound protein, DNA was first preincubated with protein, followed by addition of drug. The EGRl inhibition curve generated by chromomycin A, was not greatlyaffected by the order of operations (Fig. 7), but nogalamycin and hedamycin were much less effective at disrupting a preformed TF.DNA complex uersus preventing its formation (Fig. 6). Similar results were obtained with NILSA (data notshown). The presence of a bound TF may inhibit drug binding by direct steric interference or by stabilizing DNA against the intrusionof intercalators. This study has identified DNA binding drugs which effectively block the formation of complex between a TF and dsoligonucleotides containing its consensus binding sequences. By examining a representative assortmentof drugs and TFs in this simplified system, this work has served as a first step toward drug modulation of promoter-specific gene transcription. The next stage in this research is to determine ability the of potent inhibitors of EGRl.TF complex formation to inhibit transcription in in vitro and cellular systems. Acknowledgments-We thank Cory Abate and Tom Curran for wbFos, wbJun, and the hTBPplasmids. Drugs supplied by the NCI were generously donated by the Drug Synthesis & Chemistry Branch, Developmental Therapeutics Program, Division of Cancer Treatment. REFERENCES 1. Straney, D., and Crothers, D. (1987) Biochemistry 26, 1987-1995 2. Woynarowski, J., McHugh,M., Sigmund, R., and Beerman, T. (1989) Mol. Pharrnacol. 35, 177-182 3. Denny, W. (1989) Anticancer Drug Design 4, 241-263 4. Zimmer, C., and Wahnert, U. (1986) Prog. Biophys. M o l . Biol. 47, 31-112 5. Chaires, J.,Fox, K., Herrera, J., Britt, M., and Waring, M. (1987)Biochemistry 26,82274236 6. Peterson, M., and Baichwal, V. (1993) Dends Biotechnol. 111, 11-18 7. Peterson, M., and Tupy, J. (1994) Biochem. Pharmacol. 47,127-128 8. Shea, R., and Milligan, J. (1992)Annu. Rep. Med. Chem. 27, 311-320 9. Dorn, A., Molter, M., Muller, M., Gehring, W., and Leupin, W. (1992)EMBO J . 11,279-286 10. Broggini,M., Ponti, M., Ottolenghi, S., DIncalci, M.,Mongelli, N., and Mantovani, R. (1989)Nucleic Acids Res. 17,1051-1059 11. Wu, H.-M., and Crothers, D.(1984)Nature 308, 509-513 12. Kas, E., Izaurralde, E., and Laemmli, U. (1989)J . Mol. Biol. 210, 587-599 13. Gambari, R., Barbieri, R., Nastruzzi, C., Chiorboli, V., Feriotto, G., Natali, P., Giacomini, P., and Arcamore, F. (1991)Biochem. Pharmacol. 41, 497-502 14. Reeves, R., and Nissen, M. (1990)J . Biol. Chem. 265,8573-8582
3 1058
Drugs Prevent
Disrupt and
P a nscription Factor.DNA Complexes
15. Ray, R., Snyder, R., Thomas, S., Koller, C., and Miller, D. (1989) J. Clin. Invest. 83,2003-2007 16. Chiang, S.-Y., Welch, J., Rauscher,F., and Beerman,T. (1994)Biochemistry 33, 7033-7040 17. Reynolds, V., McGovren, J., and Hurley, L. (1986) J. Antibiot. 39, 319-334 18. Thurston, D.(1993) in Molecular Aspects ofDrug-DNA Interaction (Neidle, S., and Waring, M., eds) pp. 54-82, CRC Press, Ann Arbor, MI 19. van Dyke, M., and Dervan, P. (1983) Biochemistry 22,2373-2377 20. Fox, K., and Howarth, N. (1985) Nucleic Acids Res. 13, 8695-8714 (1994) Biochemistry 33, 1419-1424 21. Liu, C., and Chen, F.". 22. Wilson, W., Tanious, F., Barton,H.,Jones, R., Fox, K., Wydra, R., and Strekowski, L. (1990) Biochemistry 29, 8452-8461 23. Maxam, A,, and Gilbert, W. (1980) Methods Enzymol. 65, 499-560 24. Fichtinger-Shepman, A., van der Veer, J., den Hartog, J., Lohman, P., and Reedijk, J. (1985) Biochemistry 24, 707-713 25. Sukhatme, V., Cao, X., Chang, L., %ai-Morris, C.-H., Stamenkovich, D., Ferreira, P., Cohen, D., Edwards, S., Shows, T., Curran, T., Le Beau, M., and Adamson, E. (1988)Cell 5 3 , 3 7 4 3 26. Moms, J., Madden, S., Tournay, O., Cook, D., Sukhatme, V, and Rauscher, F. (1991) Oncogene 6,2339-2348 27. Williams, T., Moolten, D., Burlein, J., Romano, J., Bhaerman, R., Godillot, A,, Mellon, M., Rauscher, F. I., and Kant, J. (1991) Science 254, 1791-1794 28. Vinson, C., Sigler, P., and McKnight, S. (1989) Science 246, 911-916 29. Starr, D., and Hawley, D.(1991) Cell 67,1231-1240 30. Lee, D., Horikoshi, M., and Roeder, R. (1991) Cell 67, 1241-1250 31. Nikolov, D., Hu, S.-H., Lin, J., Gasch, A., Hoffiann, A,, Horikoshi, M., Cbua, N.-H., Roeder, R., and Burley, S. (1992) Nature 360, 40-46 32. Kim, J., Nikolov, D., and Burley, S. (1993) Nature 365, 520-527 33. Christy, B., and Nathans, D. (1989) Proc. Natl. Acad. Sci. U. S. A. 86, 87378741 34. Nakajima, N., Horikoshi, M., and Roeder, R. (1988) Mol. Cell. B i d . 8, 40284040 35. Franza, B., Rauscher, F., Josephs, S., andCurran, T. (1988) Science 239, 1150-1153 36. Bohmann, D., Bos, T., Admon, A,, Nishimura, T., Vogt, P., and Tjian, R. (1987) Science 238, 1386-1392 37. Ranscher, F. I., Morris, J . , Tournay, O., Cook, D., and Curran,T.(1990) Science 250, 1259-1262 38. Abate, C., Luk, D., Gentz, R., Rauscher, E , and Curran, T. (1990) Proc. Nutl. Acud. Sci. U.S. A. 87, 1032-1036 39. Madden, S., Cook, D., Morris, J., Gashler, A., Sukhatme, V., and Rauscher, F. (1991) Science 253, 1550-1553 40. Brunelle, A,, and Schleif, R. (1987) Proe. Nutl. Acad. Sci. U. S. A . 84, 66736676 41. Rubin, C., and Schmid, C. (1980) Nucleic Acids Res. 8,46134619 42. Pavletich, N., and Pabo, C. (1991) Science 262, 809-817 43. Nayak, R., Sirsi, M., and Podder, S. (1973) FEBS Lett. 30, 157-162
44. Liaw, Y.-C., Gao, Y.-G., Robinson, H., van der Marel, G., van Boom, J., and Wang, A.-J. (1989) Biochemistry 28, 9913-9918 45. Gao, Y.-G., Liaw, Y.-C., Robinson, H., and Wang, A:J. (1990) Biochemistry 29, 10307-10316 46. Williams, L., Egli, M., Gao, Q., Bash, I?, van der Marel, G., van Boom, J., Rich, A., and Frederick, C. (1990) Proc. Natl. Acad. Sei. U. S. A. 87, 2225-2229 47. Zhang, X., and Patel, D. (1990) Biochemistry 29,9451-9466 48. Searle, M., Hall, J., Denny, W., and Wakelin,L. (1988) Biochemistry 27,43404349 49. Fox, K., Brassett, C., and Waring, M. (1985) Biochim. Biophys. Acta 840, 383-392 50. Collier, D., Neidle, S., and Brown, J. (1984) Biochem. Pharmacol. 33, 28772880 51. Islam, S., Neidle, S., Gandecha, B., Partridge, M., Patterson, L., and Brown, J. (1985) J. Med. Chem. 28,857-864 52. White, H., and White, J. (1969) Biochemistry 8, 1030-1042 53. Sun, D., Hansen, M., Clement, J., and Hurley, L. (1993) Biochemistry 32, 8068-8074 54. Takeshita, M., Grollman, A,, Ohtsubo, E., and Ohtsubo, H. (1978) Proc. Natl. Acad. Sci. U.S. A. 75, 5983-5987 55. Chen, K.-X., Gresh, N., and Pullman, B. (1985) J . Biomol. Struct. Dyn. 3, 445-466 56. Frederick, C., Williams, L., Ughetto, G., van der Marel,G., van Boom, J.,Rich, A,, and Wang, A.-J. (1990) Biochemistry 29, 2538-2549 57. van Dyke, M., and Dervan, P. (1984) Science 225, 1122-1127 58. van Dyke, M., Hertzberg, R., and Dervan, P. (1982) Proc. Natl. Acad. Sci. U. S. A. 79, 5470-5474 59. Wilson, W., Baguley, B., Wakelin, L., and Waring, M. (1981) Mol. Pharmacol. 20, 4 0 4 4 1 4 60. Waring, M., and Wakelin, L. (1974) Nature 252,653457 61. Waring, M. (1970) J. Mol. Biol. 54, 247 62. Waring, M. (1981)Annu. Reu. Biochem. 50, 159-192 63. Neidle, S., and Abraham, Z. (1984) CRC Crit. Reu. Biochem. 17, 73-121 64. Cons, B., and Fox, K. (1990) Biochem. Biophys. Res. Commun. 171,1064-1070 65. Nightingale, K., and Fox, K. (1992) Biochem. J. 284, 929-934 66. Snyder, R., Ray, R., Blume, S., and Miller, D. (1991) Biochemistry 30, 42904297 67. Gao, X., and Patel, D. (1989) Biochemistry 28,751-762 68. Gao, X.,and Patel, D. (1990) Biochemistry 29, 10940-10956 69. Banville, D., Keniry, M., Kam, M., and Shafer, R. (1990) Biochemistry 29, 6521-6534 70. Stankus, A., Goodisman, J., and Dabrowiak, J. (1992) Biochemistry 31,931093 18 71. Fox, K., and Waring, M. (1984) Nucleic Acids Res. 12, 9271-9285 72. Low, C.. Drew, H., and Waring, M. (1986) Nucleic Acids Res. 14, 67854801 73. Pelton, J.. and Wemmer, D. (1989) Proc. Nutl. Acad. Sci. U. S. A. 86, 57235727