specific experiments: a pilot-scale salt-water mixing tank (Lab E: Mixing Tank ... visualization of alarms and trends, building software modules (i.e., point building) and custom control algorithms, are all important facets of computing in a real- ...
Teaching Process Dynamics and Control Using An Industrial-Scale Real-time Computing Environment D. E. Rivera∗, K. S. Jun, V. E. Sater and M. K. Shetty Department of Chemical, Bio and Materials Engineering and Control Systems Engineering Laboratory Computer-Integrated Manufacturing Systems Research Center Arizona State University, Tempe, Arizona 85287-6006 To Appear in Computer Applications in Engineering Education Special Issue on Computer-Aided Chemical Engineering Education
Abstract This paper describes how an industrial-scale real-time computing platform, namely the Honeywell TDC3000, has been incorporated into the undergraduate process control course at Arizona State University. The mixing tank dynamics and gas oil furnace control experiments described in this paper are among eleven laboratory exercises developed for this course which provide students with unique insights on life cycle issues in control, real-time system architecture and information needs, and the benefits of “off-line” computer-aided design tools.
Keywords: process control education, distributed control systems, system identification, computer-aided control system design ∗
to whom all correspondence should be addressed
1
Introduction The Control Systems Engineering Laboratory at Arizona State University began in September, 1990 as the result of a major collaboration between Honeywell Industrial Automation and Control, Digital Equipment Corp., and Arizona State University. Honeywell IAC donated a $1.2 million, state-of-the-art TDC 3000 Plant Information and Control System, with DEC providing on consignment a Local Area Network of VAX 3500 and DECStation 5000 workstations. The result is a unique real-time computing environment which allows students in the laboratory to stage a wide variety of industrially-meaningful scenarios spanning the areas of batch and continuous process control. The goal of CSEL over the past five years has been to take advantage of these outstanding facilities to develop a visible research program as well as augment the educational experience of our undergraduates. Since the inauguration of the laboratory, eleven out of the twelve experiments in CHE 461 have been developed or modified to run on the platform. Dynamic modeling and control of both pilot-scale equipment (a shell-and-tube heat exchanger, a salt-water mixing tank, and a pH reactor) and simulated plants (a twocomponent mixing reactor and a heavy gasoil furnace) are featured in these experiments. In addition to providing an excellent environment for implementing classical control concepts, these labs expose students to issues in control system design and implementation which are rarely seen in an undergraduate program. Specifically, these labs provide students with an understanding of life cycle issues in control, an awareness of computer system architecture and information integration needs, and an appreciation for the usefulness of computer-aided design and analysis tools. In this paper, we describe how the TDC3000 and other computing systems in our laboratory have been integrated into ASU’s undergraduate control course by profiling two specific experiments: a pilot-scale salt-water mixing tank (Lab E: Mixing Tank Dynamics and Sensor Calibration) and a simulated heavy gas oil furnace (Labs D, J1, and J2: Furnace System Identification and Control). While the Department of Chemical Engineering at Arizona State University is not unique in having access to a commercial distributed control system such as the TDC3000, we are unaware of any program in the United States that
2
has utilized a DCS computing environment to the extent that we have accomplished at ASU. We hope this paper will encourage additional interactions of this nature between industry and academia.
Overview and Objectives of CHE 461 Process Dynamics and Control (CHE 461) is a required senior-level course in the chemical engineering program at ASU. This three-credit course is offered in the fall semester and consists of two hours of lecture and a 3-hour lab session per week. The textbooks authored by Seborg et al. [1] and Ogunnaike and Ray [2] are used. As an introductory process control course, the bulk of the material covered in CHE 461 represents traditional aspects of control engineering, such as dynamic modeling, Laplace transforms, transfer functions, properties of closed-loop systems, controller types and implementation, and frequency response analysis. An additional number of the topics covered in this course form part of the process control curriculum for the year 2000, as noted by Edgar [3]. Among these topics are: System Identification. Strong emphasis is given to dynamic modeling from plant data (i.e., system identification) since this approach is the most commonly used in industrial practice. We go beyond the graphically-based step testing/process reaction curve techniques to introduce students to the use of regression-based (i.e., prediction-error) methods for system identification [4], and the considerations involved in practice to obtain informative models from data. Systematic Model Based Control Design. Most introductory texts focus on the use of simple tuning rules for Proportional-Integral-Derivative (PID) controllers (e.g., ZieglerNichols, Cohen-Coon) as the primary means for teaching controller design, with little explanation regarding how the rules were derived or their underlying significance. In CHE 461 we rely instead on a more systematic approach to introducing students to control design based on the concept of Internal Model Control (IMC) [5]. Students are presented with a detailed assessment of control performance requirements, and 3
shown that control performance is limited by the presence of nonminimum phase behavior in the plant (time delay and Right-Half-Plane zeros) and the requirement that the control law be stable and realizable. The Internal Model Control design procedure directly addresses these performance requirements, and depending on the sophistication of the model, the IMC design procedure leads naturally to PID, PID with filter, and Smith predictor controllers with corresponding tuning rules. The students then compare these IMC-generated rules with classical tuning rules, and are able to assess the benefits of the IMC-based approach on both practical and theoretical grounds. The application of IMC to PID controller design is based on the work of Rivera et al. [6], which has found widespread acceptance in the process industries. While aspects of this work are discussed in the texts by Seborg et al. [1] and Ogunnaike and Ray [2], additional notes are provided to the students by the instructor [7]. The laboratory segment of CHE 461 is intended to provide students with a “handson,” holistic experience which gives life to the somewhat dry, theoretical concepts taught in lecture. Main features of the laboratory are described below: Real-time Control Implementation. It takes more than good control theory to implement a working, practical control system. Through the use of the TDC3000 platform, students quickly find out that real-time implementation of a PID controller goes much beyond writing simple time-domain approximations to Laplace transform equations. Reading and sending analog signals from the process, real-time schematics, effective visualization of alarms and trends, building software modules (i.e., point building) and custom control algorithms, are all important facets of computing in a real-time environment. Through the laboratory students are introduced to the conceptual design, “build and program,” commissioning and maintenance phases which define the control system lifecycle. Properly addressing lifecycle considerations, as noted by Dupont’s Hanley [8], makes the difference in practice between an effective control system and one where degraded performance is the norm, only a short time after the initial commissioning. 4
Computer-aided control system design. Students have access to MATLAB with SIMULINK [9] on assorted personal computers and workstations located in the undergraduate laboratory and throughout campus. MATLAB enables the students to perform regression analysis in support of system identification and sensor calibration tasks, compute controller parameters from model-based tuning rules, and carry out simulation of closed-loop responses prior to controller implementation. Simulation tasks are accomplished using SIMULINK, MATLAB’s graphical interface. Students quickly learn that effective use of MATLAB/SIMULINK promotes a “quality” work enviroment and error free-work. Another meaningful educational experience resulting from simulation is the need to explain discrepancies between simulated results and the values observed from the TDC3000 system.
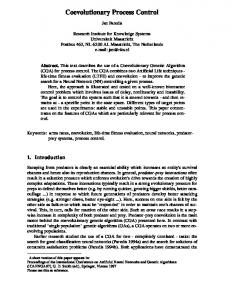
Overview of the Laboratory We briefly describe the components of the distributed control system in our laboratory. The TDC3000 is a distributed computing system with various nodes linked to two networks: a Local Control Network (LCN) and at least one process network. Honeywell offers two types of process networks, the Data Hiway and the Universal Control Network (UCN). The system at ASU is UCN-based. Each of the process networks has an interface (gateway) that allows it to communicate with the LCN. The Universal Control Network interface is called the Network Interface Module (NIM). The Universal Control Network transmits process data from process connected devices such as controllers and data acquisition devices (for measuring temperature, flow, level etc.) through their gateways to the LCN. Visualization of the entire plant is done by Universal Stations (US), which reside on the LCN. The Universal Station represents the primary TDC3000 human/machine interface, and provides a window to information on the entire system, whether it is resident in one of the LCN modules or in one of the process-connected (UCN) devices. Figure 1 shows the key features of a TDC3000 system present at ASU. The system features a single UCN consisting of 3 Process Managers (PM). The Process Manager (PM) provides a complete range of data acquisition and control capabilities, including digital 5
inputs and outputs, analog inputs and outputs, and basic control for up to 160 regulatory loops. The PM has a limited amount of programming capability which is particularly geared towards batch sequencing. Our Local Control Network is composed of one Network Interface Module, six Universal Stations, one History Module (HM), one Application Module (AM), and a Computer Gateway (CG). The Computer Gateway links to a VAXserver 3500, which can be used for computer-aided design functions or to implement large, realtime control applications. Mass storage of data on hard disk media is provided by the History Module. The Application Module (AM) permits the implementation of more complex control calculations and strategies than are possible when using only the PM. Specifically, the Application Module allows replacing the set of standard PID-type control algorithms used in the PM with custom algorithms that are written using Honeywell’s Control Language. As will be noted later in this paper, it is through the Control Language insertion feature on the AM that students are able to implement IMC-based controllers as custom PID control algorithms.
Description of the Mixing Tank Dynamics and Sensor Calibration Experiment The objective of this experiment is to determine, via first principles modeling and system identification techniques, the transfer function relating inlet brine flowrate changes to changes in the outlet salt concentration of a continuous stirred mixing process. The experiment requires the student team to generate a suitable calibration between the signal generated from an on-line conductivity sensor and the salt concentration (in g/ℓ) for the outlet stream in the tank. Figure 2 shows both the process and the instrumentation used in this experiment. The flow of tap water to the process is regulated by measuring the flow with an orifice meter and changing the valve position on the water line according to an algorithm in a regulatory control point in the PM. This control loop is assigned the tagname FIC100. Similarly, the flow of a concentrated salt solution is controlled with loop FIC101. The level in the tank is measured with a differential pressure cell (d/p) with one leg connected to the bottom of the 6
tank and the other leg open to the atmosphere. The regulatory control point LIC100 compares this level with a desired level and manipulates the flow through the drain line. The salt concentration leaving and entering the tank is measured with conductivity cells and read into the system via the PM Analog Input points CI100 and CI102, respectively. The conductivity measurements are displayed as the PVs (Process Values) of CI100 and CI102. By setting the appropriate instrument range limit parameters in the system (PVEUHI and PVEULO) the students are able to implement a linear correlation relating the raw 4-20ma signal from the conductivity cells to a sensible value for concentration in units of g/ℓ. CIC100 is a regulatory control point used in a subsequent experiment (Lab H: Mixing Tank Control) which adjusts the salt inlet flowrate setpoint (FIC101.SP) to keep exit stream salt concentration at setpoint (CI100.PV); students are asked to leave this point on MANUAL throughout the Lab E experiment. There are two main tasks that must be conducted simultaneously during the initial part of the experiment. One is to create a series of standard solutions that will build a correlation between concentration (in g/ℓ) and conductivity (in millimhos). The other task is to run the tank at various steady-state conditions to establish a relationship between % of scale in the raw signal of CI100 and conductivity, which in turn defines concentration. CI102, the inlet stream salt concentration, has been calibrated by the instructor prior to the experiment. Students set all loops to AUTO (with the exception of CIC100) using as setpoints a fresh water flowrate of ≈ 1.5 gpm, a salt water flowrate of ≈ 0.07 gpm, and tank level of 30%. The raw signal for CIC100.PV is trended until the steady-state is reached. A sample solution is then obtained from the mixing tank, and the conductivity is measured using a bench-scale conductivity sensor. This procedure is repeated using inlet salt flowrate setpoints of 0.15 and 0.2 gpm. While the initial mixing tank experiments are underway, the students prepare a series of standard solutions to relate salt concentration (g/ℓ) to conductivity (millimhos). The conductivity of standard salt solutions corresponding to 1, 2, 4 and 6 g/ℓ are measured using a bench-scale conductivity sensor. Students rely on MATLAB to estimate the parameters of a calibration curve between conductivity and salt concentration. The polyfit command is used to obtain a linear
7
relationship to the measured data set. At the MATLAB prompt, students enter the experimental data and type the following commands, >>x = [20 37 71 100];% Conductivity [millimho] >>y = [1 2 4 6]; % Salt concentration [g/l] >>p = polyfit(x,y,1); >>ye = polyval(p,x); >>plot(x,y,’o’,x,ye,’-’); >>gtext(’y [g/l] = p(1) x [millimho] + p(2)’); >>xlabel(’Conductivity [millimho]’); ylabel(’Concentration [g/l]’) to obtain the parameters estimated from linear regression. Graphical inspection of the curve generated from polyval is used to validate the goodness-of-fit; Figure 3 (top) shows an example of the calibration curve. The calibration equation between the conductivity and salt concentration can now be used to generate data points that define the final calibration curve between salt concentration (in g/ℓ) and % of scale in the CI100 point. Using the three conductivity measurements from the tank samples and the calibration curve between conductivity and concentration, the students apply polyfit in MATLAB to obtain a final calibration curve for the system. An example curve for the CI100 point is shown in Figure 3 (bottom). From this curve, they determine the concentration value for 0% of scale; this value is the low limit on the instrument range, or PVEULO. The value for 100% of scale, meanwhile, is the high range on the instrument, or PVEUHI. The students then proceed to the DETAIL display for both the CI100 and CIC100 points, and enter these parameters. Having completed the calibration portion of the lab, the students proceed with system identification and comparison to first-principles modeling. System identification in the mixing tank consists of generating process reaction curves by introducing step changes in the setpoint of the inlet salt stream controller. Following calibration, the tank should be at steady-state with the fresh water flowrate at ≈ 1.5 gpm, a salt water flowrate of ≈ 0.2 gpm, and tank level of 30%. Students adjust the setpoint of the brine stream flow controller FIC101 from 0.2 to 0.1 gpm; trending and plotting the resulting change in salt concentration (CIC100), as noted in Figure 4, is then performed. Once steady-state is reached, the tank level is adjusted via LIC100 to a higher value (50% full). Then, the students wait until steady-state, and adjust the set point of the salt water flowrate back to 0.2 gpm. Graphical (inflection point) analysis is used to estimate the gain, 8
time constant and delay for this system at each volume level . While performing step tests, members of team measure the tank level and geometry to estimate the true tank volume for subsequent use in generating a first-principles model. Whenever the tank reaches steady-state, students are asked to use process values displayed by the TDC3000 to generate gain and time constant values from the first-principles model as an alternative to graphical analysis. The derivation of the first-principles model is briefly explained. Assuming the fresh water flow rate (qw ) and level are maintained constant, and that the densities of all streams are constant and similar, a component mass balance results in the following differential equation V
dc = qc cc − (qc + qw )c dt
(1)
V represents the volume in the tank, cc is the inlet brine stream concentration, qc is the inlet brine flowrate, while c represents the salt concentration in the outlet stream. Using linearization, the students are able to obtain the transfer function describing changes in qc to changes in c; the resulting Laplace-domain transfer function (in terms of deviation variables) is a first-order system of the form −¯ c ( q¯ccc+q ) ∆c = V w ∆qc ( q¯c +qw )s + 1
(2)
with gain K and time constant τ K=(
cc − c¯ ) q¯c + qw
τ=
V q¯c + qw
(3)
c¯ and q¯c are the nominal outlet salt concentration and inlet salt flowrate, respectively. Students need to report on the values found for gain, deadtime and time constant for the different experimental runs. They are asked to compare their results (in terms of both model structure and the parameter values) predicted by the first-principles model versus the experimentally-obtained transfer functions given by graphical analysis. They must also explain a number of sources of error in this systems, as well as describe the assumptions made during modeling which contribute to error. Finally, they are asked to comment on the pros and cons of the modeling techniques they have applied from the standpoint of both an engineering scientist (i.e., a person interested in the most fundamental approach) 9
versus that of a practicing engineer (i.e., an individual whose main interest is getting the most practical solution).
Description of the Gas-Oil Furnace Experiment The objective of this experiment is to provide students with an appreciation for the diversity of tasks that must be carried out by practicing control engineers when building a process control system. A simulated gas/oil furnace (schematic shown in Figure 5) is used for this purpose. The objective of the control system is to maintain the outlet temperature of a gas oil stream at setpoint by manipulating fuel gas flow to the furnace. Disturbances enter the system via changes in the feed flowrate which can be both random and deterministic in nature. In addition, the temperature sensor is noisy (the magnitude of the noise determined by the instructor). The temperature dynamics are modeled by second-order with delay transfer functions of the form
y(s) =
Kp e−θp s Kd e−θd s u(s) + d′ (s) + ν(s) 2 2 2 2 τ1p s + 2τ1p ζp s + 1 τ1d s + 2τ1d ζd s + 1
(4)
where y is the change in the outlet temperature, u is the change in the fuel gas flow, d′ is the change in the feed flowrate, and ν represents the sensor noise in the outlet temperature. Theoretical issues that are explored in this experiment include identification in a noisy environment, the difference between regression-based models vs. graphical techniques, and the application of the IMC design procedure on highly delayed systems to obtain tuning rules for PID and PID with filter controllers. More practical, engineering functions carried out in this experiment include such tasks as schematic display building using the TDC3000 picture editor, point building on the Application Module, data acquisition and transfer to a personal computer, and use of computer-aided tools (written in MATLAB) to perform model parameter estimation and subsequently controller design and analysis. The tasks carried out by students on this simulated system span three laboratory sessions. During the first session (Lab D), students perform step/pulse testing on the fuel gas flow to determine the system dynamics. While the size of the step must be sufficiently large to exceed the magnitude of the noise and disturbances acting on the system, care must 10
be taken to insure that significant “off-spec” product is not generated during identification testing. The identification data is collected in the Application Module and transferred via floppy to a personal computer, where MATLAB M-files using the functionality of the System Identification Toolbox yield estimates for the gain, time constant, and delay time that are optimal in a least-squares sense. These parameters in turn are compared with those arising from graphical “inflection point” techniques on the process reaction curve ([1], [2]) a task which is complicated by the presence of noise in the data. The tasks of controller design, analysis, and implementation are carried out in two lab sessions (Labs J1 and J2). In the classroom, students have been shown that the IMC design procedure applied to a first-order with delay system leads to a Smith Predictor controller [5]. By applying a Pad´e approximation to the delay, however, the result is a second-order model with Right-Half Plane Zero, for which the IMC design procedure yields a PID with filter controller of the form c(s) = Kc
µ
1 1 1+ + τD s τI s τF s + 1 
(5)
with an associated tuning rule Kc =
1 (2τ + θ) K 2(λ + θ)
τI = τ + θ/2
τD =
τθ 2τ + θ
τF =
λθ 2(λ + θ)
(6)
K is the model gain, τ is the time constant, and θ is the time delay obtained from system identification. λ is an adjustable parameter for the control system which is directly related to the closed-loop speed-of-response. The students then implement a digital “velocity form” version of this PID controller as a regulatory control point in the TDC3000. For a specific sampling time T and backward difference approximation of the derivative and integral modes, the controller is described by a four-term difference equation: ∆uk = K1 ek + K2 ek−1 + K3 ek−2 + Km1 ∆uk−1 τF α = 1+ T Kc T τD K1 = (1 + + ) α τI T Kc 2τD K2 = − (1 + ) α T 11
(7)
K c τD Tα τF = Tα
K3 = Km1
The implementation of the custom control law is achieved by using Control Language insertion in an AM-based regulatory control point, a feature provided by Honeywell which allows users to specify their own control laws. The location of the control algorithm code relative to other functions carried out by a Regulatory Control Point is shown in Figure 6. The block of code (and its corresponding custom data segment) used in this lab is shown in Figure 7. The IMC tuning rule is built into the code, which greatly increases the ease-of-use of the algorithm; on-line control adjustment is achieved by specifying a single parameter (the desired closed-loop speed-of-response) instead of trial-and-error tuning of Kc , τI , τD , and τF . Figure 8 illustrates the sequence of modeling and control tasks carried out by students in this experiment. The initial task of step testing is performed by introducing a small (±3.0%) change from the nominal value of 5.0 MSCF/hr in the fuel gas flowrate. Students are asked to visually ascertain if the test has been sufficiently informative; if not, a -6% change (from 5.3 MSCF/hr to 4.7 MSCF/hr) in the fuel gas flow is introduced. A final +3% step change brings the process to its original operating condition. The result of this series of step tests is equivalent to a “double pulse” input, as seen in Figure 8. Figure 8 also shows the closed-loop step responses obtained from the two PID controllers built by students in this experiment. The point PID10# (PID102 in Figure 8) uses a standard (Honeywell-provided) three-term PID controller implementation; the point PIDWF10# (PIDWF102 in Figure 8) implements a custom PID controller with filter according to the structure in (5) using the CL code in Figure 7. Both controllers use the IMC tuning rules according to [6]. Because its tuning rule is built directly into the control code, the custom point PIDWF10# has a significant advantage over PID10# from the standpoint of easeof-use. Students compare both controllers for a 50 ◦ C setpoint change, and find that the custom PID with filter controller not only returns the process to setpoint faster, it does so with a smoother manipulated variable response than the standard PID controller. Tasks carried out by students during Lab J2 include disturbance rejection of load changes in the feed flowrate, and the use of “bumpless” PID controller forms. Because of 12
the harshness of pure derivative action on step changes, students are asked to modify the ideal PID algorithm using Honeywell’s EQNB, written as u(s) = Kc (1 +
1 )e(s) − Kc τD s y(s) τI s
(8)
Equation (8) is referred to as a “bumpless” implementation of PID control because it applies derivative action to the process measurement y in lieu of the control error e. Students are also encouraged to try bumpless action using Honeywell’s EQNC u(s) = Kc
1 e(s) − Kc (1 + τD s) y(s) τI s
(9)
and to try out ASUtune [10], a demonstration prototype developed in our laboratory for research purposes which fully integrates the system identification and controller design tasks. Simulation plays a particularly useful role in completing the Lab J2 tasks by helping students predict closed-loop system responses and carry out “what-if” scenarios. Figure 9 shows the SIMULINK graphical window built by students which compares the effect of IMC tuning on PI, bumpless PID, and PID with filter controllers. The closed-loop responses (Figure 10) show the pros and cons of a “bumpless” implementation; while bumpless action removes the initial “kick” in the manipulated variable response for step setpoint changes, it does not reduce the control system’s sensitivity to measurement noise. Students can elect to eliminate this problem by either accepting an inferior controlled variable performance resulting from a PI controller, or by relying on the increased sophistication and better performance of the custom-built PID with filter algorithm.
Summary and Conclusions In this paper, we have described how an industrial-scale control testbed has been effectively used to introduce students to issues in real time process control (both fundamental and practical) that go beyond traditional classroom and laboratory instruction in this topic. Having used the system for six semesters, we have solid evidence that student enthusiasm and grasp of the material is significantly enhanced as a result of working on the TDC3000 platform. While learning to use a commercial system has involved significant effort, the results have been well worth it. 13
Acknowledgments We would like to thank Honeywell Industrial Automation and Control for making the Control Systems Engineering Lab at Arizona State a reality. Specifically, we would like to recognize the following Honeywell managers and engineering staff who have played a major role in the development of the Laboratory: Rod Woods, Reed Baron, Ed Massey, Russ Henzel, Ed Williamson, Jim McCarthy, and Jim Nichols.
References [1] D. E. Seborg, T.F. Edgar, and D.A. Mellichamp, Process Dynamics and Control, Wiley, New York, 1989. [2] B. A. Ogunnaike and W.H. Ray,Process Dynamics, Modeling, and Control, Oxford University Press, 1994. [3] T. F. Edgar, “Process Control Education in the Year 2000: A Round Table Discussion,” Chem. Eng. Education, spring 1990, pp. 72-77. [4] L. Ljung. System Identification: Theory for the User, Prentice-Hall, New Jersey, 1987. [5] M. Morari and E. Zafiriou, Robust Process Control, Prentice-Hall, Englewood Cliffs, NJ, 1989. [6] D. E. Rivera, M. Morari, and S. Skogestad, “Internal Model Control 4. PID Controller Design,” Ind. Eng. Chem. Process Des. Dev., vol 25, 1986, p. 252. [7] D. E. Rivera, “Internal Model Control: An Approach for Undergraduates,” CHE 461 Class Notes, Arizona State University, fall 1991, revised, 1995. [8] Hanley, J.P., “How to Keep Control Loops in Service,” pgs. 30-32, Intech, October, 1990. [9] “MATLAB: High Performance Numeric Computation and Visualization Software,” The MathWorks, Inc., Natick, MA, 1984-1995. 14
[10] D.E. Rivera and S. Adusumilli, “ASUtune: A Demonstration Prototype for Integrated Identification and PID Controller Design - User’s Manual”, in preparation.
15
List of Figures 1
ASU TDC3000 LCN/UCN system schematic (top) and representative cluster of Universal Stations and VAX workstations (bottom). . . . . . . . . . .
17
2
Brine-water mixing tank schematic (top) and photograph (bottom). . . . .
18
3
Calibration curve (concentration vs. conductivity) for low concentration salt solutions (top); calibration curve (outlet stream salt concentration [g/ℓ] vs. PV [%]) for the CI100 analog input point (bottom). . . . . . . . . . . .
4
Mixing Tank Process Reaction Curves as visualized from a TDC3000 Universal Station. . . . . . . . . . . . . . . . . . . . . . . . . . . . . . . . . . . .
5
24
MATLAB-SIMULINK graphical window for simulating IMC controller tunings using PI, “bumpless” PID, and PID with filter controllers . . . . . . .
10
23
Furnace System Identification and Controller Testing, as visualized from the TDC3000. . . . . . . . . . . . . . . . . . . . . . . . . . . . . . . . . . . . . .
9
22
Control Language code for custom PID control algorithm, Furnace Experiment. . . . . . . . . . . . . . . . . . . . . . . . . . . . . . . . . . . . . . . .
8
21
AM Regulatory Control Point Processing Steps, with Control Language Insertion points. . . . . . . . . . . . . . . . . . . . . . . . . . . . . . . . . .
7
20
Gasoil furnace control real-time schematic (top), and team of motivated undergraduates creating one (bottom). . . . . . . . . . . . . . . . . . . . . .
6
19
25
Simulated furnace closed-loop responses, from SIMULINK: solid:PID with filter; dashed: “bumpless” PID (EQNB); dotted:setpoint; dash-dotted:PI. .
16
26
ASU TDC3000 LCN/UCN SYSTEM ASU TDC3000 LCN/UCN SYSTEM COB CONSOLE 1 . . . 6
VAX Server 3500
Universal Station Application Module
Universal Station
History Module
Computer Gateway LOCAL CONTROL NETWORK
Network Interface Module
UNIVERSAL CONTROL NETWORK
Process Manager
Process Manager
Process Manager
Figure 1: ASU TDC3000 LCN/UCN system schematic (top) and representative cluster of Universal Stations and VAX workstations (bottom).
17
Figure 2: Brine-water mixing tank schematic (top) and photograph (bottom).
18
6
Conc. [g/l]
5 4 3 y [g/l] = 0.0617 x [millimho] - 0.2759
2 1 0 10
20
30
40
50 60 70 Conductivity [millimho]
80
90
100
110
90
100
8
Conc. [g/l]
6 4 2 y [g/l] = 0.0649 x [%] - 0.2902
0 -2
0
10
20
30
40
50 PV [%]
60
70
80
Figure 3: Calibration curve (concentration vs. conductivity) for low concentration salt solutions (top); calibration curve (outlet stream salt concentration [g/ℓ] vs. PV [%]) for the CI100 analog input point (bottom).
19
30 % level
50 % level LIC100.PV
CIC100.PV
FIC100.PV
FIC101.PV
Figure 4: Mixing Tank Process Reaction Curves as visualized from a TDC3000 Universal Station.
20
Figure 5: Gasoil furnace control real-time schematic (top), and team of motivated undergraduates creating one (bottom).
21
PV PROCESSING
CONTROL PROCESSING
PRE_CTPR
PRE_GI General Input Processing
Initial Control Processing
PRE_PVPR
PST_GO PV Input Processing
Control Input Processing PRE_SP
PRE_PVAG PV_ALG
General Output Processing
PV Calculation
Target Value, or Advisory Deviation Alarm Processing
PV Filtering and Range Checking
Deviation Alarm Processing
PST_PVAG
Alarm Distribution Processing
BACKGRND
PRE_CTAG PST_PVFL PV Source Selection
Control Algorithm Calculation PST_CTAG
PRE_PVA PV Alarm Processing
Control Output Processing
CTL_ALG
CL BLOCK INSERTION POINTS PST_CTAG, etc., are insertion point names.
PST_CTPR
PST_PVPR
Figure 6: AM Regulatory Control Point Processing Steps, with Control Language Insertion points.
22
--=========================================================== CUSTOM PARAMETER PARAMETER PARAMETER PARAMETER PARAMETER PARAMETER PARAMETER PARAMETER PARAMETER PARAMETER PARAMETER PARAMETER PARAMETER
KP "Gain - Process" TAUP "Lag Time constant - Process; Units = Seconds " THETAP "Dead time - Process; Units = Seconds " STP "Sample time - Process; Units = Seconds " RESET_C:LOGICAL "set ON to restart(initialize) controller " TRACK_PV:LOGICAL " set ON to have PV tracking " TAUCL "Adjustable parameter:Closed loop time constant" KC "PID w/filter Gain" TI "PID w/filter Integral time" TD "PID w/filter Derivative time" TAUF "PID w/filter Filter time constant" ER "Current error:e(k)" MOVE "Move :m(k)-m(k-1)"
END CUSTOM --================================================================= BLOCK PADEPRG (GENERIC $REG_CTL; AT CTL_ALG) LOCAL ALPHA,ER1,ER2,MOVE1,KERR,KERR1,KERR2,KMOV1 -- the SP tracks the PV when the point is in MANUAL MODE IF (TRACK_PV = ON AND MODE=MAN) THEN SET SP=PV IF RESET_C = ON THEN( &-- initialize controller coefficents,errors and moves & SET ER,ER1,ER2,MOVE,MOVE1,KERR,KERR1,KERR2,KMOV1 = 0.0; & SET RESET_C = OFF) -SET ER = SP - PV -- Calculate controller tuning parameters SET KC = (2*TAUP+THETAP)/(KP*2*(TAUCL+THETAP)) SET TI = TAUP + THETAP/2 SET TD = TAUP*THETAP/(2*TAUP+THETAP) SET TAUF = TAUCL*THETAP/(2*(TAUCL+THETAP)) -- calculate controller coefficients SET ALPHA = 1 + TAUF/STP SET KERR = KC/ALPHA*(1 + STP/TI + TD/STP) SET KERR1 = -KC/ALPHA*(1 + 2*TD/STP) SET KERR2 = KC*TD/(ALPHA*STP) SET KMOV1 = TAUF/(STP*ALPHA) -- calculate current move SET MOVE = KERR*ER + KERR1*ER1 + KERR2*ER2 + KMOV1*MOVE1 -- store previous errors and moves SET ER2 = ER1 SET ER1 = ER SET MOVE1 = MOVE --calculate current output SET CV = OPEU + MOVE END PADEPRG
Figure 7: Control Language code for custom PID control algorithm, Furnace Experiment. 23
PIDWF102
Step Testing
Temperature Flow Flow Temperature
PID102
Figure 8: Furnace System Identification and Controller Testing, as visualized from the TDC3000.
24
-5 100s+1
Step Fcn1 Transfer Fcn1
Clock r1 To Workspace2
d1 To Workspace9
u1 To Workspace +
Step Fcn
+
+ Sum1
-KKc1
-K1/taui
1/s Integrator
+ Sum
25 200s+1 Transfer Fcn
+ Transport Delay
Sum2
+
y1 To Workspace10
-5 100s+1
Step Fcn2 Transfer Fcn2 r2 To Workspace3
+ Sum3
0. Gain
White Noise
d2 To Workspace12
u2 To Workspace1 +
Step Fcn3
+ Sum7
-KKc2
-K1/taui 2 -K-
+ + 1/s + Integrator1 Sum8
25 200s+1
+
Transport Delay1 Transfer Fcn3
Sum6
du/dt
-Kc2*taud2 Deriv.1
+
y2 To Workspace11 -5 100s+1
Step Fcn4 Transfer Fcn4
+ Sum5
0. Gain1 White Noise1
d3 To Workspace14
r3 To Workspace4
u3 To Workspace5
1 + -KtF3.s+1 Sum11 Kc3 Filter2
+ 25 + + 200s+1 + Sum10 Transport Delay2 Sum12 Transfer Fcn5
+
Step Fcn5
-K1/taui 3 -Ktaud3
1/s Integrator2 du/dt Deriv.2
+
y3 To Workspace13
+ Sum9
0. Gain2 White Noise2
Figure 9: MATLAB-SIMULINK graphical window for simulating IMC controller tunings using PI, “bumpless” PID, and PID with filter controllers 25
Dashed-Dotted: PI; Dashed: PID; Solid: PID w/filter; Dotted: setpoint 1.5
y
1 0.5 0 -0.5
0
200
400
600
800
1000 1200 1400 1600 Time Dashed-Dotted: PI; Dashed: PID; Solid: PID w/filter
200
400
600
800
1800
2000
1800
2000
0.15
u
0.1 0.05 0 -0.05
0
1000 Time
1200
1400
1600
Figure 10: Simulated furnace closed-loop responses, from SIMULINK: solid:PID with filter; dashed: “bumpless” PID (EQNB); dotted:setpoint; dash-dotted:PI.
26