Oct 18, 2016 - Environmental Research, Office of Research and Development, Headquarters, Federal Triangle, DC 20460 DC,. 12. USA. 13. 3. Environmental ...
Atmos. Chem. Phys. Discuss., doi:10.5194/acp-2016-828, 2016 Manuscript under review for journal Atmos. Chem. Phys. Published: 18 October 2016 c Author(s) 2016. CC-BY 3.0 License.
1
Technical note.
2 3 4
Harmonization of the multi-scale multi-model activities HTAP, AQMEII and MICS-Asia: simulations, emission inventories, boundary conditions and output formats
5
6 7 8
Stefano Galmarini1, Brigitte Koffi1, Efisio Solazzo1, Terry Keating2, Christian Hogrefe3, Michael Schulz4, Anna Benedictow4, Jan Jurgen Griesfeller4, Greet Janssens-Maenhout1, Greg Carmichael5, Joshua Fu6, Frank Dentener1
9
10
1. European Commission, Joint Research Centre, Ispra, Italy
11 12 13
2. Environmental Protection Agency, Applied Science and Education Division, National Center for Environmental Research, Office of Research and Development, Headquarters, Federal Triangle, DC 20460 DC, USA
14 15
3. Environmental Protection Agency, Computational Exposure Division, National Exposure Research Laboratory, Office of Research and Development, Research Triangle Park, NC 27711, USA,
16
4. Norwegian Meteorological Institute, Oslo, Norway
17
5. Center for Global and Regional Environmental Research, University of Iowa, Iowa City, IA 52242, USA
18
6. Department of Civil & Environmental Engineering, The University of Tennessee, Knoxville, TN 37996, USA
19
20
21
Abstract
22 23 24 25 26 27 28 29 30 31 32 33 34 35 36 37 38 39 40
We present an overview of the coordinated global numerical modelling experiments performed during 2012-2016 by the Task Force on Hemispheric Transport of Air Pollution (TF HTAP), the regional experiments by the Air Quality Model Evaluation International Initiative (AQMEII) over Europe and North America, and the Modelling Intercomparison Study- Asia (MICS-Asia). To improve model estimates of the impacts of intercontinental transport of air pollution on climate, ecosystems and human health and to answer a set of policy relevant questions, these three initiatives performed emission perturbation modelling experiments consistent across the global, hemispheric and continental/regional scales. In all three initiatives, model results are extensively compared against monitoring data for a range of variables (meteorological, trace gas concentrations, and aerosol mass and composition) from different measurement platforms (ground measurements, vertical profiles, airborne measurements) collected from a number of sources. Approximately 10 to 20 modelling groups have contributed to each initiative, and model results have been managed centrally through three data hubs maintained by each initiative. Given the organizational complexity of bringing together these three initiatives to address a common set of policy relevant questions, this publication provides the motivation for the modelling activity, the rationale for specific choices made in the model experiments, and an overview of the organizational structures for both the modelling and the measurements used and analysed in a number of modelling studies in this special issue.
41
42
1. Introduction 1
Atmos. Chem. Phys. Discuss., doi:10.5194/acp-2016-828, 2016 Manuscript under review for journal Atmos. Chem. Phys. Published: 18 October 2016 c Author(s) 2016. CC-BY 3.0 License.
1 2 3 4 5 6 7
The Task Force on Hemispheric Transport of Air Pollution (TF HTAP) was organized in 2005 under the UNECE Convention on Long-range Transboundary Air Pollution (CLRTAP) (see http://www.unece.org/env/lrtap/welcome.html). Recognizing the increasing importance of hemispheric transport of air pollution, CLRTAP mandated the TF HTAP to work in partnership with scientists across the world to improve knowledge on the intercontinental or hemispheric transport and formation of air pollution; its impacts on climate, ecosystems, and human health; and the potential mitigation opportunities.
8 9 10 11 12 13 14 15 16
In 2010, TF HTAP produced the first comprehensive assessment of the intercontinental transport of air pollution in the Northern Hemisphere (TF HTAP, 2010a,b). A series of four reports addressed issues around emissions, transport, and impacts of particulate matter and ozone, mercury, POPs, and their relevance for policy. The HTAP Phase 1 (HTAP1) joint modelling experiments, in which more than 20 global models participated, focussed on the meteorological year 2001. In 2012, the TF HTAP launched a new phase of cooperative multimodel experiments and analyses to provide up-to-date information to CLRTAP (e.g. Maas and Grenfellt, 2016) and other multi-lateral cooperative efforts, as well as national actions to decrease air pollution and its impacts.
17
The objectives of the HTAP Phase 2 (HTAP2) activity are summarized as follows:
18 19 20 21 22 23 24 25 26 27 28 29 30 31 32 33 34 35 36 37 38 39 40 41 42 43 44 45 46
•
•
•
To estimate relative contributions of regional and extra-regional sources of air pollution in different regions of the world, by refining the source/receptor relationships derived from the HTAP Phase 1 simulations. To provide a basis for model evaluation and process studies to characterize the uncertainty in the estimates of regional and extra-regional contributions and understand the differences between models. To give input to assessments of the impacts of control strategies on the contribution of regional and extra-regional emissions sources to the exceedance of air quality standards and to impacts on human health, ecosystems, and climate.
The major advances of HTAP2 over the earlier HTAP1 experiments were: • a focus on more recent years as a basis for extrapolation (2008-2010), including an updated collection of emission inventories for 2008 and 2010 (Janssens-Maenhout et al., 2015) that is utilised across all model experiments. In HTAP1 the year of interest was 2001, and in contrast to HTAP2, the anthropogenic emissions used by the different modelling groups were expected to be loosely representative for the beginning of the 2000s, but were not prescribed, resulting in a large diversity of base-line emissions. • an expanded number of more refined source/receptor regions: the original set of 4 rectangular source regions (North America, Europe, South Asia, and East Asia) identified in HTAP1 have been refined to align with geo-political borders and additional regions have been added, dividing the world into 16 potential source regions and 60 receptor regions. • the use of regional models and consistent boundary conditions from selected global models for Europe, North America, and Asia to provide high resolution estimates of the impacts on health, vegetation, and climate, in addition to the global models’ world-wide coverage.
2
Atmos. Chem. Phys. Discuss., doi:10.5194/acp-2016-828, 2016 Manuscript under review for journal Atmos. Chem. Phys. Published: 18 October 2016 c Author(s) 2016. CC-BY 3.0 License.
1 2 3 4 5 6 7 8 9 10 11 12 13 14 15 16 17 18 19 20 21 22 23 24 25 26 27 28 29 30 31 32 33 34 35 36 37 38 39 40
The most innovative aspect of the modelling work, performed in 2013-2016, is the consistent coupling of global and regional model experiments using existing modelling frameworks. The regional counterparts of the TF HTAP are the AQMEII (Air Quality Model Evaluation International Initiative) and MICS-Asia (Model Intercomparison Study for Asia) activities. The AQMEII project was launched in 2008 in an attempt to bring together modelers from both sides of the Atlantic Ocean to perform joint regional model experiments using common boundary conditions, emissions, and model evaluation frameworks with a specific focus on regional modeling domains over Europe and North America (Rao et al., 2012). The first two AQMEII activities focused on the development of general model-to-model and model-toobservation evaluation methodologies (phase 1, Galmarini et al. 2012a) and the simulation of aerosol/climate feedbacks with on-line coupled modeling systems (phase 2, Galmarini et al. 2015). AQMEII Phase 3 (AQMEII3) is devoted to performing joint modeling experiments with HTAP2. The AQMEII modeling community includes almost all of the major existing modeling systems for regional scale chemical transport simulation in research and regulatory applications in both continents. Most of the groups participating are part of modeling initiatives in the individual European member states and some of these groups utilize models developed in North America, thus providing the opportunity of assessing the impact of users outside of the conventional modeling context. The MICS-Asia Phase III (MICS3) project is an activity building on work performed in Phase I (1998-2000; sulphur transport and deposition) and Phase II (2004-2009; sulphur, nitrogen, ozone and aerosols, see Fu et al., 2008). MICS3 is organized as a multi-national consortium of institutions and brings together modellers from China, Japan, Korea, Southeast Asia and the United States. The overall scope of MICS3 includes evaluation of the ability of models to reproduce pollutant concentrations under highly polluted conditions, dry and wet deposition fluxes, and the quantification of the effects of uncertainties due to process representation (emissions, chemical mechanisms, transport and deposition) and model resolution on simulated air quality. The joint evaluation with HTAP2 focuses on the evaluation of the role of long-range transport of air pollution in East Asia on air quality and impacts on climate, ecosystems and human health. The involved framework for global aerosol modelling is the AeroCom initiative (Aerosol Comparison between observations and models, Schulz et al. 2009, Myhre et al. 2013), and dedicated experiments on long-range transport were designed and performed in collaboration with HTAP as part of AEROCOM phase 3 (see https://wiki.met.no/aerocom/phase3-experiments), with an additional focus on long-range transport of dust and fire derived aerosol. The data storage and evaluation platform for global models was shared between AeroCom and HTAP2 (see section 2.5).
41 42 43 44 45 46 47
Presently these three activities involve ca. 10 global scale models, and approximately thirty regional scale modelling groups performing model simulations on the North American, European and East Asian domains, probably making HTAP2/AQMEII3/MICS3 exercise the largest, multi-scale/multi-model activity ever performed in atmospheric chemical modelling. The multi-scale and multi-regional modelling exercise required three independent organizations to manage and engage their respective communities and an overarching coordination effort as well as a high level of harmonization of the model simulations aiming
3
Atmos. Chem. Phys. Discuss., doi:10.5194/acp-2016-828, 2016 Manuscript under review for journal Atmos. Chem. Phys. Published: 18 October 2016 c Author(s) 2016. CC-BY 3.0 License.
1 2 3 4 5 6 7 8
at comparability, usability and interoperability of the model results at the various scales. Specific decisions were made regarding the simulation period, lower air boundary conditions (emission inventory), volatile organic carbon (VOC) speciation, methane concentrations, emission perturbation runs, source region perturbations, lateral and upper air boundary conditions for regional simulations, variables expected for the analysis, file naming conventions, type and location of monitoring sites where model results were expected, data submission procedures, and the development and use of interoperable data archiving and visualisation servers.
9 10 11 12 13 14 15
The scope of this note is to provide information on the modelling activity harmonization and coordination adopted to guarantee the maximum level of coherence between the global and regional simulations. It will provide specific details on the organization of the global HTAP2 and the regional AQMEII3 activities, while only general information on the MICS3 experiments is provided. Additional details regarding HTAP2 are summarised at http://iek8wikis.iek.fz-juelich.de/HTAPWiki/ and are available in the report by Koffi et al. (2016) and for AQMEII3 at http://ensemble2.jrc.ec.europa.eu/aqmeii/.
16 17
This note should serve to provide coherent information on the simulations performed and their characteristics to the analysis articles presented in this special issue.
18
19
2. The HTAP2, AQMEII3, and MICS3 modelling exercises set up
20 21
The following aspects have to be harmonized in the organization of a multi scale multi chemical transport model activity:
22
23 24 25 26 27 28
-
Simulation periods and meteorology to be used Emission inventories for global and regional models Boundary conditions for regional scale air quality models Harmonisation and interoperability of global and regional model output Monitoring data locations and methods for comparing models with observations Documentation of individual model set-up and construction of ensemble averages.
29
2.1 Simulation period and meteorology used
30 31 32 33 34 35 36 37 38
The simulation period of interest 2008-2010 was chosen on the basis of the availability of emissions data and intensive observations. The models were requested to run the threeyear period with a priority given to the year 2010, followed by 2008, and then 2009. Global models can use meteorological data representative of the respective year, e.g. driven or constrained by one of the global analysis products that were most convenient to the modelling group. Regional scale modellers also were free to use the meteorological model of their choice based on compatibility with their chemical transport model. Sets of chemical boundary conditions for the regional models were provided by a limited set of global models participating in the global modelling experiments (see section 2.4)
39
4
Atmos. Chem. Phys. Discuss., doi:10.5194/acp-2016-828, 2016 Manuscript under review for journal Atmos. Chem. Phys. Published: 18 October 2016 c Author(s) 2016. CC-BY 3.0 License.
1
2
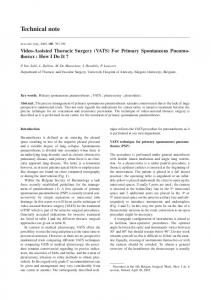
Figure 1. Example of HTAP_v2.2 emission mosaics for NOx in the transport sector.
3
4
5
2.2 Emission data
6 7 8 9 10 11 12 13 14
The anthropogenic emission data were harmonized across the regional and global modelling experiments. The Joint Research Centre’s (JRC) EDGAR (Emission Data Base for Global Researc) team, in collaboration with regional emission experts from the U.S. Environmental Protection Agency (EPA), EMEP (European Monitoring and Evaluation Programme, CEIP (Centre on Emission Inventories and Projections), TNO (Netherlands Organisation for Applied Research), the MICS-Asia Scientific Community and REAS (Regional Emission Activity Asia), has compiled a composite of regional emission inventories with monthly gridmaps that include EDGARv4.3 gap filling for regions and/or sectors that were not provided by the regional inventories.
15 16
The so-called HTAP_v2.2 database (Janssens-Maenhout et al., 2015), used in the global modelling experiments, has the following characteristics:
17 18 19 20 21 22 23
• • • •
Years 2008 and 2010, yearly and monthly time resolutions Components: SO2, NOx, NMVOC, CH4, CO, NH3, PM10, PM2.5, BC, and OC at sectorspecific level. 7 emission sectors (Janssens-Maenhout et al., 2015), see Table 1. Global geo-coverage with spatial resolution of 0.1° x 0.1° longitude, and latitude, to serve the needs of both global and regional model activities.
24 25 26 27
Annual gridded emission data (http://edgar.jrc.ec.europa.eu/htap_v2, latest access July, 2016) are delivered for each pollutant and emission sector. Monthly gridded values are provided for some sectors (energy, industry, transport and residential), where information was available to disaggregate annual emissions.
28 29
The regional emissions for the North American and European regional scale simulations of AQMEII3 are described in Pouliot et al. (2015), and were used earlier for AQMEII2 (Galmarini 5
Atmos. Chem. Phys. Discuss., doi:10.5194/acp-2016-828, 2016 Manuscript under review for journal Atmos. Chem. Phys. Published: 18 October 2016 c Author(s) 2016. CC-BY 3.0 License.
1 2 3 4 5 6 7 8 9 10
et al., 2015) and embedded into the HTAP_v2.2 inventory. The Asian inventory MIX (Li et al., 2015) was developed for MICS3 and HTAP2 simulations on a 0.25°x0.25° resolution, and converted by raster resampling to 0.1°x0.1° resolution for use in HTAP2 . These regional inventories have been combined to form a global mosaic (Figure 1) that is consistent with inventories used at the regional scale in Europe, North America and Asia. However, we note that these emission estimates stemming from different data sources for different regions of the world, are not necessarily consistent, for example different fuel statistics or emission factors may have been used for different regions. Details on the recommended VOC speciation and other specific emission information can be found in Koffi et al. (2016), Janssens Maenhout (2015), Li et al. (2015) and Pouliot et al. (2015).
11
12
Table 1: Emission sectors in HTAP_v2.2 database
Sector AIR SHIPS ENERGY INDUSTRY
TRANSPORT
RESIDENTIAL
AGRICULTURE
Description International and domestic aviation International shipping Power generation Industrial non-power large-scale combustion emissions and emissions of industrial processes and product use including solvents Ground transport by road, railway, inland waterways, pipeline and other ground transport of mobile machinery. Does not include re-suspension of dust from pavements or tire and brake wear Small-scale combustion, including heating, cooling, lighting, cooking and auxiliary engines to equip residential and commercial buildings, service institutes, and agricultural facilities and fisheries; solid waste (landfills/ incineration) and wastewater treatment Agricultural emissions from livestock, crop cultivation but not from agricultural waste burning and not including savannah burning
13
14
15 16 17 18 19 20
Biomass burning emissions have not been prescribed for the global modelling groups, but it is recommended that groups use GFED3 data, which are available at daily and 3-hour intervals (see http://globalfiredata.org/). For the regional modelling groups participating in AQMEII3, fire emissions were included in the inventories distributed to the participants (Pouliot et al., 2015; Soares et al., 2015). Biogenic NMVOCs, soil and lightning NOx, dust, and sea salt emissions have not been prescribed for either the global or regional modelling 6
Atmos. Chem. Phys. Discuss., doi:10.5194/acp-2016-828, 2016 Manuscript under review for journal Atmos. Chem. Phys. Published: 18 October 2016 c Author(s) 2016. CC-BY 3.0 License.
1 2 3 4 5 6 7 8 9 10 11 12 13 14 15 16 17 18
groups; modelling groups are encouraged to use the best information that they have available except that the AQMEII3 regional modelling groups were advised not to include lightning NOx in their simulations since not all modelling groups had a mechanism for including them. For wind-driven DMS (dimethyl sulphide) emissions from oceans, the climatology of ocean surface concentrations described in Lana et al. (2011) was recommended in conjunction with the model’s meteorology and emission parameterisation for the global models. The regional models participating in AQMEII3 did not consider DMS emissions. For volcanic emissions, it was recommended that global groups use the estimates developed for 2008-2010 for AeroCom as an update of the volcanic SO2 inventory of Diehl et al. (2012) and accessible at http://aerocom.met.no/download/emissions/HTAP/ (latest access July 2016). As in the case of lightning NOx emissions, the AQMEII3 regional modelling groups were advised not to include volcanic emissions in their simulations since not all modelling groups had a mechanism for including them. Modeling groups were asked to document the source of all of their emissions data and assumptions, especially if it deviated from the recommended parameterisations. For mercury, the AMAP/UNEP global emissions inventory for 2010 was recommended (http://www.amap.no/mercuryemissions). None of the regional models participating in AQMEII3 considered mercury in their simulations.
19
20
2.3 Emission perturbation
21 22 23 24 25 26 27 28 29 30 31
In addition to the base 2008-2010 simulations, modelling groups were requested to perform emission perturbation experiments to help estimate source/receptor relationships; to attribute estimated concentrations, depositions, and derived impacts to regional and extraregional sources; and to be used for scenario evaluations including uncertainties. Figure 2 lists a large number of possible perturbation experiments; all except the methane perturbation experiments involve a 20% decrease in anthropogenic emissions similar to HTAP1. The choice of 20% was motivated by the consideration that the perturbation would be large enough to produce a sizeable impact (i.e. more than numerical noise) even at longdistances, while small enough to be in the near-linear atmospheric chemistry regime, assumptions which are subject to further analysis. The emission decreases are specified for combinations of pollutants, regions, and sectors.
32
33
34
7
Priorities for HTAP2 Simulations Base Increase CH4 Conc Decrease CH4 Conc
BASE CH4INC CH4DEC
2008 2009 2010
Atmos. Chem. Phys. Discuss., doi:10.5194/acp-2016-828, 2016 Manuscript under review for journal Atmos. Chem. Phys. Published: 18 October 2016 c Author(s) 2016. CC-BY 3.0 License.
1
1 1
1 2 3 4 5 6
NOX
CO
VOC
SO2
NH3
PM
TRN
PIN
RES
OTH
FIR
1
DST
2008 2009 2010 2008 2009 2010 2008 2009 2010 2008 2009 2010 2008 2009 2010 2008 2009 2010 2008 2009 2010 2008 2009 2010 2008 2009 2010 2008 2009 2010 2008 2009 2010 2008 2009 2010 2008 2009 2010
All Region of Emissions Perturbation Global GLO N America NAM Europe EUR East Asia EAS South Asia SAS Rus, Bel, Ukr RBU Middle East MDE SE Asia SEA Central Asia CAS N Afr/Sahara/Sahel NAF * Mex/C America MCA Southern Africa SAF South America SAM Aust/NZ/Pacific PAN Oceans OCN
Highest Priority Next Priority Lower Priority
1 1 1 1 1 1 1
1
1
1
1
1
1
1
1
1 1 1
PM = Other Particulate Matter (BC, OC, PM10, PM2.5) TRN = Ground Transport Sector; PIN = Power and Industry Sectors; RES = Residential Sector; OTH = Other Sectors (Ships, Aviation, Agriculture); FIR = Fire DST = Dust * For dust, some models should divide the NAF source into separate source regions for the Sahara (091+092, in the Tier2 regions) and Sahel (093).
Figure 2. HTAP2 emission perturbation experiments, dark green color are highest priority experiments, light green next priority, and white colors lower priority. ALL refers to perturbation of all anthropogenic components and sectors, sectors are TRN (Transportation), PIN (Power+industry), RES (Residential), OTH (Other), FIR (Fire), DST (Mineral dust).
7 8 9 10 11 12 13 14
To capture the impact of changing methane emissions in a single year simulation, it is necessary to perturb the methane concentration instead of the emissions. The recommended perturbations (Table 2) are intended to cover the range of CH4 concentration changes associated with the Representative Concentration Pathway (RCP) scenarios used for the Intergovernmental Panel on Climate Change (IPCC) fifth assessment report (AR5) (IPCC, 2013) for 2030. The highest priority was assigned to an increase of global CH4 concentrations to 2121 ppbv (representative of RCP8.5). The next priority is assigned to a decrease of global CH4 concentrations to 1562 ppbv (representative of RCP2.6).
15
16
Table 2: BASE and Methane Perturbation runs Simulation
Global CH4 Concentration (ppbv)
Representative of
BASE
1798
2010 based on IPCC (2013)
CH4INC
2121
2030 under RCP 8.5
CH4DEC
1562
2030 under RCP2.6
17
18
19 20 21
The combination of global (all regions and sources) and regional perturbation experiments provides the necessary information to calculate the so-called RERER (Response to ExtraRegional Emission Reductions) metric, using the information on the contribution of foreign
8
Atmos. Chem. Phys. Discuss., doi:10.5194/acp-2016-828, 2016 Manuscript under review for journal Atmos. Chem. Phys. Published: 18 October 2016 c Author(s) 2016. CC-BY 3.0 License.
1 2 3
emission perturbations relative to all worldwide emission perturbation to a change in region i. 𝑅𝐸𝑅𝐸𝑅! =
𝚺!!"#$%&' 𝚺!!""
=
!!"!"#$ !!!"#$%&,𝐢 !!"#$%"
(eq 1)
4 5 6 7 8
where Rglobal is calculated using the global (all regions and sources) 20% perturbation simulation (GLO) minus the unperturbed simulation (BASE) and Rregion is the corresponding difference of the regional 20% emission perturbation simulation and the base simulation. The metric can be applied to a range of quantities, including surface concentrations, column amounts, and derived parameters.
9 10 11 12 13 14 15
A low (i.e. near 0) RERER value means that the signal within a region is not very sensitive to extra-regional emission reductions, and that local concentrations (or column amounts, etc.) depend more on local emission reductions given the current distribution of anthropogenic and biogenic emissions. A high RERER value (i.e. near 1) suggests that local conditions are strongly influenced by emissions changes outside the region. In some circumstances, when emission reductions correspond to increasing concentrations (e.g. ozone titration by NO emissions), RERER can become larger than 1.
9
Atmos. Chem. Phys. Discuss., doi:10.5194/acp-2016-828, 2016 Manuscript under review for journal Atmos. Chem. Phys. Published: 18 October 2016 c Author(s) 2016. CC-BY 3.0 License.
1
2.4 Boundary Conditions for Regional Simulations
2 3 4 5 6
One of the new aspects of HTAP2 experiments is the coupling of global and regional model simulations, including coupled emission perturbation studies. These common experiments are intended to enable the examination of the effects of a) the finer spatial and temporal resolution of regional models and b) the different processes represented in global and regional models.
7 8 9 10 11
In order to “nest” the regional within the global simulations, computational results from one or more global models are needed as boundary conditions for the regional models’ domains (Figure 3), typically provided as a set of time-varying concentrations of medium-to-long-lived components in a 3D box over the respective regional model domains at typical time resolutions of 3 to 6 hours.
12
13
14
15
Figure 3: Domains of the regional model simulations and source receptor areas
16
17 18 19 20 21 22 23 24 25 26 27 28
A small number of the global models participating in HTAP2 provided boundary conditions for regional simulations, the choice depending mostly on existing experiences of regional communities with these particular global models. The global scale simulations that were made available to the regional scale modelers for defining boundary conditions are presented in Table 3. Boundary conditions were provided for both the base case and also for a number of emission perturbation runs. Each of the emissions perturbation experiments with the global models created a new set of boundary conditions that can be used at the regional scale. This nesting is depicted graphically in Figure 4. It shows an example where the HTAP2 source region (in this case, East Asia) is wholly within the regional model domain. The inclusion of the global perturbation simulation (GLOBALL) allows consistent evaluation of the RERER metric (see section 2.3).
29
10
Atmos. Chem. Phys. Discuss., doi:10.5194/acp-2016-828, 2016 Manuscript under review for journal Atmos. Chem. Phys. Published: 18 October 2016 c Author(s) 2016. CC-BY 3.0 License.
1
2 3 4 5 6
Figure 4: Example set of experiments, with both global and regional model (in this case a regional model over East Asia, red box), where the regional source perturbation is East Asia (blue shading), and is wholly within the regional model domain. Note that the magnitude of the emission perturbation in the region of consideration is identical between the global and regional model.
7
8 9 10 11 12 13 14
Regional models where free to use as boundary conditions one or more models as long as they were selected from the set of global models participating in HTAP2 (Table 3), but in practice the AQMEII3 community focused its effort on C-IFS(CB05) (Flemming et al.,2015) calculations. GFDL/AM3 (Lin et al, 2012a,b) and GEOS-Chem (Park et al., 2004, Bey et al., 2001) were additionally used in some North American simulations. GEOS-Chem and CHASER (Sudo et al., 2002; 2007, Watanabe et al., 2011, Sekiya and Sudo, 2014) were the preferred models for the MICS3 consortium.
15
11
Atmos. Chem. Phys. Discuss., doi:10.5194/acp-2016-828, 2016 Manuscript under review for journal Atmos. Chem. Phys. Published: 18 October 2016 c Author(s) 2016. CC-BY 3.0 License.
1
2
Table 3: 2008, 2009 and 2010 HTAP2 Global Runs for Regional Boundary Conditions Model
Spatial Resolution
Temporal Resolution
Chemistry
C-IFS(CB05) (ECMWF)
1.125°x1.125°
3 hourly
CB05
3 hourly
BASE GLOALL CH4INC NAMALL EURALL EASALL
3 hourly
BASE GLOALL CH4INC NAMALL EURALL EASALL
(T159) 54 levels
GFDL/AM3
~1°x1° 48 levels
GEOS-Chem
2.5°x2° 47 levels
CHASER
2.8°x2.8°
3 hourly + daily mean
Simulations BASE GLOALL CH4INC NAMALL EURALL EASALL SASALL
BASE
3
4
5
2.5 Specification of the global and regional scale model outputs
6 7 8 9 10 11 12 13 14 15 16 17
Careful consideration was given to the organization of the model output, given the large number of models, variables requested, and case studies. This required specifications of data formats, variable and file naming conventions, data organization at identified collection points, and the definition of agreed locations where measurements would be available and model data had to be produced for both regional and global models. Further details can be found at http://iek8wikis.iek.fz-juelich.de/HTAPWiki/HTAP-2-data-submission and in Koffi et al. (2016). For HTAP2 and AQMEII3, the experience acquired over the past experiments allowed this massive data handling task to be carried out in an efficient way because data formats, naming conventions and collections points were already well established for these two activities and respective communities of models. For HTAP2 the netCDF (http://www.unidata.ucar.edu/software/netcdf/) with Climate
12
Atmos. Chem. Phys. Discuss., doi:10.5194/acp-2016-828, 2016 Manuscript under review for journal Atmos. Chem. Phys. Published: 18 October 2016 c Author(s) 2016. CC-BY 3.0 License.
1 2 3 4 5 6 7 8 9 10 11 12 13 14 15 16 17
and Forecast (CF) (http://cfconventions.org/) meta data format was adopted. For AQMEII3 the ENSEMBLE data format was used (Galmarini et al. 2012b), allowing easy participation for regional modellers already participating in AQMEII2. Two data repositories were available for the two communities: the AeroCom repository at the Norwegian meteorological institute (MetNo) (aerocom.met.no; Schulz et al., 2009) and the JRC ENSEMBLE (Galmarini et al., 2014) platforms, respectively. Data for MICS3 were handled and analyzed at the Joint International Center on Air Quality Modeling Studies (JICAM) in Beijing, China, a joint cooperation between the Institute of Atmospheric Physics (IAP) of Chinese Academy of Sciences and the Asia Center for Air Pollution Research (ACAP) in Niigata, Japan. These facilities not only allow the organization of the data produced by various sources around the world but also their consultation through web interfaces and the matching of the model results with the available measured data and the statistical comparison of these two pieces of information. A connection and automatic data conversion protocol between the ENSEMBLE and AeroCom platforms was also pioneered to allow the bi-directional transfer of model data and a consistent comparison of global and regional model results with a common set of observations.
18 19 20 21 22 23 24 25 26 27 28 29 30 31 32 33
Global model data from this study can be accessed via the AeroCom data server at MetNo. Data are organised such that the HTAP2 model version, experiment, period, and variable name can be identified readily from directory and file names. Model output providers have to register at the database provider MetNo and are provided with access to a linux server via ssh (see further details at https://wiki.met.no/aerocom/user-server). This server also provides essential and standard data inspection, analysis and extraction tools for netCDF files (ncdump, ncview, python, nco, cdo, etc.). Users may utilize these tools to retrieve files, or subsets of them for further analysis. All incoming files are processed with the AeroCom visualization tools to generate “quick look” images for initial inspection. All variables are plotted as fields for major regions, each month and season. Where available, comparisons are made to surface observations, mainly those from the EBAS database maintained by NILU (ebas.nilu.no) and from Aeronet (http://aeronet.gsfc.nasa.gov). The quick look images are publicly available via the web interface at http://aerocom.met.no/cgibin/aerocom/surfobs_annualrs.pl?PROJECT=HTAP&MODELLIST=HTAP-phaseII-ALL.
34 35 36 37 38 39 40
To facilitate the comparability of model results with measured data, the former were requested as time series at surface locations, or vertical profiles, mostly located in Europe and North America, enabling the comparison of the AQMEII3 and HTAP2 experiments. Model results were requested in various forms. Specifically, 4128 surface stations were identified for the comparison of gas phase species, 2068 surface stations were identified for the comparison of aerosol species, and 240 stations were identified for the evaluation of vertical profiles. These locations are a 13
Atmos. Chem. Phys. Discuss., doi:10.5194/acp-2016-828, 2016 Manuscript under review for journal Atmos. Chem. Phys. Published: 18 October 2016 c Author(s) 2016. CC-BY 3.0 License.
1 2
mixture of stations of global and regional significance and spatial representativeness (Figure 5). Details of the data requests for HTAP2 can be found in Koffi et al. (2016).
3 4 5 6 7 8
For AQMEII3, the specifications of requested model variables are contained in the so called AQMEII overarching document (http://ensemble2.jrc.ec.europa.eu/aqmeii/?page_id=527). Model results are also available to participating modelling groups and the wider scientific community through the ENSEMBLE web based platform following the protocol established for phase 1 and 2 of AQMEII (Galmarini and Rao, 2011)
9 10 11 12
MICS3 output includes monthly averaged hourly surface data for O3, NO, NO2, HNO3 and HONO; surface VOC species consistent with the CB05, CBMZ, RADM2 and SAPRC99 mechanisms and Wet/Dry depositions of sulfur and nitrogen components.
13 14 15 16 17 18
To help diagnose the differences between models and isolate different transport processes, we requested that HTAP2 global models also include two passive tracers. These tracers should be emitted in the same quantity as total anthropogenic CO emissions (not including fires) and decay exponentially with uniform fixed mean lifetimes (or e-folding times) of 25 and 50 days, respectively, as in the ChemistryClimate Modelling Initiative (CCMI).
19
14
Atmos. Chem. Phys. Discuss., doi:10.5194/acp-2016-828, 2016 Manuscript under review for journal Atmos. Chem. Phys. Published: 18 October 2016 c Author(s) 2016. CC-BY 3.0 License.
1
2
3
4
5
6 7
Figure 5: Location of the stations where surface gas (top), surface aerosol (middle) and vertical profile (bottom) model outputs are requested.
8
9
3. Conclusions
10 11 12 13 14 15 16
This technical note provides details about the set up of the joint regional-global chemistry-transport emission perturbation experiments, planned and executed within the HTAP2 model exercise. The Task Force Hemispheric Transport Air Pollution falls under the UNECE Convention on Long-range Transboundary Air Pollution and deals with the increasingly important issue of hemispheric transport of air pollution. TF HTAP works in partnership with scientists across the world to improve our understanding of the intercontinental or hemispheric transport and
15
Atmos. Chem. Phys. Discuss., doi:10.5194/acp-2016-828, 2016 Manuscript under review for journal Atmos. Chem. Phys. Published: 18 October 2016 c Author(s) 2016. CC-BY 3.0 License.
1 2
formation of air pollution; its impacts on climate, ecosystems, and human health;, and the potential mitigation opportunities.
3
4 5 6 7 8 9 10 11 12
The major advances of HTAP2 with respect to previous HTAP1 activity are: • a focus on more recent years as a basis for extrapolation (2008-2010), • a larger number of source/receptor regions • In collaboration with the existing regional scale modelling initiatives AQMEII and MICs-ASIA: the use of regional models and consistent boundary conditions from selected global models for Europe, North America, and Asia to provide higher resolution estimates of the impacts of hemispheric transport of air pollution on health, ecosystems and climate.
13 14 15 16 17 18 19 20 21 22 23 24 25 26 27 28 29 30
The multi-model, multi-scale, and multi-pollutant character of the activities performed in HTAP2 required a considerable level of harmonization of the information used to run the model at different scales and of the results produced. Such harmonization considerably facilitates the interpretation of model results and inter-model differences. Particular attention was given to providing coherent emissions and boundary conditions to the global and regional scale models, and harmonising dataset of monitoring data collected to evaluate the model results. To our knowledge such an attempt is unprecedented in the field and constitutes an important starting point for future multiple scale modelling activities. A considerable effort has been made for the harmonization of data formats, and web based data hubs, allowing consultation of model and measurement data by the participants as well as possible external data users with simplicity and having a few “one-stop shops,” where all information is collected geo-referenced and ready to be used. As independently demonstrated in the past, by the ENSEMBLE and AeroCom experiences, such an approach effectively takes away the burden on individual modelling groups of collecting scattered measurement data, and organizing these data sets for comparison with models. Moreover, this approach effectively provides benchmark datasets for objective comparisons across models.
31 32 33 34 35 36 37
While first steps towards fuller integration of protocols, requested outputs, and analysis methods were shared across the three communities, a fully interoperable and harmonised set of global and regional outputs was not yet obtained due to different requirements of the communities. At this stage, the availability of global and regional model outputs and observations at a common set of monitors permits a first analysis of global/regional model performance in the North American and European domains and represents a significant step forward for both communities.
38 39 40
Many of the analyses presented in this special issue draw upon this unique collection of data and tools which is open and available for further analysis. We encourage the scientific community to continue to explore this data to generate scientific and 16
Atmos. Chem. Phys. Discuss., doi:10.5194/acp-2016-828, 2016 Manuscript under review for journal Atmos. Chem. Phys. Published: 18 October 2016 c Author(s) 2016. CC-BY 3.0 License.
1 2
policy-relevant insights and to engage in the future development of the TF HTAP, AQMEII, and MICS-Asia activities.
3
4
5
Acknowledgements
6 7 8 9 10 11 12 13 14 15 16
The AeroCom database at MetNo received support from the LRTAP convention under the EMEP programme, through the service contract to the European commission no. 07.0307/2011/605671/SER/C3, and benefitted from the Norwegian research council project #229796 (AeroCom-P3). JRC received support for this work via Administrative Arrangement AMITO and AMITO2 from the European Commission DG Environment. TF HTAP, AeroCom, AQMEII, and MICS-Asia exist due to the relentless contributions of numerous excellent scientists. Although this work has been reviewed and approved for publication by the U.S. Environmental Protection Agency, it does not necessarily reflect the views and policies of the agency. We thank Dr Mian Chin for her support in designing and promoting the HTAP-AEROCOM experiments.
17
17
Atmos. Chem. Phys. Discuss., doi:10.5194/acp-2016-828, 2016 Manuscript under review for journal Atmos. Chem. Phys. Published: 18 October 2016 c Author(s) 2016. CC-BY 3.0 License.
1
References
2 3 4 5 6
Bey, I., Jacob, D.J., Yantosca, R.M., Logan, J.A., Field, B.D., Fiore, A.M., Li, Q., Liu, H.Y., Mickley, L.J., Schultz, M.G., Global modeling of tropospheric chemistry with assimilated meteorology: model description and evaluation. J. Geophys. Res. D Atmos. 106, 23073e23095, 2001.
7 8 9 10 11 12 13 14 15 16 17 18 19 20 21 22 23 24 25
Diehl, T., A. Heil, M. Chin, X. Pan, D. Streets, M. Schultz, and S. Kinne, Anthropogenic, biomass burning, and volcanic emissions of black carbon, organic carbon, and SO2 from 1980 to 2010 for hindcast model experiments, Atmos. Chem. Phys. Discuss., 12, 24895-24954, doi:10.5194/acpd-12-24895-2012, 2012. Flemming, J., V. Huijnen, J. Arteta, P. Bechtold, A. Beljaars, A.M. Blechschmidt, M. Diamantakis, R. J. Engelen, A. Gaudel, A. Inness, L. Jones, B. Josse, E. Katragkou, V. Marecal, V.-H. Peuch, A. Richter, M. Schultz, O. Stein, A. Tsikerdekis, Tropospheric chemistry in the Integrated Forecasting System of ECMWF, Geoscientific Model Develop, 8, 4, 975/1003, 2015. Fu, J.S., C.J. Jang, D.G. Streets, Z. Li, R. Kwok, R. Park, Z. Han, MICS-Asia II: Modeling gaseous pollutants and evaluating an advanced modeling system over East Asia, Atmospheric Environment 42 3571–3583, 2008. Galmarini, S., and S. T. Rao, The AQMEII two-continent Regional Air Quality Model evaluation study: Fueling ideas with unprecedented data, Atmospheric Environ, 45, 2464, http://dx.doi.org/10.1016/j.atmosenv.2011.03.025, 2011.
26 27
Galmarini S., S.T. Rao, D.G. Steyn, Preface to the AQMEII p1 Special issue, Atmos. Environ, 53, 1-3,2012a.
28 29 30 31 32
Galmarini, S., Bianconi, R., Appel, W. Solazzo, E. Mosca, S. Grossi, P. Moran, M. Schere, K. Rao, S.T., ENSEMBLE and AMET: Two systems and approaches to a harmonized, simplified and efficient facility for air quality models development and evaluation, Atmospheric Environ, 53, 51-59, 2012b.
33 34
Galmarini S., C. Hogrefe, D. Brunner, P. Makar, A. Baklanov, Preface to the AQMEII p2 Special issue, Atmos. Environ., 115, 340-344, 2015.
35 36 37 38 39 40 41 42 43
IPCC, Climate Change 2013: The Physical Science Basis. Contribution of Working Group I to the Fifth Assessment Report of the Intergovernmental Panel on Climate Change . Stocker, T.F., D. Qin, G.-K. Plattner, M. Tignor, S.K. Allen, J. Boschung, A. Nauels, Y. Xia, V. Bex and P.M. Midgley (eds.). Cambridge University Press, Cambridge, United Kingdom and New York, NY, USA, 1535 pp, 2013. Janssens-Maenhout, G., M. Crippa, D. Guizzardi, F. Dentener, M. Muntean, G. Pouliot, T. Keating, Q. Zhang, J. Kurokawa, R. Wankmuller, H. Denier van der Gon, J.J. Kuenen, Z. Klimont, G. Frost, S. Darras, B. Koffi, M. Li: HTAP_v2.2: a mosaic of 18
Atmos. Chem. Phys. Discuss., doi:10.5194/acp-2016-828, 2016 Manuscript under review for journal Atmos. Chem. Phys. Published: 18 October 2016 c Author(s) 2016. CC-BY 3.0 License.
1 2 3 4 5 6 7 8 9 10 11 12 13 14 15 16 17 18 19 20 21 22 23 24 25
regional and global emission grid maps for 2008 and 2010 to study hemispheric transport of air pollution, Atmospheric Chemistry and Physics, 15, 11411-11432, 2015. Koffi B., F. Dentener, G. Janssens-Maenhout, D. Guizzardi, M. Crippa, T. Diehl, S. Galmarini, E. Solazzo, Hemispheric Transport Air Pollution (HTAP): Specification of the HTAP2 experiments – Ensuring harmonized modelling, EUR - Scientific and Technical Research Reports, 2016, in preparation. Lana A., T. G. Bell, R. Simó, S. M. Vallina, J. Ballabrera-Poy, A. J. Kettle, J. Dachs, L. Bopp, E. S. Saltzman, J. Stefels, J. E. Johnson, and P. S. Liss , An updated climatology of surface dimethylsulfide concentrations and emission fluxes in the global ocean, Glob. Biogeochem. Cycles, 25, GB1004, doi:10.1029/2010GB003850, 2011. Li, M., Zhang, Q., Kurokawa, J., Woo, J.-H., He, K. B., Lu, Z., Ohara, T., Song, Y., Streets, D. G., Carmichael, G. R., Cheng, Y. F., Hong, C. P., Huo, H., Jiang, X. J., Kang, S. C., Liu, F., Su, H., and Zheng, B., MIX: a mosaic Asian anthropogenic emission inventory for the MICS-Asia and the HTAP projects, Atmos. Chem. Phys. Discuss., 15, 34813-34869, doi:10.5194/acpd-15-34813-2015, 2015. Lin, M.Y. . M. Fiore, L. W. Horowitz, O. R. Cooper, V. Naik, J. Holloway, B. J. Johnson, A. M. Middlebrook, S. J. Oltmans, I. B. Pollack, T. B. Ryerson, J. X. Warner, C. Wiedinmyer, J. Wilson, B. Wyman, Transport of Asian ozone pollution into surface air over the western United States in spring. Journal of Geophysical ResearchAtmospheres 117, D00V07,2012a.
26 27 28 29
Lin, M., A. M. Fiore, O. R. Cooper, L. W. Horowitz, A. O. Langford, H. Levy II, B. J. Johnson, V. Naik, S. J. Oltmans, C. J. Senff, Springtime high surface ozone events over the western United States: Quantifying the role of stratospheric intrusions, J. Geophys. Res., 117, D00V22, doi:10.1029/2012JD018151, 2012b.
30 31 32
Maas, R., P. Grennfelt (eds), EMEP Steering Body and Working Group on Effects of the Convention on Long-Range Transboundary Air Pollution. Towards Cleaner Air. Scientific Assessment Report, Oslo. xx+50pp, 2016.
33 34 35 36 37 38 39
Myhre, G., Samset, B. H., Schulz, M., Balkanski, Y., Bauer, S., Berntsen, T. K., Bian, H., Bellouin, N., Chin, M., Diehl, T., Easter, R. C., Feichter, J., Ghan, S. J., Hauglustaine, D., Iversen, T., Kinne, S., Kirkevåg, A., Lamarque, J.-F., Lin, G., Liu, X., Luo, G., Ma, X., Penner, J. E., Rasch, P. J., Seland, Ø., Skeie, R. B., Stier, P., Takemura, T., Tsigaridis, K., Wang, Z., Xu, L., Yu, H., Yu, F., Yoon, J.-H., Zhang, K., Zhang, H., and Zhou, C.: Radiative forcing of the direct aerosol effect from AeroCom Phase II simulations, Atmos. Chem. Phys., 13, 1853-1877, doi:10.5194/acp-13-1853-2013, 2013.
40 41 42
Park, R.J., Jacob, D.J., Field, B.D., Yantosca, R.M., Chin, M., Natural and trans- boundary pollution influences on sulfate-nitrate-ammonium aerosols in the United States: implications for policy. J. Geophys. Res. 109., 2004.
19
Atmos. Chem. Phys. Discuss., doi:10.5194/acp-2016-828, 2016 Manuscript under review for journal Atmos. Chem. Phys. Published: 18 October 2016 c Author(s) 2016. CC-BY 3.0 License.
1 2 3 4 5 6 7
Pouliot, G., H. A.C. Denier van der Gon, J. Kuenen, J. Zhang, M. D. Moran, P.A. Makar, Analysis of the emission inventories and model-ready emission datasets of Europe and North America for phase 2 of the AQMEII project, Atmospheric Environment, Volume 115, Pages 345-360, ISSN 1352-2310, 2015. Rao, S.T., Rohit Mathur, Christian Hogrefe, Terry Keating, Frank Dentener, Stefano Galmarini, Path forward, EM, 2012.
8 9 10 11 12 13 14 15 16 17 18 19 20 21 22 23 24 25 26 27 28 29
Schulz, M., Chin, M., Kinne S., The Aerosol Model Comparison Project, AeroCom, Phase II: Clearing Up Diversity, IGAC Newsletter, No 41, 2009. Sekiya, T., and K. Sudo, Roles of transport and chemistry processes in global ozone change on interannual and multidecadal time scales, J. Geophys. Res., 119, 8, 49034921, 2014. Soares, J., M. Sofiev, J. Hakkarainen, Uncertainties of wild-land fires emission in AQMEII phase 2 case study, Atmospheric Environment, 115, 361-370, http://dx.doi.org/10.1016/j.atmosenv.2015.01.068, 2015. Sudo, K., M. Takahashi, J. Kurokawa, and H. Akimoto CHASER: A global chemical model of the troposphere 1. Model description, J. Geophys. Res., 107, 10.1029/2001JD001113, 2002. Sudo, K., and H.\Akimoto, Global source attribution of tropospheric ozone: longrange transport from various source regions, J. Geophys. Res., 112, D12302, doi:10.1029/2006JD007992, 2007. Task Force Hemispheric Transport of Airpollution, Part A, Ozone and Particulate Matter, F. Dentener, T. Keating and H. Akimoto (eds) Economic Commission for Europe, Air Pollution Studies, 17, ISBN, 978-92-1-117043-6, UNECE, Geneva, 2010a.
30 31 32 33 34 35 36 37 38 39 40
Task Force Hemispheric Transport of Airpollution, Part D, Answers to Policy Relevant Science Questions, Keating T, A. Zuber, F. Dentener, J. Seddon, O.Travnikov, A. Gusev, G.Carmichael, D. Parrish, D. Grano (eds) ISBN 978-92-1117047-4, UNECE, Geneva, 2010b. Watanabe, S., Hajima, T., Sudo,K., Nagashima, T., Takemura, T., Okajima, H., Nozawa, T., Kawase, H., Abe, M., Yokohata, T., Ise, T., Sato, H., Kato, E., Takata, K., Emori, S., and Kawamiya, M., MIROC-ESM 2010: model description and basic results of CMIP520c3m experiments, Geosci. Model Dev., 4, 845-872, doi:10.5194/gmd-4-845-2011, 2011.
41
20