Technical Paper by P.C. Lopes, M.L. Lopes, and M.P. Lopes SHEAR BEHAVIOUR OF GEOSYNTHETICS IN THE INCLINED PLANE TEST – INFLUENCE OF SOIL PARTICLE SIZE AND GEOSYNTHETIC STRUCTURE ABSTRACT: This paper reports the investigation of the shear behaviour of six geosynthetics with two granular soils. The test equipment, soils, and geosynthetics properties are described and the soil-geosynthetic interaction behaviour is studied. The influence of soil particle size, geosynthetic structure, and test method are discussed by analysing the results of inclined plane tests. The main conclusions of the study are as follows: geosynthetic structure has an important influence on the soil-geosynthetic interface friction angle; higher soil-geosynthetic interface friction angles are measured when the geosynthetic surface has significantly sized apertures (e.g., geogrids) or allows the penetration of soil particles into the geosynthetic (e.g., nonwoven, spunbonded geotextiles); geosynthetic surface roughness (e.g., geomembranes) is associated with higher soil-geosynthetic interface friction angles; soil particle size has an important influence on the soil-geosynthetic interface friction angle; broadly graded soils with large average soil particle sizes allow an increase in the soil-geosynthetic interface resistance; the method of test does not significantly influence the soil-geomembrane or soil-geotextile interface friction angles (geosynthetics with continuous surfaces); and the validity of evaluating the soil-geogrid interface resistance using a rigid support (Test method 1) depends on the structure of the geogrid. It is suggested that site conditions is the greatest factor to consider when selecting the most appropriate test method. KEYWORDS: Inclined plane shear, Geogrid, Geotextile, Geomembrane, Interaction, Particle size, Geosynthetic structure, Test method. AUTHORS: P.C. Lopes, Ph.D. candidate, M.L. Lopes, Associate Professor, Department of Civil Engineering, Geotechnical Division, University of Porto, Rua Dr. Roberto Frias, 4200-465 Porto, Portugal, Telephone: 351/22 5081729, Telefax: 351/22 6053868, E-mail:
[email protected]; and M.P. Lopes, Ph.D. candidate, Civil Engineering Division, University of Aveiro, Campus Universitário de Santiago, 3810-193 Aveiro, Portugal, Telephone: 351/234 370941, Telefax: 351/234 370094, E-mail:
[email protected]. PUBLICATION: Geosynthetics International is published by the Industrial Fabrics Association International, 1801 County Road B West, Roseville, Minnesota 551134061, USA, Telephone: 1/612-222-2508, Telefax: 1/612-631-9334. Geosynthetics International is registered under ISSN 1072-6349. DATE: Original manuscript submitted 4 April 2001, revised version received 25 July 2001, and accepted 28 July 2001. Discussion open until 1 April 2002. REFERENCE: Lopes, P.C., Lopes, M.L., and Lopes, M.P., 2001, “Shear Behaviour of Geosynthetics in the Inclined Plane Test – Influence of Soil Particle Size and Geosynthetic Structure”, Geosynthetics International, Vol. 8, No. 4, pp. 327-342.
GEOSYNTHETICS INTERNATIONAL • 2001, VOL. 8, NO. 4
327
LOPES, LOPES, AND LOPES • Shear Behaviour of Geosynthetics in Inclined Plane Tests
1
INTRODUCTION
Inclined plane shear tests are used to characterise the interaction mechanism at soilgeosynthetic interfaces when the relative movement is mainly caused by shearing and the geosynthetic is placed over an inclined surface. With the objective of obtaining additional data on soil-geosynthetic interface behaviour from inclined plane shear tests and the influence of soil particle size and test methodology, the present paper studies the interaction behaviour of a high density polyethylene smooth geomembrane, a high density polyethylene rough geomembrane, a polypropylene nonwoven spun-bonded geotextile, a polypropylene woven geotextile, a high density polyethylene uniaxial geogrid, and a polypropylene biaxial geogrid embedded in two different granular soils, using an inclined plane shear test apparatus. 2
TEST APPARATUS
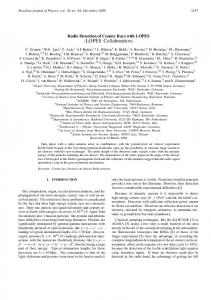
The inclined plane apparatus was developed according to test method prEN ISO 12957-2. The test can be carried out using the following two different methods: 1. with a rigid support for the geosynthetics; and 2. with the geosynthetic supported on a lower box that is filled with soil. In general terms, the inclined plane apparatus (Figures 1 and 2) is structure that can (a)
(b)
Figure 1. Inclined plane apparatus: (a) rigid base and upper box; (b) lower and upper boxes.
328
GEOSYNTHETICS INTERNATIONAL • 2001, VOL. 8, NO. 4
LOPES, LOPES, AND LOPES • Shear Behaviour of Geosynthetics in Inclined Plane Tests
(a)
Upper box
Load application loadapplication
upper box
load cell Load
Inclinometer nometer
cell transducer Transducer
Geosynthetic geosynthetic Inclination system systemof inclination
Upper upper box
(b)
box
rigid base base Rigid
Load application load application load cell cell Load transducer Transducer
inclinometer Inclinometer
geosynthetic
Geosynthetic lower box box Lower system ofsystem inclination Inclination
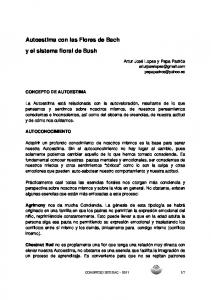
Figure 2. Schematic representation of the inclined plane apparatus: (a) rigid base and upper box; (b) lower and upper boxes.
be disassembled and includes: • •
•
a rigid and smooth base that is 0.620 m long, 0.430 m wide, and 0.010 m high (the geosynthetic is placed on this base for Test method 1); a rigid lower box, with internal dimensions of 0.510 m long, 0.350 m wide, and 0.080 m high that is filled with soil over which the geosynthetic is placed for Test method 2; a rigid upper box, with internal dimensions of 0.300 m long, 0.300 m wide, and 0.080 m high, filled with soil that slides over the geosynthetics.
The rigid base can be raised at a rate of 0.5º/minute (test speed) and lowered, at the end of the test, at the rate of 2º/minute. The apparatus includes three safety devices: • •
one to stop the test when the displacement of the soil-filled upper box exceeds 0.050 m; the other two to stop the base when the maximum inclination of the apparatus is reached and to stop the base at the horizontal position at the end of the test. The displacement of the upper box is measured with a transducer. The inclination
GEOSYNTHETICS INTERNATIONAL • 2001, VOL. 8, NO. 4
329
LOPES, LOPES, AND LOPES • Shear Behaviour of Geosynthetics in Inclined Plane Tests
of the rigid base is measured with an inclinometer, fixed to the base, and recorded in terms of the angle of the inclined plane to the horizontal. This device also allows verification of the horizontality of the base at the start of the test. The geosynthetic is fixed using clamps that are placed outside the contact area and fixed to the base by screws. When performing Test method 1 on more extensible geosynthetics, wrinkles appeared on the geosynthetic surface inhibiting the movement of the upper box. Therefore, two lateral clamps were added although some restriction of geosynthetic deformations at the border could still occur. The normal stress is applied by a rigid steel plate covering the entire internal area of the upper box connected to a hanger with weights. The assurance that the normal force approximately passes through the centre of gravity of the upper box is guaranteed by two wedges inclined 1:2 and placed on the front and back walls of this box. A load cell, located between the load beam and the rigid plate, is used to measure the applied normal force. The upper box slides on rollers in laterally set runners. These lateral plates allow adjustment of the height between the base of the upper box and the geosynthetic specimen such that the upper box itself does not load the specimen, minimising, however, the loss of soil from the box during the test. All measurements (i.e., displacement of the upper box, angle of the inclined plane to the horizontal, and normal force) are recorded with time by an automatic data acquisition system. 3
MATERIALS
3.1
Soils
Two sands, with the particle size distributions shown in Figure 3, were used in the tests. These same soils were used in a previous study and are described in detail by Lopes and Lopes (1999). Soil 1 minimum and maximum unit weight values range from 15.0 to 17.9 kN/m3 for soil particle diameter values that typically range from 0.0074 to 2.00 mm (Figure 3). Soil 2 minimum and maximum unit weight values range from 15.6 to 18.7 kN/m3 for soil particle diameter values that typically range from 0.0074 to 9.54 mm (Figure 3). The physical properties of the two soils are given in Table 1. The relative density values, ID , of Soils 1 and 2 are calculated using the following expression:
γ max γ – γ min I D = ----------- ⋅ ---------------------------- × 100% γ γ max – γ min
(1)
where: γmin and γmax = minimum and maximum soil unit weight values; and γ = unit weight of the soil with a relative density of ID = 50%. Both soils were compacted to a target relative density of ID = 50%. For ID = 50%, γ is equal to 16.32 and 17.01 kN/m3 for Soils 1 and 2, respectively.
330
GEOSYNTHETICS INTERNATIONAL • 2001, VOL. 8, NO. 4
LOPES, LOPES, AND LOPES • Shear Behaviour of Geosynthetics in Inclined Plane Tests
100 90
70 60 Soil 1
50 40
Soil 2
30
Fraction passing (%)
80
20 10 0 0.05
0.1
0.5
1
5
10
Particle size (mm) Figure 3.
Particle size distributions for Soils 1 and 2.
Table 1. Physical properties of the soils used in the test program. γmin
Soil
γmax
(kN/m3)
(kN/m3)
γ(ID=50%) (kN/m3)
D50 (mm)
D10 (mm)
Cu (D60 /D10)
φ* (º)
Soil 1
15.0
17.9
16.32
0.43
0.18
2.94
36.2
Soil 2
15.6
18.7
17.01
1.3
0.44
3.64
49.5
Note:
3.2
*
Soil residual friction angle (at a vertical pressure of 10 kPa) in direct shear.
Geosynthetics
The following geosynthetics were used in the inclined plane test program: 1. 2. 3. 4. 5.
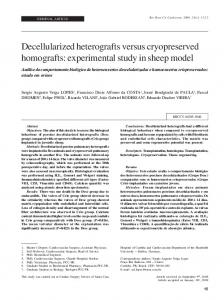
high density polyethylene uniaxial geogrid (Geogrid GG1); polypropylene biaxial geogrid (Geogrid GG2); polypropylene nonwoven, spun-bonded geotextile (Geotextile GT1); polypropylene woven geotextile (Geotextile GT2); 2 mm-thick, high density polyethylene smooth geomembrane (Geomembrane GM1); and 6. 2 mm-thick, high density polyethylene rough geomembrane (Geomembrane GM2). The most significant geosynthetic properties for the present study are presented in Tables 2 to 4 and in Figures 4 and 5. Figures 6 and 7 are photographs of the surfaces of Geotextiles GT1 and GT2 and Geomembranes GM1 and GM2, respectively.
GEOSYNTHETICS INTERNATIONAL • 2001, VOL. 8, NO. 4
331
LOPES, LOPES, AND LOPES • Shear Behaviour of Geosynthetics in Inclined Plane Tests
Table 2. Characteristics of uniaxial Geogrid GG1. Geosynthetic
aL (mm)
aT (mm)
bB (mm)
bR (mm)
tB (mm)
tR (mm)
Tensile strength (kN/m)
Peak strain (%)
Tensile stiffness (kN/m)
Geogrid GG1
160.0
16.0
16.0
6.0
2.7 max 2.5 min
0.9
55.0
11.5
478.3
Table 3. Characteristics of biaxial Geogrid GG2 (MD = machine direction, XMD = crossmachine direction). Geosynthetic
aL aT bLR bTR tJ tLR tTR (mm) (mm) (mm) (mm) (mm) (mm) (mm)
Geogrid GG2
33.0
33.0
2.2
2.5
5.8
2.2
1.4
Tensile strength
Peak MD XMD strain (kN/m) (kN/m) (%) 40.0
40.0
Tensile stiffness (kN/m)
11.5
347.8
Table 4. Characteristics of Geotextiles GT1 and GT2 (MD = machine direction). Geosynthetic
Mass per unit area (g/m2)
Thickness (mm)
Geotextile GT1
800.0
6
50.0
65.0
76.9
Geotextile GT2
600.0
1
70.0
11.5
608.7
4
Tensile strength Peak strain, MD (kN/m) (%)
Tensile stiffness (kN/m)
TEST METHOD
The tests were carried out using the following two methods: 1. with a rigid support for the geosynthetics (Test method 1); and 2. with the geosynthetic supported on a lower box filled with soil (Test method 2). In Test method 1, the specimen is fixed on the rigid base. In Test method 2 the lower box is filled with the same soil and the geosynthetic specimen is placed over the soil and fixed. In both cases, the specimen must be flat and free from folds and wrinkles. The
tR tB aL bB
aT bR
Figure 4.
332
Geometry of uniaxial Geogrid GG1.
GEOSYNTHETICS INTERNATIONAL • 2001, VOL. 8, NO. 4
LOPES, LOPES, AND LOPES • Shear Behaviour of Geosynthetics in Inclined Plane Tests
tJ
tLR
aL
bLR
tTR
aT
bTR Figure 5. Geometry of biaxial Geogrid GG2.
Figure 6. Surfaces of the woven geotextile, Geotextile GT2 (left), and of the nonwoven geotextile, Geotextile GT1 (right).
geosynthetic specimens were 0.70 m long and 0.43 m wide for Test method 1 and 0.60 m long and 0.36 m wide for Test method 2. In Test method 2, the soil was poured into the box from a constant height of 0.20 m and placed in 0.020 m-thick layers. Each layer was levelled and compacted to the required density using a light compacting hammer. Due to the dimensions of the box, it was not possible to control the soil density with a nuclear densimeter. Instead, the soil density was controlled by measuring the soil volume necessary to place the soil in the box with the required unit weight and by defining the soil volume to be used in each layer. After fixing the geosynthetic specimen, the upper box was assembled and aligned in the starting position. The upper box was then filled with soil using procedures simi-
GEOSYNTHETICS INTERNATIONAL • 2001, VOL. 8, NO. 4
333
LOPES, LOPES, AND LOPES • Shear Behaviour of Geosynthetics in Inclined Plane Tests
Figure 7. Surfaces of the smooth geomembrane, Geomembrane GM1 (top), and the rough geomembrane, Geomembrane GM2 (bottom).
lar to the ones used for the lower box. The rigid plate was placed, the load beam was positioned, and the weights were applied. The tests were carried out with a normal stress value of 10kPa. Finally, the test rate was chosen, the horizontality of the base was verified, and the transducer and the inclinometer were set to zero. The test program carried out to study the friction characteristics of the geosynthetics is presented in Table 5. Although 24 tests are reported in Table 5, each one was repeated twice and, thus, a total of 72 tests were carried out. 5
ANALYSIS OF TEST RESULTS
5.1
Introduction
Each test was repeated twice to determine a mean value and to ensure repeatability of the test results. A satisfactory degree of repeatability of test results was achieved as indicated in Figure 8, which shows the variation of the measured upper box displacement with the inclination of the rigid base for the three tests conducted using Geomembrane GM1 specimens under the same conditions. For the three tests, the greatest variation of the measured maximum inclination of the rigid base was 3.3% (0.3% and 3.0% for the other two tests). The maximum value for the coefficient of variation, for all the tests carried out, was approximately 5%.
334
GEOSYNTHETICS INTERNATIONAL • 2001, VOL. 8, NO. 4
LOPES, LOPES, AND LOPES • Shear Behaviour of Geosynthetics in Inclined Plane Tests
Table 5. Summary of the tests carried out in the inclined plane shear test program. Test
Geosynthetic
T1
Geogrid GG1
T2
Geogrid GG2
T3
Geotextile GT1
T4
Geotextile GT2
T5
Geomembrane GM1
T6
Geomembrane GM2
T7
Geogrid GG1
T8
Geogrid GG2
T9
Geotextile GT1
T10
Geotextile GT2
T11
Geomembrane GM1
T12
Geomembrane GM2
T13
Geogrid GG1
T14
Geogrid GG2
T15
Geotextile GT1
T16
Geotextile GT2
T17
Geomembrane GM1
T18
Geomembrane GM2
T19
Geogrid GG1
T20
Geogrid GG2
T21
Geotextile GT1
T22
Geotextile GT2
T23
Geomembrane GM1
T24
Geomembrane GM2
Soil
Test method
Soil 1
1
Soil 1
2
Soil 2
1
Soil 2
2
The data collected from the inclined plane shear tests includes the variation of the upper box displacement with the inclination of the rigid base. The inclination for the maximum upper box displacement (50 mm) provides information regarding the slipping angle of the upper box, β, which allows the derivation of the soil-geosynthetic interface friction angle values, φsg . The normal stress, σn , applied when the slipping angle of the upper box is equal to β can be derived as follows: F v cos β σ n = ------------------A
(2)
where: Fv = vertical force acting on the soil-geosynthetic interface; and A = soil-geosynthetic contact area.
GEOSYNTHETICS INTERNATIONAL • 2001, VOL. 8, NO. 4
335
LOPES, LOPES, AND LOPES • Shear Behaviour of Geosynthetics in Inclined Plane Tests
Displacement (mm)
60
40
20
0 0
10
5
15
20
25
Inclination (º)
Figure 8. Inclined plane shear test results for three tests using Geomembrane GM1.
The shear stress, τ, at the sliding surface is defined as: F v sin β + f ( β ) τ = -------------------------------
(3)
A
where f(β) is the force required to restrain the empty upper box when the tilt table is inclined at the angle β. The soil-geosynthetic interface friction angle values, φsg , can be calculated using the following equation:
τ τtan φ sg = ------ ⇒ φ sg = atan ----σn
5.2
(4)
σn
Influence of Geosynthetic Structure
To evaluate the influence of the geosynthetic structure, the results corresponding to tests carried out with Soil 1 and Test method 1 (Tests T1 to T6 in Table 5) were considered (Table 6). Table 6. Average soil-geosynthetic interface friction angle values obtained using Soil 1 and Test method 1 (Tests T1 to T6 in Table 5). Geosynthetic
Geogrid GG1
Geogrid GG2
Geotextile GT1
φsg (º)
27.6
30.1
32.2
336
Geotextile Geomembrane Geomembrane GT2 GM1 GM2 30.5
21.4
GEOSYNTHETICS INTERNATIONAL • 2001, VOL. 8, NO. 4
31.2
LOPES, LOPES, AND LOPES • Shear Behaviour of Geosynthetics in Inclined Plane Tests
When comparing the results obtained for the two geomembranes, a difference of approximately 46% in φsg values was measured when using a rough material (Geomembrane GM2, with a soil-geosynthetic interface friction angle value of 31.2º) instead of a smooth material (Geomembrane GM1, with a soil-geosynthetic interface friction angle value of 21.4º). The roughness of the surface is responsible for the increasing resistance. For the considered geotextiles, the lowest soil-geosynthetic interface friction value was obtained for the woven material (Geotextile GT2), due to its smoother surface, which is a result of the manufacturing process (where filaments are arranged in the machine direction and in the cross-machine direction). The difference between the soil-geotextile interface friction values for Geotextiles GT1 and GT2 was approximately 6%. The following are interaction mechanisms that can be mobilised in the soil-geogrid interface: (i) skin friction over the planar geogrid surface; (ii) soil-soil friction through the geogrid apertures; and (iii) passive resistance of the geogrid bearing members. When the soil-geogrid interface pullout interaction mechanism occurs, the third mechanism is very important, as shown by Lopes and Lopes (1999). Before analysing the geogrid test results, it is important to consider that, for the inclined plane shear test (as well in the direct shear test), it is not possible to consider the contribution of that mechanism on the soil-geogrid interface resistance. However, the inclined plane shear test provides information on the interface shear resistance mobilized at the soil-geogrid interface when shear is the predominant mechanism of interaction. The soil-geogrid interface friction angle values of 27.6º and 30.1º, which were obtained for Geogrids GG1 and GG2, respectively, indicate that the friction mobilised on the interface is higher for the biaxial (Geogrid GG2) than for the uniaxial geogrid (Geogrid GG1). Geogrid GG1 has a higher lateral solid area when compared with Geogrid GG2; therefore, the more favoured behaviour of Geogrid GG2 can be the result of more effective mobilisation of the friction in the soil underneath, through the biaxial geogrid apertures. Comparing all of the materials tested, the lowest soil-geosynthetic interface friction angle value obtained was 21.4º, which corresponds to Geomembrane GM1 (continuous material with the smoothest surface), while the highest value was 32.2º, which was obtained for Geotextile GT1 (having the roughest surface). Therefore, the structure of the geosynthetic, particularly its roughness, plays a very important role in the soil-geosynthetic interface resistance. 5.3
Influence of Soil Particle Size
Soil particle size is one of the factors affecting the soil-geosynthetic interface behaviour and has been studied by Jewell et al. (1984), Palmeira and Milligan (1989), Jewell (1990, 1996), Boyle and Holtz (1994), Chen and Chen (1994), Forsman and Slunga (1994), and Lopes and Lopes (1999). As in the study presented by Lopes and Lopes (1999), because two different soils are considered, parameters, such as soil unit weight, are distinct and affect the soil-geosynthetic interface behaviour. To minimize this problem, the two soils were placed in the box with the same relative density by adjusting the compaction process.
GEOSYNTHETICS INTERNATIONAL • 2001, VOL. 8, NO. 4
337
LOPES, LOPES, AND LOPES • Shear Behaviour of Geosynthetics in Inclined Plane Tests
The results obtained in the tests carried out on all the geosynthetics, using Test method 1, with Soils 1 and 2 (Tests T1 to T6 and T13 to T18 in Table 5) are presented in Table 7. Geogrids GG1 and GG2 exhibit different behaviour when in contact with either Soils 1 or 2. For Geogrid GG1 in contact with Soil 1, the soil-geosynthetic interface friction angle is 27.6º, while for the Geogrid GG1-Soil 2 interface the value is 29.5º. The Geogrid GG2-Soil 1 interface friction angle is 30.1º, while for the Geogrid GG2Soil 2 interface the value is 33.0º. For both Geogrids GG1 and GG2, there is an increase in the soil-geosynthetic interface friction angle in the tests performed with Soil 2 instead of Soil 1: 6.9 and 9.6%, respectively. This difference is due to the wider soil particle size distribution of Soil 2, which increases the soil-geosynthetic contact surface, and the higher friction angle of Soil 2. The increase of the soil-geogrid interface resistance is larger for Geogrid GG2, due to the reasons discussed in Section 5.2. As in the case of geogrids, there is an increase of the soil-geotextile interface resistance when Geotextiles GT1 and GT2 are in contact with Soil 2 instead of Soil 1. This difference increases with a decreasing roughness of the geotextile surface: 2.2% for Geotextile GT1 and 10.2% for Geotextile GT2. Geomembranes GM1 and GM2 exhibit different behaviours when in contact with either Soils 1 or 2. For the Geomembrane GM1-Soil 1 interface, the soil-geosynthetic interface friction angle is 21.4º, while for the Geomembrane GM1-Soil 2 interface the value is 24.5º. For the Geomembrane GM2-Soil 1 interface, the soil-geosynthetic interface friction angle is 31.2º, while for the Geomembrane GM2-Soil 2 interface the value is 32.9º. For Geomembrane GM1, there is a 14.5% increase in the soil-geosynthetic interface friction angle for the tests performed with Soil 2 instead of Soil 1. This difference is due to the wider soil particle size distribution of Soil 2, which increases the soil-geosynthetic contact surface. The meaningless difference measured for Geomembrane GM2 is justified by the roughness of the geosynthetic surface. The geosynthetic with the large increase in the soil-geosynthetic interface resistance is Geomembrane GM1 (14.5%), the one with the smoothest surface. It is also clear that the less resistant interfaces are Geomembrane GM1 and Geogrid GG1, independent of the soil considered. The most resistant interfaces are Geogrid GG2-Soil 2 and Geotextile GT2-Soil 2 (Soil 2 has a wider soil particle size distribution and a large average soil particle size). Table 7. Average soil-geosynthetic interface friction angle values obtained using Test method 1 and Soils 1 and 2 (Tests T1 to T6 and T13 to T18 in Table 5). Geosynthetic Parameter
φsg (º) ∆φsg (%)
338
Soil
Geogrid GG1
Geogrid GG2
Soil 1
27.6
30.1
32.2
30.5
21.4
31.2
Soil 2
29.5
33.0
32.9
33.6
24.5
32.9
6.9
9.6
2.2
10.2
14.5
5.4
Geotextile Geotextile Geomembrane Geomembrane GT1 GT2 GM1 GM2
GEOSYNTHETICS INTERNATIONAL • 2001, VOL. 8, NO. 4
LOPES, LOPES, AND LOPES • Shear Behaviour of Geosynthetics in Inclined Plane Tests
5.4
Influence of Test Method
To evaluate the influence of the test method, the test results for Soil 1 and Test Methods 1 and 2 (Tests T1 to T12 in Table 5) are considered (Table 8). The results obtained using Geogrid GG2 show a slight variation of the soil-geosynthetic interface friction angle (increase of 2.3%) when using Test method 2 instead of Test method 1. For Geogrid GG1, the increase of the soil-geogrid interface friction angle is higher, approximately 15%, when using Test method 2. These results can be explained as follows: 1. The relationship between aperture area and solid surface area of the two geogrids is larger for Geogrid GG2 than for Geogrid GG1. 2. The joints of Geogrid GG2 exhibit a rebound in the lateral superior and inferior surfaces, while the joints of Geogrid GG1 are perfectly smooth. 3. Using Test method 1 on Geogrid GG2, the rebound in the joints on the lateral inferior surface and the significant lateral open area allow the existence of a thin layer of soil beneath the geogrid. This is similar to the test conditions using Test method 2; when testing Geogrid GG1, this layer of soil is not as significant. 4. The mobilized friction on the geogrid apertures is much lower using Test method 1 on Geogrid GG1 than Test method 2, due to the formation of a soil-polished metal interface and soil-soil interface, respectively. As discussed in Section 5.2, considering Test method 1, the friction angle of the soil-geogrid interface is higher for Geogrid GG2 than for Geogrid GG1. However, it was verified that Test method 2 is more adequate to study soil-geogrid interface resistance, and the conclusion referred in Section 5.2 has to be revised. In fact, using Test method 2, the geogrid that allows the mobilization of higher interface strength is Geogrid GG1 (31.8º) and not Geogrid GG2 (30.8º). The influence of the test method on the results obtained for the geotextiles tested is small. There is an increase in the soil-geotextile interface friction angle value of 3%, for both Geotextiles GT1 and GT2, when using Test method 2 as an alternative to Test method 1. The sensitivity of the geomembranes to the test method is very minimal, decreasing with the roughness of the geomembrane. In fact, there is a 3.7% and 0.3% decrease in the soil-geomembrane interface friction angle for Geomembranes GM1 and GM2, respectively, when Test method 2 is used instead of Test method 1. Table 8. Average soil-geosynthetic interface friction angle values obtained using Soil 1 and Test methods 1 and 2 (Tests T1 to T12 in Table 5). Parameter
φsg (º) ∆φsg (%)
Test method
Geosynthetic Geogrid GG1
Geogrid GG2
Geotextile Geotextile Geomembrane Geomembrane GT1 GT2 GM1 GM2
1
27.6
30.1
32.2
30.5
21.4
31.2
2
31.8
30.8
33.2
31.4
20.6
31.1
15.2
2.3
3.1
3.0
-3.7
-0.3
GEOSYNTHETICS INTERNATIONAL • 2001, VOL. 8, NO. 4
339
LOPES, LOPES, AND LOPES • Shear Behaviour of Geosynthetics in Inclined Plane Tests
As a final remark, it is important to consider the following factors: 1. The influence of the test method is not significant for bi-dimensional continuous geosynthetics structures (geotextiles and geomembranes). 2. In the case of geogrids, with significantly large aperture areas, other issues can control the validity of testing these materials using Test method 1. Therefore, site or project specific characteristics are the most important factors to consider when choosing the most appropriate test method. 6
CONCLUSIONS
The present study considers the influence of geosynthetic structure, soil particle size, and test method on the behaviour of geosynthetics in the inclined plane shear test. The following are the most significant conclusions of this study: • •
•
• • •
• •
Geosynthetic structure has an important influence on the soil-geosynthetic interface friction angle. Geosynthetic surfaces with significantly large apertures (e.g., geogrids) are associated with the mobilisation of soil-soil friction; therefore, higher soil-geosynthetic interface friction angle values are obtained. Geosynthetic surfaces allowing the penetration of soil particles into the geosynthetic (e.g., nonwoven, spun-bonded geotextiles) are associated with higher soil-geosynthetic interface friction angle values. Geosynthetic surface roughness (e.g., geomembranes) is associated with higher soil-geosynthetic interface friction angle values. Soil particle size appears to have an important influence on soil-geogrid interface friction angle values. Broadly graded soils with larger average soil particle sizes allow an increase in the soil-geosynthetic interface resistance that is more significant to smooth geosynthetic surfaces. The choice of test method does not affect the soil-geomembrane or soil-geotextile interface friction angle values obtained (geosynthetics with continuous surfaces). The validity of evaluating the soil-geogrid interface resistance using Test method 1 depends on the structure of the geogrid. It is suggested that site or project specific characteristics are the most important factors to consider when closing the most appropriate test method.
REFERENCES Boyle, S.R. and Holtz, R.D., 1994, “Deformation Characteristics of GeosyntheticReinforced Structures”, Proceedings of the Fifth International Conference on Geotextiles, Geomembranes and Related Products, Vol. 1, Singapore, pp. 361-364. Chen, R.-H. and Chen, C.-C., 1994, “Investigation of Pull-Out Resistance of Geo-
340
GEOSYNTHETICS INTERNATIONAL • 2001, VOL. 8, NO. 4
LOPES, LOPES, AND LOPES • Shear Behaviour of Geosynthetics in Inclined Plane Tests
grids”, Proceedings of the Fifth International Conference on Geotextiles, Geomembranes and Related Products, Vol. 1, Singapore, pp. 461-464. Forsman, J. and Slunga, E., 1994, “The Interface Friction and Anchor Capacity of Synthetic Georeinforcements”, Proceedings of the Fifth International Conference on Geotextiles, Geomembranes and Related Products, Vol. 1, Singapore, pp. 405-410. Jewell, 1990, “Reinforced Bond Capacity”, Geotechnique, Vol. 40, No. 3, pp. 513-518. Jewell, 1996, “Soil Reinforcement with Geotextiles”, CIRIA and Thomas Telford Ltd, London, United Kingdom, 332 p. Jewell, R.A., Milligan, G.W.E., Sarsby, R.W., and Dubois, D., 1984, “Interaction Between Soil and Geogrids”, Polymer Grid Reinforcement, Thomas Telford Ltd., Proceedings of a conference held in London, United Kingdom, March 1984, pp. 18-30. Lopes, M.J. and Lopes, M.L., 1999, “Soil-Geosynthetic Interaction – Influence of Soil Particles Size and Geosynthetic Structure”, Geosynthetics International, Vol. 6, No. 4, pp. 261-282. Palmeira, E.M. and Milligan, G.W.E., 1989, “Scale and Other Factors Affecting the Results of Pull-Out Tests of Grids Buried in Sand”, Geotechnique, Vol. 39, No. 3, pp. 511-524. prEN ISO 12957-2, “Geotextiles and geotextiles-related products - Determination of friction characteristics – Part 2: inclined plane method”. NOTATIONS Basic SI units are given in parentheses. A
= soil-geosynthetic contact area (m2)
aL
= distance between uniaxial geogrid bearing members, or distance between biaxial geogrid ribs (m)
aT
= aperture width of uniaxial geogrids, or transverse distance between biaxial geogrid ribs (m)
bB
= width of uniaxial geogrid bearing members (m)
bLR
= width of biaxial geogrid longitudinal members (m)
bR
= width of uniaxial geogrid longitudinal members (m)
bTR
= width of biaxial geogrid transverse members (m)
Cu
= coefficient of uniformity (dimensionless)
D10
= particle diameter corresponding to 10% by weight of finer particles (m)
D50
= particle diameter corresponding to 50% by weight of finer particles (m)
GEOSYNTHETICS INTERNATIONAL • 2001, VOL. 8, NO. 4
341
LOPES, LOPES, AND LOPES • Shear Behaviour of Geosynthetics in Inclined Plane Tests
D60
= particle diameter corresponding to 60% by weight of finer particles (m)
Fv
= vertical force acting on soil-geosynthetic interface (N)
f(β)
= force required to restrain the empty upper box at inclination of β (N)
ID
= relative density of soil (%)
tB
= thickness of uniaxial geogrid bearing members (m)
tJ
= thickness of biaxial geogrid junctions (m)
tLR
= thickness of biaxial geogrid longitudinal ribs (m)
tR
= thickness of uniaxial geogrid ribs (m)
tTR
= thickness of biaxial geogrid transverse ribs (m)
β
= slipping angle of upper box (º)
φ
= internal friction angle of soil (º)
φsg
= friction angle of soil-geosynthetic interface (º)
γ
= unit weight of soil (N/m3)
γ(ID = 50%) = unit weight of soil at relative density of 50% (N/m3) γmax
= maximum unit weight of soil (N/m3)
γmin
= minimum unit weight of soil (N/m3)
σn
= normal stress (N/m2)
τ
= shear stress (N/m2)
342
GEOSYNTHETICS INTERNATIONAL • 2001, VOL. 8, NO. 4