nanomaterials Article
Temperature-Dependent Magnetic Response of Antiferromagnetic Doping in Cobalt Ferrite Nanostructures Adeela Nairan 1, *, Maaz Khan 2 , Usman Khan 3 , Munawar Iqbal 1 , Saira Riaz 4 and Shahzad Naseem 4 1 2 3 4
*
Centre for High Energy Physics, University of the Punjab, Lahore 54000, Pakistan;
[email protected] Nanomaterials Research group, Physics Division, Pakistan Institute of Nuclear Science and Technology, Nilore, Islamabad 45650, Pakistan;
[email protected] Institute of Physics, Chinese Academy of Sciences, Beijing 100190, China;
[email protected] Centre for excellence in Solid State Physics, University of the Punjab, Lahore 54000, Pakistan;
[email protected] (S.R.);
[email protected] (S.N.) Correspondence:
[email protected]; Tel.: +92-423-583-9387
Academic Editor: Yurii Gun’ko Received: 22 December 2015; Accepted: 11 March 2016; Published: 18 April 2016
Abstract: In this work Mnx Co1´x Fe2 O4 nanoparticles (NPs) were synthesized using a chemical co-precipitation method. Phase purity and structural analyses of synthesized NPs were performed by X-ray diffractometer (XRD). Transmission electron microscopy (TEM) reveals the presence of highly crystalline and narrowly-dispersed NPs with average diameter of 14 nm. The Fourier transform infrared (FTIR) spectrum was measured in the range of 400–4000 cm´1 which confirmed the formation of vibrational frequency bands associated with the entire spinel structure. Temperature-dependent magnetic properties in anti-ferromagnet (AFM) and ferromagnet (FM) structure were investigated with the aid of a physical property measurement system (PPMS). It was observed that magnetic interactions between the AFM (Mn) and FM (CoFe2 O4 ) material arise below the Neel temperature of the dopant. Furthermore, hysteresis response was clearly pronounced for the enhancement in magnetic parameters by varying temperature towards absolute zero. It is shown that magnetic properties have been tuned as a function of temperature and an externally-applied field. Keywords: co-precipitation; ferrites; zero field cooled (ZFC) and field cooled (FC) curves; magnetic anisotropy
1. Introduction Magnetic nanomaterials have been given special attention by the scientists due to their countless applications in the recent era of science. However, highly magnetic storage devices, sensors, ferrofluids, magnetic resonance imaging (MRI), transformers, refrigeration system, and several other technological pillars are highly dependent on these materials [1–4]. Magnetic spinel ferrites, on the other hand, have played an important role in these applications because of their thermal and chemical stabilities towards their overall magnetic response. The general representation of ferrites is given by MFe2 O4 , where M stands for metal ion from the 3d transition elements. The unit cell of spinel ferrites consists of 32 oxygen atoms with two lattice sites available for cation distribution i.e., tetrahedral (A) and octahedral (B) lattice sites [5]. Theoretically, divalent ions occupy A sites and trivalent ions occupy B lattice sites in normal spinel structures. However, in the case of an inverse spinel structure half of the trivalent cations (i.e., Fe3+ ) replace divalent ions at tetrahedral sites and the other half replace octahedral sites [6].
Nanomaterials 2016, 6, 73; doi:10.3390/nano6040073
www.mdpi.com/journal/nanomaterials
Nanomaterials 2016, 6, 73
2 of 13
Among spinel ferrites cobalt ferrite (CoFe2 O4 ) has long been the subject of study due to its unique properties, such as high coercivity, large magneto-crystalline anisotropy, moderate saturation magnetization, mechanical stability, large magnetostrictive coefficient, and large mechanical hardness [7]. Cobalt ferrite belongs to the inverse spinel group and it is one of the strongest candidates for various applications like magneto-optic recording material, microwave industries, drug delivery, gas sensors, and solar cells [8–11]. Control of size, morphology, and chemical composition of ferrite NPs allows tailoring its various properties for specific applications. Moreover, substitution of ferrite NPs with different elements can possibly enhance the magnetic characteristics of these materials. Manganese (Mn) ions can have high magnetic properties because of their large magnetic moments (5 µB ) per Mn2+ ion. Previous literature shows that magnetic properties of CoFe2 O4 can be enhanced by substitution of Mn ions [12]. Additionally, due to possessing insulating properties, high TC and uniaxial magnetic anisotropy, these ferrites are considered as good candidate for highly spin-polarized currents, magnetic tunnel junctions (MTJ’s) [13], and spin filtering devices, which consists of a ferromagnetic insulator layer sandwiched between a non-magnetic metallic (NMM) layer and a ferromagnetic metallic (FMM) layer [14]. Several methods have been employed for synthesis of NPs such as sol gel [15], ball milling [16], hydrothermal [17], co-precipitation [18], thermal plasma methods [19], and auto combustion [20]. Among these techniques co-precipitation is an inexpensive, simple, and low-temperature synthesis route of ferrite NPs. In the present work, we synthesized magnetic NPs by substituting 20% Co with Mn ions in CoFe2 O4 using the co-precipitation route. Our earlier studies have already been emphasized on Mn-doped CoFe2 O4 NPs to investigate the room-temperature magnetic response [21]. Recently, we determined the structural- and temperature-dependent magnetic properties of Co0.8 Mn0.2 Fe2 O4 NPs. Magnetic measurements have been performed at low temperatures from 5 K to 400 K to monitor the variation in magnetic properties of NPs. 2. Experimental Section The NPs were synthesized by using a co-precipitation method. The stoichiometric amounts of 0.2 M cobalt chloride (CoCl2 ¨ 6H2 O), manganese chloride (MnCl2 ¨ 4H2 O), and 0.4 M iron chloride (FeCl3 ) were dissolved in distilled water taking 25 mL solution volume for each metal. After combining these solutions, a specific amount of oleic acid (50 µL) was added as a surfactant. 3 M (25 mL) solution of sodium hydroxide (NaOH) was slowly added to the mixture solution until a pH value of 12 was achieved. Reactants were continuously stirred during the process and then the mixture was heated at 80 ˝ C for one hour. At this temperature the co-precipitation reaction takes place and desired ferrite NPs are formed [22]. After completing the reaction, the solution was allowed to cool down to room temperature. The obtained product was washed several times with deionized water and ethanol to remove the organic and inorganic impurities, if present, in the mixture. The solution was then centrifuged for 20 min at 3000 rpm and dried overnight at 100 ˝ C. The dried sample was then ground into a fine powder and annealed at 600 ˝ C for 6 h to obtain pure ferrite NPs. Afterwards, the sample was given a name Co0.8 Mn0.2 Fe2 O4 (CMF). Structural properties of CMF were carried out by recording the X-ray diffraction pattern for 2θ in the range 15˝ –80˝ (XRD: RIGAKU-D/MAX-2400, Beijing, China, Cu Kα, λ = 0.154056 nm), and Fourier transform infrared (FTIR: NICOLET IS-50, Lahore, Pakistan) spectrum to confirm the structure of the NPs. Morphology of the NPs were investigated by transmission electron microscopy (TEM: JEOL 2011, Beijing, China) and energy dispersive X-ray spectroscopy (EDS) integrated with a field emission scanning electron microscope (FE-SEM: HITACHI S-4800, Beijing, China. Temperature-dependent magnetic measurements were done by a physical property measurement system (PPMS: Quantum Design, 9T, Beijing, China) with a maximum applied field of ˘30 kOe.
Nanomaterials 2016, 6, 73
3 of 13
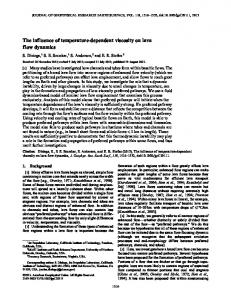
3. Results and Discussion 3.1. Structure and Phase Analysis XRD pattern of the powder sample for CMF is represented in Figure 1. Structural parameters including crystallite size, lattice constant, and X-ray density were calculated from the XRD pattern. The pattern shows diffraction peaks at 2θ = 18˝ , 30˝ , 35˝ , 43˝ , 53˝ , 57˝ , 63˝ , and 74˝ which correspond to (111), (220), (311), (400), (511), and (440) diffraction planes. The obtained3Bragg’s peaks are Nanomaterials 2016, 6,(422), 73 of 12 well matched with the standard JCPDS card No. 22-1086 for CoFe2 O4 . Figure 1 confirms the formation XRD pattern of the powder sample for CMF is represented in Figure 1. Structural parameters of a single-phase inverse spinel without impurity peak. size of NPs was including crystallite size, structure lattice constant, and X-rayany density were calculated fromCrystallite the XRD pattern. Thethe pattern shows diffraction peaks at 2θusing = 18°, 30°, 35°, 43°, 53°, formula 57°, 63°, and[21]: 74° which correspond determined from strongest peak of XRD Scherrer’s to (111), (220), (311), (400), (422), (511), and (440) diffraction planes. The obtained Bragg’s peaks are well matched with the standard JCPDS card No. 22-1086 for CoFe2O4. Figure 1 confirms the formation D “without 0.9λ{βcosθ of a single-phase inverse spinel structure any impurity peak. Crystallite size of NPs was determined from the strongest peak of XRD using Scherrer’s formula [21]:
(1)
0.9λ/βcosθ (1) (FWHM) and where, λ is the wavelength of radiation used, Dβ= and θ is full width at half maximum where, λ is the wavelength of radiation used, andXRD θ is full width at (311) half maximum (FWHM) and peak and the angle of strongest intensity peak, respectively. In βthe pattern was the strongest angle of strongest intensity peak, respectively. In the XRD pattern (311) was the strongest peak and calculated crystallite size was found to be 14.33 nm. the calculated crystallite size was found to be 14.33 nm.
Figure 1. X-ray diffraction (XRD) pattern for spinel Co0.8Mn0.2Fe2O4 (CMF) nanoparticles (NPs).
Figure 1. X-ray diffraction (XRD) pattern for spinel Co0.8 Mn0.2 Fe2 O4 (CMF) nanoparticles (NPs). Lattice constant “a” can be calculated from miller indices (h k l) using the relation [21]: 2 + 𝑘 2 + 𝑙2 (2) 𝑎 =from 𝑑ℎ𝑘𝑙 √ℎ Lattice constant “a” can be calculated miller indices (h k l) using the relation [21]:
where d is the interplanar distance which is calculated from Bragg’s law. The value of lattice constant a for CMF NPs is 8.439 Å. The shortest distance between 2 a “ dhkl h `magnetic k2 ` l 2ions occupied at tetrahedral (A) and octahedral (B) lattice sites considering lattice constant, known as hopping length, can be calculated by using following relation:
(2)
where d is the interplanar distance which isLcalculated from Bragg’s law. The value of(3)lattice constant A = a√3/4 and LB = a√2/4 for CMF NPs is 8.439 Å. The shortest distance between magnetic ions occupied at tetrahedral (A) and Tetrahedral and octahedral bond lengths can also be calculated by using a and oxygen positional parameter u (0.381 Å) values using the following equations [23]: as hopping length, can be calculated by octahedral (B) lattice sites considering lattice constant, known (4) using following relation: ?dAx = a√3 (u − ¼) ? 2 1/2 a 3 a 2 dBx = a[3u − (11/4)u + (43/64)] (5) LA “ and LB “ (3) 4 4 where dAx and dBx represent tetrahedral and octahedral bond lengths, respectively. The calculated and bond length valueslengths for tetrahedral (A) and (B) lattice sites are atabulated in Tetrahedralhopping and octahedral bond can also beoctahedral calculated by using and oxygen positional Table 1. parameter u (0.381 Theoretical Å) values using the following equations [23]: X-ray density can be estimated from XRD pattern using the relation [24]:
? dAx “ a 3 pu ´ 1{4q
(4)
dBx “ ar3u2 ´ p11{4qu ` p43{64qs1/2
(5)
Nanomaterials 2016, 6, 73
4 of 13
where dAx and dBx represent tetrahedral and octahedral bond lengths, respectively. The calculated hopping and bond length values for tetrahedral (A) and octahedral (B) lattice sites are tabulated in Table 1. Theoretical X-ray density can be estimated from XRD pattern using the relation [24]: dx “
ÿ
A NˆV
(6)
where A is the sum of atomic weights of all atoms in the unit cell, N is Avogadro’s number, and V is the volume of the unit cell. In spinel structure each primitive cell consists of eight molecules, so in our case the above relation can be rewritten as: dx “
8M N ˆ a3
(7)
where M is the molecular weight of the nanoparticle and a3 is volume of cubic unit cell. The calculated value of X-ray density of CMF NPs was found to be 5.167 g/cm3 as given in Table 1. Table 1. Structural parameters of 20% Mn substituted CoFe2 O4 nanoparticles calculated from XRD and Fourier transform infrared (FTIR) spectrum. Parameters
Values
Crystallite Size Lattice parameter Tetrahedral hopping length (LA ) Octahedral hopping length (LB ) Tetrahedral bond length (dAx ) Octahedral bond length (dAx ) X-ray density Higher vibrational frequency band (υ1 ) Lower vibrational frequency band (υ2 ) Force constant at A site Force constant at B site
14.33 nm 8.439 Å 3.654 Å 2.983 Å 1.914 Å 2.060 Å 5.167 g/cm3 546.18 cm´1 412.58 cm´1 2.16 ˆ 105 dyne/cm2 1.23 ˆ 105 dyne/cm2
3.2. TEM Analysis TEM images of CMF sample are presented in Figure 2. The micrograph shown in Figure 2a is taken at relatively low magnification in which it is seen that most of the NPs are nearly monodispersed and of spherical shapes with uniform distribution in diameter. The average particle size comes to be 14 nm, which is in good agreement with size inferred from XRD analysis. Furthermore, the selected area electron diffraction (SAED) pattern indicating the polycrystalline nature of the NPs (inset of Figure 2a). The bright rings correspond to different diffraction planes in the single unit cell. Figure 2b shows high resolution TEM (HRTEM) image indicating atomic planes with different orientations in a single nanoparticle. In this case it is seen that every NP has twin boundaries with different atomic planes. To investigate the morphology in detail inverse fast Fourier transformations (IFFTs) have been employed across two different regions of NP as shown in the inset of Figure 2b. The left and right red squares in Figure 2b corresponds to the cubic spinel structure of ferrite. In addition, IFFT corresponds to approximate lattice spacing as shown at the bottom Figure 2b e.g., 2.3 Å (left square) and 2.1 Å (right square).
Nanomaterials 2016, 6, 73 Nanomaterials 2016, 6, 73 Nanomaterials 2016, 6, 73
5 of 12 5 of 13 5 of 12
Figure 2. Transmission electron microscopy(TEM) (TEM) images images showing spherical CMF NPs,NPs, whereas Figure spherical 2. Transmission electron microscopy showing(a)(a) spherical CMF whereas inset corresponds to selected area electron diffraction (SAED) pattern of NPs and (b) high resolution inset corresponds to selected area electron diffraction (SAED) pattern of NPs and (b) high resolution (HRTEM) of single nanoparticle and insets belong to inverse fast Fourier transformation (IFFT) TEM TEM (HRTEM) of single nanoparticle and insets belong to inverse fast Fourier transformation (IFFT) (IFFT) with interplanar distances of two regions of the twin boundary. with interplanar distances of two regions regions of of the the twin twin boundary. boundary.
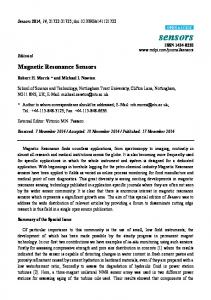
The EDS spectrum of the NPs is shown in Figure 3, which gives the quantitative and qualitative
The EDS of the NPs in Figure 3, gives quantitative and qualitative The EDSofspectrum spectrum the NPs is isofshown shown in The Figure 3, which which gives the quantitative andFe, qualitative analyses chemical of composition the NPs. spectrum shows thethe existence of Co, Mn, and analyses of chemical composition of the NPs. The spectrum shows the existence of Co, Mn, and O in the sample. The EDS graph clearly indicates that the NPs did not contain any impurity elements. analyses of chemical composition of the NPs. The spectrum shows the existence of Co, Mn, Fe,Fe, and O O in the sample. The EDS graph clearly indicates that the NPs did not contain any impurity elements. The inset of Figure 3 shows the elemental composition of synthesized CMF NPs and it can be seen in the sample. The EDS graph clearly indicates that the NPs did not contain any impurity elements. that Co and Mn33are present in 19.56 andcomposition 4.84 weight percent. This gives the presence of these The inset inset ofFigure Figure shows the elemental composition synthesized CMF NPs it can be seen The of shows the elemental of of synthesized CMF NPs andand it can bemetal seen that cations by 80% and 20% ininaccordance with the initial percent. stoichiometric ratio. that Co and Mn are present 19.56 and 4.84 weight This gives the presence of these metal Co and Mn are present in 19.56 and 4.84 weight percent. This gives the presence of these metal cations cations 20% in accordance thestoichiometric initial stoichiometric by 80% by and80% 20%and in accordance with thewith initial ratio. ratio.
Figure 3. Energy dispersive X-ray spectroscopy (EDS) spectrum of spinel CMF NPs.
3.3. FTIR Spectroscopy Figure 3. Energy dispersive X-ray spectroscopy (EDS) spectrum of spinel CMF NPs. Fourier transform infrared (FTIR) spectroscopy was used to investigate the structure and cation distribution between tetrahedral and octahedral lattice sites in inverse spinel ferrite [25]. Figure 4 3.3. FTIR Spectroscopy shows the infrared spectrum of Mn-substituted CoFe2O4 NPs taken at room temperature in ATR mode. Generally, forinfrared spinel ferrite structures, two strong bands (ʋ1, ʋ2the ) appear in theand range Fourier (FTIR) spectroscopy structure cation transform wasabsorption used to investigate −1 [26]. According to spinel structure of ferrites, metal ions are distributed between two of 400–600 cm distribution between tetrahedral tetrahedral and octahedral lattice sites in inverse spinel ferrite [25]. Figure 4 sub-lattices (tetrahedral and octahedral sites) with oxygen as the nearest neighbor. The higher band shows the infrared spectrum of Mn-substituted Mn-substituted CoFe22O O44 NPs NPs taken taken at at room room temperature temperature in in ATR (ʋ1) corresponds to intrinsic stretching vibrations of metal (M–O) at tetrahedral lattice sites, whereas mode. Generally, for spinel spinel ferrite ferrite structures, structures,two twostrong strongabsorption absorptionbands bands(υ(ʋ11,, υʋ22) appear in the range Generally, for the lower band (ʋ2) represents stretching vibrations of metal ions at octahedral lattice sites [27]. In our ´[26]. 1 [26]. −1 of 400–600 According to to spinel structure ferrites, metal ionsions distributed between two 400–600 cm According spinel structure of ferrites, metal are distributed between samplecm the higher band (ʋ1) appears at 546.18 cm−1of while the lower band (ʋare 2) appears at 412.58 cm−1, sub-lattices (tetrahedral and octahedral sites) with oxygen as the nearest neighbor. The higher band two sub-lattices (tetrahedral and octahedral sites) with oxygen as the nearest neighbor. The higher as shown in Figure 4. These absorption bands reveal the formation of the cubic spinel structure, which (ʋ11)) corresponds to intrinsic vibrations (υ corresponds to with intrinsic stretching is in agreement XRDstretching results of the samples. of metal (M–O) at tetrahedral lattice sites, whereas
the lower band (υ (ʋ22)) represents represents stretching stretching vibrations of metal ions at octahedral lattice sites [27]. In our ´−1 1 while sample the higher higher band band υ(ʋ1 )1)appears appearsatat546.18 546.18cm cm while the the lower lowerband band(υ (ʋ22)) appears appears at at412.58 412.58cm cm´−11,, as shown in Figure 4. These These absorption absorption bands reveal the formation of the cubic cubic spinel spinel structure, structure, which is in agreement with XRD results of the samples. samples.
Nanomaterials 2016, 6, 73 2016, 6, Nanomaterials
73
6 of 13
6 of 12
Figure 4. FTIR spectrum of CMF NPs taken in the range from 400 to 4000 cm´1 .
Figure 4. FTIR spectrum of CMF NPs taken in the range from 400 to 4000 cm−1. The difference in vibrational frequency of the higher (υ1 ) and lower (υ2 ) band is attributed to the presence more covalent bonding of Fe3+ –O ionshigher at tetrahedral (A) sites as compared to octahedral The differenceofin vibrational frequency of2´the (ʋ1) and lower (ʋ2) band is attributed to the lattice sites. Furthermore, the splitting3+of absorption band is considered due to presence of different 2− presence of more covalent bonding of Fe –O ions2+at tetrahedral (A) sites as compared to octahedral metal cations on octahedral (B) lattice sites, like Co , Mn2+ , Fe2+ , and Fe3+ [28]. In order to determine lattice sites.the Furthermore, the splitting oflower absorption band is considered to presence strength of bonding at higher and vibrational frequencies we can finddue the force constant at of different 2+ 2+ 2+ 3+ twoon (A octahedral and B) lattice sites. The forcesites, constant these, sites be calculated metal cations (B) lattice likeonCo Mn can , Fe , and Feby using [28]. the In following order to determine relation [29]: the strength of bonding at higher and lower vibrational frequencies we can find the force constant at F “ 4πc2 υ2 m (8)
two (A and B) lattice sites. The force constant on these sites can be calculated by using the following where c is speed of light, υ is vibrational frequency of cations at tetrahedral and octahedral sites, and relation [29]: 3+ 2´
m is reduced mass of Fe and O ions. Based on this equation, the calculated values of vibrational frequencies and force constants at A and B sites are 2 listed 2 in Table 1. (8) 𝐹 = 4π𝑐 ʋ 𝑚 In Figure 4 the peaks obtained in FTIR at 982 cm´1 and 1345 cm´1 are assigned to C–H bending and C–O–C symmetrical stretching vibrations, while the peak observed at 1585 cm´1 originates where c is speed of light, ʋ is vibrational frequency of cations at tetrahedral and octahedral sites, and from C=O stretching vibrations in the spinel structure [30,31]. The appearance of bands around 3+ and O2− ions. Based on this equation, the calculated values of vibrational 1 are m is reduced mass of Fe 2100–2370 cm´ due to the atmospheric CO2 which is absorbed on the surface of NPs during the FTIR measurements [6]. at A and B sites are listed in Table 1. frequencies and force constants
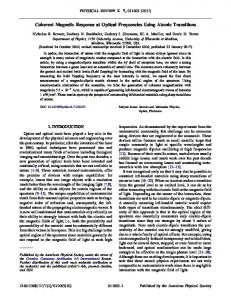
In Figure 4 the peaks obtained in FTIR at 982 cm−1 and 1345 cm−1 are assigned to C–H bending 3.4. Magnetic Analysis and C–O–C symmetrical stretching vibrations, while the peak observed at 1585 cm−1 originates from To get information about magnetic properties of CMF NPs, zero field cooled (ZFC) and field C=O stretching in thecurves spinel structure [30,31]. The appearance ofKbands cooledvibrations (FC) magnetization were recorded in the temperature range of 5–400 with anaround applied 2100–2370 −1 fieldto varying 1 kOe to 10 kOe. and FCismagnetization under the applied 1 kOe, cm are due the from atmospheric CO2ZFC which absorbed curves on the surface of field NPsofduring the FTIR 5 kOe, and 10 kOe are represented in Figure 5a–c, respectively. measurements [6]. 3.4. Magnetic Analysis To get information about magnetic properties of CMF NPs, zero field cooled (ZFC) and field cooled (FC) magnetization curves were recorded in the temperature range of 5–400 K with an applied field varying from 1 kOe to 10 kOe. ZFC and FC magnetization curves under the applied field of 1 kOe, 5 kOe, and 10 kOe are represented in Figure 5a–c, respectively.
Nanomaterials 2016, 6, 73 2016, 6, Nanomaterials
73
7 of 13
7 of 12
Figure 5. Zero field cooled-field cooled (ZFC-FC) curves of CMF at H = (a) 1kOe; (b) 5kOe; and
Figure 5. Zero(c)field cooled-field cooled (ZFC-FC) curves of CMF at H = (a) 1kOe; (b) 5kOe; and (c) 10kOe. 10kOe. The irreversibility in and ZFC and curvesoccurred occurred at at 288288 K and at 5 kOe kOe, The irreversibility in ZFC FC FC curves K 224 andK 224 K atand 5 10 kOe and 10 kOe, respectively, and above the mentioned temperature, the NPs showed a super-paramagnetic state respectively, and above the mentioned temperature, the NPs showed a super-paramagnetic state as as shown in Figure 5b,c. It is reported in literature that flattening in FC curves after bifurcation shown in Figure 5b,c. It is reported in literature that flattening in FC curves after bifurcation represents interparticle coupling, whereas an increase in the FC curve depicts non-interactions between represents the interparticle whereas increase in the FC incurve non-interactions particles [32].coupling, In the present case it is an observed that magnetization the FCdepicts curve increases temperature K, 80 K, and 50 1 kOe, 5 kOe,that and 10 kOe, respectively, which between themonotonically particles at [32]. In theď116 present case it Kisatobserved magnetization in the FC curve corresponds to non-interacting regions. Below these regions, flattening in FC curves corresponds to increases monotonically at temperature ≤116 K, 80 K, and 50 K at 1 kOe, 5 kOe, and 10 kOe, interactions. These interactions might be attributed to the AFM dopant (Mn) with cobalt ferrite, since respectively, corresponds regions. Below these regions, flattening in FC thewhich Neel temperature of Mn isto 116non-interacting K [33]. In Figure ZFC magnetization a sharpmight cusp at be 5 kOe and 10 kOetoapplied field at curves corresponds to 5b,c interactions. These exhibits interactions attributed the AFM dopant (Mn) 290 ˘ 5 K and 220 ˘ 5 K, respectively. This peak point is known as the blocking temperature (Tb ); after with cobalt ferrite, since the Neel temperature of Mn is 116 K [33]. this sharp peak magnetization tends to fall rapidly. The sudden decrease in the magnetization of ZFC In Figure 5b,c ZFC magnetization exhibits a sharp cusp at 5 kOe and 10 kOe applied field at 290 ± 5 K and 220 ± 5 K, respectively. This peak point is known as the blocking temperature (Tb); after this sharp peak magnetization tends to fall rapidly. The sudden decrease in the magnetization of ZFC after Tb is attributed to spin glass behavior of strongly-interacting particles in a magnetic system [34].
Nanomaterials 2016, 6, 73
8 of 13
after Tb is attributed to spin glass behavior of strongly-interacting particles in a magnetic system [34]. However, in the case of the ZFC-FC curve at 1kOe no sharp cusp and fine coincidence/irreversibility point has been observed up to 400 K. This observation helps to understand the dependence of bifurcation and blocking temperature on the applied field. This suggests that with an increase in cooling field the ZFC-FC cycles becomes broader, and Tb and Tirr shift towards lower temperatures. This behavior typically identifies the super-paramagnetism below Tirr and strong dipolar interactions among the particles [35]. Figure 6 represents magnetic hysteresis (M–H) loops of synthesized NPs under a FC state with an applied field of 1 kOe. The inset of the figure shows detailed hysteresis loops near the origin, at different temperatures, to make coercivity visible. It can be seen from Figure 6 that hysteresis loops show “kink2016, or 6, wasp-waisted” behavior at temperatures below 150 K, while above8 of 150 Nanomaterials 73 12 K this “wasp-waist” effect is negligible. Various reasons have been reported for such type of loops including show “kink orbetween wasp-waisted” behavior at temperatures below 150 while this with “waspmagnetic coupling the two different magnetic phases (i.e.,K,hard Coabove and 150 softKMn) different waist” effect is negligible. Various reasons have been reported for such type of loops including coercivities [36] or reordering of magnetic spins below 150 K under the influence of the applied field. magnetic coupling between the two different magnetic phases (i.e., hard Co and soft Mn) with These spin reorientations are responsible constrained M–H which can be explained by different coercivities [36] or reordering for of magnetic spins on below 150 loop, K under the influence of the considering thefield. domain motion andare pinning of the formed by the directional applied These wall spin reorientations responsible for potential constrainedwells on M–H loop, which can be explained by considering the domain wall motion and pinning the potential wells formed bymay the be the order [37]. This resultantly alters the magnetic properties of theofsamples. Another reason directional order [37]. This resultantly alters the magnetic propertiesoxygen of the samples. Another oxidation of soft magnetic layers in the presence of atmospheric [38]. This typereason of behavior may be the oxidation of soft magnetic layers in the presence of atmospheric oxygen [38]. This type of arises due to a mixture of grain boundaries and combination of magnetic composites possessing behavior arises due to a mixture of grain boundaries and combination of magnetic composites different magnetic properties [39]. In our case we believe that “wasp-waist” behavior in M–H loops possessing different magnetic properties [39]. In our case we believe that “wasp-waist” behavior in arises asM–H a result coexistence 80% Co (hard) 20% Mn phases in theinsamples. loopsof arises as a resultof of coexistence of 80%and Co (hard) and (soft) 20% Mn (soft) phases the samples.
Figure 6. (a) Magnetic hysteresis loops of CMF NPs showing ferromagnetic and wasp-waist shape,
Figure 6. (a) Magnetic hysteresis loops of CMF NPs showing ferromagnetic and wasp-waist shape, taken at various temperatures ranging from 5 to 300 K and (b) extended view of coercivity near the taken at various temperatures ranging from 5 to 300 K and (b) extended view of coercivity near origin. the origin. It is observed that M–H loops presents a noteworthy increase in coercivity and saturation magnetization of the sample as the temperature goes down to 5 K. The calculated values of coercivity It is observed that M–H loops presents a noteworthy increase in coercivity and saturation from M–H loops at different temperatures are shown in Figure 7 (right side). This increasing behavior magnetization of the sample as the temperature goes down to 5 K. The calculated values of coercivity of coercivity can be understood by considering that at low temperature magnetic anisotropy increases from M–H at scatter different temperatures areanisotropic shown infield Figure Thisincreases. increasing behavior andloops particles in the direction of the due 7 to(right which side). coercivity In the of coercivity understood considering at low temperature magnetic anisotropy NPs, can the be effect of thermalbyfluctuations of that blocked moments across the anisotropy barrier increases is responsible for in thethe enhancement [40] at low temperatures. Therefore, with decreasing and particles scatter direction in of coercivity the anisotropic field due to which coercivity increases. In the the reduced thermal fluctuations to makeacross magnetic isotropic, causing an NPs, thetemperature, effect of thermal fluctuations of blockedtend moments themoments anisotropy barrier is responsible increase in coercivity of the system [41].
for the enhancement in coercivity [40] at low temperatures. Therefore, with decreasing temperature, the reduced thermal fluctuations tend to make magnetic moments isotropic, causing an increase in coercivity of the system [41].
Nanomaterials Nanomaterials 2016,2016, 6, 736, 73
9 of 139 of 12
Figure 7. Effect of temperature on coercivity (right side) and saturation magnetization (left side) of
Figure 7. Effect of temperature on coercivity (right side) and saturation magnetization (left side) of CMF NPs. CMF NPs.
The saturation magnetization (M ) of CMF calculated from M–H loops is shown in Figure 7
s The saturation magnetization (Ms) of CMF calculated from M–H loops is shown in Figure 7 (left (left side). At room temperature, magnetization mainly depends on size effects, whereas at low side).temperature At roomsize temperature, magnetization mainly depends on size effects, whereas at low confinement and the quantum effects, spin glass transitions, and thermal dependence temperature size confinement and reason the quantum effects, spin glass of transitions, and from thermal might be considered as the possible for the increase in magnetization NPs [42]. Apart dependence might be considered as the reasonisfor the increase inwave magnetization of NPs this, at the nanoscale, it is assumed thatpossible a nanoparticle quantized of spin excitation. At high [42]. Apart from this,particles at the possess nanoscale, it isenergy assumed nanoparticle is quantized of In spin temperature, broader levelsthat withaa continuous excitation spectrum. suchwave a case the dependence of magnetization can beenergy ascribed, like in bulkamaterials, followed excitation. At temperature high temperature, particles possess broader levels with continuous excitation by Bloch’s law [43]. While low temperatures it is considered that at finite size spectrum. In such a case the at temperature dependence of magnetization can benanoparticles’ ascribed, likelong in bulk spin waves’ excitations cannot propagate, so the spectrum becomes discrete, which can be attributed materials, followed by Bloch’s law [43]. While at low temperatures it is considered that at finite size to the increase in magnetization at low temperature. behaviorso can be spectrum explained from following nanoparticles’ long spin waves’ excitations cannot This propagate, the becomes discrete, equation [44]: „ which can be attributed to the increase in magnetization at low temperature. This behavior can be E E p´ K 1T q p´ K 2T q B B Ms pTq “ Ms p0q ´ C e ` e (9) explained from following equation [44]:
𝐸 Ms (0) is magnetization 𝐸 where Ms (T) is temperature-dependent magnetization, at 0 K, C is constant (−𝐾 1𝑇 ) (−𝐾 2𝑇) 𝐵 ( ) ( ) 𝑀𝑠 𝑇 on=number 𝑀𝑠 0of−modes 𝐶 [𝑒 (N), and+occupancy 𝑒 𝐵 state ] (n), E1 and E2 denotes (9) (C= Ms (0)/Nn), depending energy levels, and KB is the Boltzman constant. This shift in the spin wave spectrum relative to the temperature can alter the population inmagnetization, magnetic energyM levels and, resultantly, magnetic response where Ms (T) is temperature-dependent s (0) is magnetization at 0 K, C is constant increases as indicated by the FC curve. (C= Ms(0)/Nn), depending on number of modes (N), and occupancy state (n), E1 and E2 denotes energy Magnetic per formula unit (nBThis ) of CMF different can berelative calculated levels, and KB is moment the Boltzman constant. shiftNPs in atthe spin temperatures wave spectrum to the by using following relation [45]: temperature can alter the population in magnetic energy levels and, resultantly, magnetic response M ˆ Ms nB “ (10) increases as indicated by the FC curve. 5585
Magnetic per formula (nB) of CMF M NPs at different temperatures can be calculated where M is moment the molecular weight ofunit the nanoparticle, s is the saturation magnetization measured at by using following relation [45]: different temperatures. As in ferrites, magnetization strongly depends on cationic distribution between tetrahedral (A) and octahedral (B) sites and the spins in these sites are oppositely aligned, leading
𝑛𝐵 =
𝑀 × 𝑀𝑠 5585
(10)
where M is the molecular weight of the nanoparticle, Ms is the saturation magnetization measured at different temperatures. As in ferrites, magnetization strongly depends on cationic distribution between tetrahedral (A) and octahedral (B) sites and the spins in these sites are oppositely aligned, leading these materials to act ferromagnetically in nature. Similarly, the effective anisotropy constant
Nanomaterials 2016, 6, 73
10 of 13
these materials to act ferromagnetically in nature. Similarly, the effective anisotropy constant (K) of the NPs can be calculated at different temperatures using the relation [46]: Hc “
Ke f f ˆ 0.96 Ms
(11)
where Hc is the coercivity and Ms is the saturation magnetization at a particular temperature. According to the above relation, the anisotropy constant has direct relation with the coercivity of the sample. Therefore, with decreasing temperature the effective anisotropy constant, as well as the coercivity of the system, increases. The strong anisotropy of the synthesized sample primarily depends on the presence of Co2+ ions on octahedral (B) sites in the spinel structure [47]. The calculated values of magnetic moment and anisotropy constant at different temperatures are listed in Table 2. Table 2. Temperature-dependent magnetic parameters of Mnx Co1-x Fe2 O4 (x = 0.2) nanoparticles calculated from M–H loops taken from the physical property measurement system. Temperature (K)
Hc (Oe)
Ms (emu/g)
nB (ˆ10´2 )
K ˆ 103 (erg/Oe)
5 10 50 100 150 200 250 300
13,499.75 13,309.22 10,777.68 8724.59 5542.09 2490.22 1625.93 893.41
59.81 59.74 59.55 59.47 58.59 56.68 53.95 50.67
2.503 2.500 2.492 2.489 2.452 2.372 2.258 2.120
841.06 828.22 668.55 540.47 338.24 147.02 91.26 47.15
From Table 2 it is seen that all magnetic parameters (i.e., coercivity, saturation magnetization, magnetic moment, and anisotropy constant) show an increasing trend as the temperature of the system decreases. This is due to the fact that the anisotropy energy is dominating the thermal energy as the temperature of the system drops. 4. Conclusions In this paper the structural and magnetic properties of CMF NPs annealed at 600 ˝ C via a co-precipitation route were investigated. The purity of NPs and crystalline nature was confirmed by XRD measurements. TEM images show ultrafine NPs with uniform morphology. FTIR spectrum shows two absorption bands around 546.18 cm´1 and 412.58 cm´1 which represent intrinsic metal oxide stretching vibrations at tetrahedral and octahedral lattice sites. Magnetic properties were explored as a function of temperature, ranging from 5 to 400 K. The magnetization versus temperature plots under ZFC and FC modes show the shift in blocking temperature with an increase in the applied field. The high magnetic properties of synthesized NPs suggest that the obtained nanocrystalline magnetic ferrites can be used for practical applications in spintronics. Acknowledgments: We acknowledge Khalid Javed from Department of Physics, Forman Christian College, Lahore, to provide research opportunities for the completion of this research work. Author Contributions: M.I. and U.K. conceived the idea and designed the experiments. N.A., U.K. and M.I. were responsible for experiments, measurements and data analyses. M.K. provided free XRD software for structural analysis. S.R. and S.N. reviewed and commented on the paper. All authors discussed the results and commented on the manuscript. Conflicts of Interest: The authors declare no conflict of interest.
References 1.
Ikenaga, N.; Ohgaito, Y.; Matsushima, H.; Suzuki, T. Role of water vapor in oxidative decomposition of calcium sulfide. Fuel 2004, 83, 671–677.
Nanomaterials 2016, 6, 73
2. 3. 4.
5. 6. 7.
8.
9.
10. 11. 12. 13. 14.
15. 16. 17. 18. 19. 20. 21.
22. 23.
11 of 13
Jung, C.W.; Jacobs, P. Physical and chemical properties of superparamagnetic iron oxide MR contrast agents: Ferumoxides, ferumoxtran, ferumoxsil. Magn. Reson. Imaging 1995, 13, 661–674. [CrossRef] Liu, J.P.; Fullerton, E.; Gutfleisch, O.; Sellmyer, D.J. Nanoscale Magnetic Materials and Applications; Springer: New York, NY, USA, 2009; Volume 7, pp. 1032–1034. Brusentsov, N.A.; Gogosov, V.V.; Brusentsova, T.N.; Sergeev, A.V.; Jurchenko, N.Y.; Kuznetsov, A.A.; Kuznetsov, O.A.; Shumakov, L.I. Evaluation of ferromagnetic fluids and suspensions for the site-specific radiofrequency-induced hyperthermia of MX11 sarcoma cells in vitro. J. Magn. Magn. Mater. 2001, 225, 113–117. [CrossRef] Li, X.; Ren, P.; Zhang, J.; Zhang, L.; Liu, G. Preparation and Magnetic Properties of Mn-Zn Ferrites by the co-precipitation Method. J. Wuhan Uni. Tech. Univ. Technol. Mater. Sci. 2009, 24, 875–878. [CrossRef] Sangmanee, M.; Maensiri, S. Nanostructures and magnetic properties of cobalt ferrite (CoFe2 O4 ) fabricated by electrospinning. Appl. Phys. A 2009, 97, 167–177. [CrossRef] Shobaky, G.A.; Turky, A.M.; Mostafa, N.Y.; Mohamed, S.K. Effect of preparation conditions on physicochemical, surface and catalytic properties of cobalt ferrite prepared by coprecipitation. J. Alloy. Compd. 2010, 493, 415–422. [CrossRef] Cheng, F.X.; Jia, J.T.; Xu, Z.G.; Biao, Z.; Liao, C.S.; Yan, C.H.; Chen, L.Y.; Zhao, H.B. Microstructure, magnetic, and magneto-optical properties of chemical synthesized Co–RE (RE=Ho, Er, Tm, Yb, Lu) ferrite nanocrystalline films. J. Appl. Phys. 1999, 86, 2727–2732. [CrossRef] Yan, C.; Cheng, F.; Liao, C.; Kuang, J.; Xu, Z.; Chen, L.; Zhao, H.; Liu, Z.; Wang, Y.; Zhu, T.; et al. Sol-gel synthesis, magnetic and magneto-optical properties of CoFe2´x Tbx O4 nanocrystalline films. J. Magn. Magn. Mater. 1999, 192, 396–402. [CrossRef] Kamble, R.B.; Mathe, V.L. Nanocrystalline nickel ferrite thick film as an efficient gas sensor at room temperature. Sens. Actuators B 2008, 131, 205–209. [CrossRef] Darshane, S.L.; Suryavanshi, S.S.; Mulla, I.S. Nanostructured nickel ferrite: A liquid petroleum gas sensor. Ceram. Int. 2009, 35, 1793–1797. [CrossRef] Ramana, C.V.; Kolekar, Y.D.; Kamala, B.K.; Sinha, B.; Ghosh, K. Correlation between structural, magnetic, and dielectric properties of manganese substituted cobalt ferrite. J. Appl. Phys. 2013, 114. [CrossRef] Cibert, J.; Bobo, J.-F.; Lüders, U. Development of new materials for spintronics. C. R. Phys. 2005, 6, 977–996. [CrossRef] Atsufumi, H.; Hiroaki, S.; Hideto, Y.; Zutic, I.; Seki, T.; Mizukami, S.; Swaminathan, R. Roadmap for Emerging Materials for Spintronic Device Applications. Available online: http://arxiv.org/ftp/ arxiv/papers/1509/1509.08997 (accessed on 16 September 2015). Wang, L.; Zhou, Q.; Li, F. Ionic disorder and Yaffet-Kittel angle in nanoparticles of ZnFe2 O4 prepared by sol-gel method. Phys. Status Solidi B 2004, 241, 377–382. [CrossRef] Yao, C.; Zang, Q.; Goya, F.G.; Torres, T.; Liu, J.; Wu, H.; Ge, M.; Zeng, Y.; Wang, Y.; Jiang, J.Z. ZnFe2 O4 Nanocrystals: Synthesis and Magnetic Properties. J. Phys. Chem. C 2007, 111, 12274–12278. [CrossRef] Hu, X.; Guan, P.; Yan, X. Hydrothermal synthesis of nano-meter microporous zinc ferrite. China Particuol. 2004, 2, 135–137. [CrossRef] Kundu, A.; Upadhyay, C.; Verma, H. Magnetic properties of a partially inverted zinc ferrite synthesized by a new coprecipitation technique using urea. Phys. Lett. A 2003, 311, 406–410. [CrossRef] Nawale, A.B.; Kanhe, N.S.; Patil, K.R.; Bhoraskar, S.V.; Mathe, V.L.; Das, A.K. Magnetic properties of thermal plasma synthesized nanocrystalline nickel ferrite (NiFe2 O4 ). J. Alloy. Compd. 2011, 509, 4404–4413. [CrossRef] Zhang, R.; Huang, J.; Zhao, J.; Sun, Z.; Wang, Y. Sol-Gel Auto-Combustion Synthesis of Zinc Ferrite for Moderate Temperature Desulfurization. Energy Fuels 2007, 21, 2682–2687. [CrossRef] Adeela, N.; Maaz, K.; Khan, U.; Karim, S.; Nisar, A.; Ahmad, M.; Ali, G.; Han, X.F.; Duan, J.L.; Liu, J. Influence of manganese substitution on structural and magnetic properties of CoFe2 O4 nanoparticles. J. Alloy. Compd. 2015, 635, 533–540. [CrossRef] Maaz, K.; Karim, S.; Lee, K.J.; Jung, M.H. Effect of Zn substitution on the structural and magnetic properties of Ni–Co ferrites. Mater. Chem. Phys. 2012, 133, 1006–1010. [CrossRef] Salunkhe, A.B.; Khot, V.M.; Phadatare, M.R.; Thorat, N.D.; Joshi, R.S.; Yadav, H.M.; Pawar, S.H. Low temperature combustion synthesis and magnetostructural properties of Co–Mn nanoferrites. J. Magn. Magn. Mater. 2014, 352, 91–98. [CrossRef]
Nanomaterials 2016, 6, 73
24.
25.
26.
27.
28. 29. 30. 31.
32. 33. 34. 35. 36. 37. 38. 39. 40. 41. 42. 43. 44. 45.
12 of 13
Karimia, Z.; Mohammadifar, Y.; Shokrollahi, H.; Khameneh, S.H.; Yousefi, G.H.; Karimi, L. Magnetic and structural properties of nano sized Dy-doped cobalt ferrite synthesized by co-precipitation. J. Magn. Magn. Mater. 2014, 361, 150–156. [CrossRef] Rana, S.; Philip, J.; Raj, B. Micelle based synthesis of cobalt ferrite nanoparticles and its characterization using Fourier Transform Infrared Transmission Spectrometry and Thermogravimetry. Mater. Chem. Phys. 2010, 124, 264–269. [CrossRef] Slatineanu, T.; Iordan, A.R.; Palamaru, M.N.; Caltun, A.F.; Gafton, V.; Leontie, L. Synthesis and characterization of nanocrystalline Zn ferrites substituted with Ni. Mater. Res. Bull. 2011, 46, 1455–1460. [CrossRef] Samoila, P.; Slatineanu, T.; Postolache, P.; Iordan, A.R.; Palamaru, M.N. The effect of chelating/combustion agent on catalytic activity and magnetic properties of Dy doped Ni–Zn ferrite. Mater. Chem. Phys. 2012, 136, 241–246. [CrossRef] Trivedi, U.N.; Jani, K.H.; Modi, K.B.; Joshi, H.H. Study of cation distribution in lithium doped nickel ferrite. J. Mater. Sci. Lett. 2000, 19, 1271–1273. [CrossRef] Amer, M.A.; Meaz, T.M.; Kestawy, M.E.; Ghoneim, A.I. Magnetic and structural studies of trivalent Co-substituted Cd–Mn ferrites. J. Magn. Magn. Mater. 2016, 405, 137–144. [CrossRef] Park, Y.; Ito, Y.; Imanishi, Y. pH-Controlled gating of a porous glass filter by surface grafting of polyelectrolyte brushes. Chem. Mater. 1997, 9, 2755–2758. [CrossRef] Zhao, M.; Zhou, Y.; Bruening, M.; Bergbreiter, D.; Crooks, R. Inhibition of Electrochemical Reactions at Gold Surfaces by Grafted, Highly Fluorinated, Hyperbranched Polymer Films. Langmuir 1997, 13, 1388–1391. [CrossRef] Imry, Y.; Ma, S.-K. Random-Field Instability of the Ordered State of Continuous Symmetry. Phys. Rev. Lett. 1975, 35, 1399–1401. [CrossRef] Shu, S.; Strauser, C.G.; Wollan, W.A. Neutron Diffraction by Paramagnetic and Antiferromagnetic Substances. Phys. Rev. 1951, 83, 333–345. Ghosh, B.; Kumar, S.; Poddar, A.; Mazumdar, C.; Banerjee, S.; Reddy, V.R.; Gupte, A. Spin glasslike behavior and magnetic enhancement in nanosized Ni–Zn ferrite system. J. Appl. Phys. 2010, 108. [CrossRef] Rondinone, A.J.; Samia, A.C.S.; Zhang, Z.J. Superparamagnetic Relaxation and Magnetic Anisotropy Energy Distribution in CoFe2 O4 Spinel Ferrite Nanocrystallites. J. Phys. Chem. B 1999, 103, 6876–6880. [CrossRef] Wasilewski, P.J. Magnetic hysteresis in natural materials. Earth Planet. Sci. Lett. 1973, 20, 67–74. [CrossRef] Gao, Q.; Hong, G.; Ni, J.; Wang, W.; Tang, J.; He, J. Uniaxial anisotropy and ovel magnetic behaviours of CoFe2 O4 nanoparticles prepared in a magnetic field. J. Appl. Phys. 2009, 105. [CrossRef] Heisz, S.; Hilscher, G. The origin of graduated demagnetization curves of NdFeB magnets. J. Magn. Magn. Mater. 1987, 67, 20–28. [CrossRef] Roberts, A.P.; Cui, Y.; Verosub, K.L. Wasp-waisted hysteresis loops: Mineral magnetic characteristics and discrimination of components in mixed magnetic systems. J. Geophys. Res. 1995, 100, 17909–17924. [CrossRef] Melikhov, Y.; Snyder, J.E.; Jiles, D.C.; Ring, A.P.; Paulsen, J.A.; Lo, C.C.H.; Dennis, K.W. Temperature dependence of magnetic anisotropy in Mn-substituted cobalt ferrite. J. Appl. Phys. 2006, 99. [CrossRef] Koseoglu, Y.; Baykal, A.; Gozuak, F.; Kavas, H. Structural and magnetic properties of Cox Zn1´x Fe2 O4 nanocrystals synthesized by microwave method. Polyhedron 2009, 28, 2887–2892. [CrossRef] Liu, B.; Hu, B.; Zuliang, D. Hydrothermal synthesis and magnetic properties of single-crystalline BiFeO3 nanowires. Chem. Commun. 2011, 47, 8166–8168. [CrossRef] [PubMed] Maaz, K.; Mumtaz, A.; Hasanain, S.K.; Bertino, M.F. Temperature dependent coercivity and magnetization of nickel ferrite nanoparticles. J. Magn. Magn. Mater. 2010, 322, 2199–2202. [CrossRef] Mandal, K.; Mitra, S.; Kumar, P.A. Deviation from Bloch T3/2 law in ferrite nanoparticles. Europhys. Lett. 2006, 75, 618–623. [CrossRef] Toksha, B.G.; Shirsath, S.E.; Mane, M.L.; Patange, S.M.; Jadhav, S.S.; Jadhav, K.M. Autocombustion High-Temperature Synthesis, Structural, and Magnetic Properties of CoCrx Fe2–x O4 (0 ď x ď 1.0). J. Phys. Chem. C 2011, 115, 20905–20912. [CrossRef]
Nanomaterials 2016, 6, 73
46. 47.
13 of 13
Khan, U.; Adeela, N.; Javed, K.; Riaz, S.; Ali, H.; Iqbal, M.; Han, X.F.; Naseem, S. Influence of cobalt doping on structural and magnetic properties of BiFeO3 nanoparticles. J. Nanopart. Res. 2015, 17, 429–436. [CrossRef] Bala, T.; Sankar, C.R.; Baidakova, M.; Osipov, V.; Enoki, T.; Joy, P.A.; Prasad, B.L.V.; Sastry, M. Cobalt and magnesium ferrite nanoparticles: Preparation using liquid foams as templates and their magnetic characteristics. Langmuir 2005, 21, 10638–10643. [CrossRef] [PubMed] © 2016 by the authors; licensee MDPI, Basel, Switzerland. This article is an open access article distributed under the terms and conditions of the Creative Commons Attribution (CC-BY) license (http://creativecommons.org/licenses/by/4.0/).