Temporal Navigation in Dynamic Networks Benjamin Bach, Emmanuel Pietriga, Emmanuel Pietriga, Jean-Daniel Fekete, Jean-Daniel Fekete
To cite this version: Benjamin Bach, Emmanuel Pietriga, Emmanuel Pietriga, Jean-Daniel Fekete, Jean-Daniel Fekete. Temporal Navigation in Dynamic Networks. IEEE Conference on Information Visualization (InfoVis) [Poster], Oct 2012, Seattle, United States. 2012, Electronic Proceedings of IEEE VisWeek 2012.
HAL Id: hal-00781503 https://hal.inria.fr/hal-00781503 Submitted on 27 Jan 2013
HAL is a multi-disciplinary open access archive for the deposit and dissemination of scientific research documents, whether they are published or not. The documents may come from teaching and research institutions in France or abroad, or from public or private research centers.
L’archive ouverte pluridisciplinaire HAL, est destin´ee au d´epˆot et `a la diffusion de documents scientifiques de niveau recherche, publi´es ou non, ´emanant des ´etablissements d’enseignement et de recherche fran¸cais ou ´etrangers, des laboratoires publics ou priv´es.
Temporal Navigation in Dynamic Networks Benjamin Bach∗
Emmanuel Pietriga†
Jean-Daniel Fekete‡
INRIA
INRIA & INRIA Chile ( CIRIC )
INRIA
A BSTRACT We present GraphDiaries, an interface for temporal navigation in dynamic networks with changing topology. Navigation in time is necessary for the exploration of single network states at different points in time and to explore higher level changes over periods of time. GraphDiaries enhances conventional node link diagrams with staged animated transitions between any time steps and small multiples organized along a timeline, as well as different layout adaption techniques. GraphDiaries is designed as an extension to other graph visualization systems and is independent from particular layout algorithms and other visualization techniques. Index Terms: H.5.2 [Information Systems]: Information Interfaces and Presentation—User Interfaces; 1
I NTRODUCTION
A major aspect of dynamic networks is their changing topology as vertices and edges are added and removed over time. To understand low-level changes between individual time steps which may be expressions of higher-level changes, such as the emergence of clusters or the repetitive behavior of connectivity, effective navigation in time and appropriate visual feedback is required. This paper addresses the issue of temporal navigation in dynamic networks by describing approriate navigation techniques in time and proposing staged transitions with change highlighting between arbitrary time steps. Both are presented as parts of an interface named GraphDiaries that integrates additional features such as layout adaption and dynamic node queries. Animation is a common means to convey changes in a user interface [12, 7]. Staged animations for graphs are described by Friedrich and Eades [10]. They first remove graph elements, transform the entire graph so that nodes are as close to their new position as possible (scale, rotate, and translate the layout), move each node individually to its new position, and finally show new elements. While appearing nodes grow or fade in and vanishing nodes shrink or fade out, links are not animated. Although node movements can be tracked, it is difficult to track many changes happening to the topology, especially if the network is large and the graph contains unconnected components. Layout stabilization is another major problem when visualizing dynamic graphs [6]. Our transitions aim to bridge the gap between different layouts eventually supporting local optimized layouts instead of global consensus layouts. In contrast to other approaches to visualizing dynamic networks such as Small multiples [8, 4] aggregation into a single image [5] and 3D representation of the graph time cube [3], animations allow to give a very detailed view of any time step and embody difference/change visualization in the transition itself. A common way to move between time steps is to use a time range slider with discrete marks [2, 1]. However, navigation remains rather linear in time and comparison between arbitrary time steps requires to replay ∗ e-mail:
[email protected]
† e-mail:
[email protected] ‡ e-mail:
[email protected]
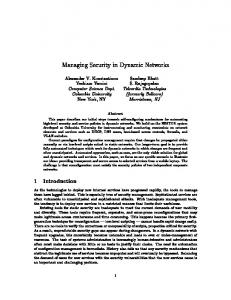
Figure 1: Staged transition on a query. From left to right: initial state, element removal (red), layout change, element addition (blue) and final state.
all changes between them. Solutions that directly show differences between graphs [11] are limited either in the number of graphs they compare or do increase, rather than decrease, visual complexity of the visualization. 2 D ESIGNING S TAGED T RANSITIONS In addition to common design goals for animated transitions such as smoothness, aesthetic criteria and intuitiveness [9], we designed our staged transitions with the following goals in mind. Staging transitions allows the user to focus on different parts of the transition separately and prevents her from being overloaded with information shown at the same time. Node link diagrams are highly complex, when large and dense. Three low-level changes between two time steps which can be shown in different stages are: element addition, element change and element removal. Controllability is about adjusting animation speed, freely “moving” within the transition, interrupting it at any time and adapting how the information is shown. Visualization independence is required to integrate the transitions into existing node-link diagram visualizations. Hence, it must not interfere with the visual encoding of the network (shape, color etc..) or rely on a particular layout. Transitions consist of 3 stages: 1) Remove Elements - nodes and edges which are to be removed are first highlighted with red halos, and then faded out (300ms), 2) Transform Layout and Elements color, shape and position of surviving nodes are animated using a slow-in/slow-out animation (600ms). 3) Add Elements - new nodes and edges are faded in, accompanied by blue halos vanishing after the elements have appeared (300ms). We opted for a fairly long duration of 1.2 seconds because each step conveys a lot of information that must be understood by the user. Existing animations between network states do not emphasize changes explicitly, their duration can be shorter. Users can manually stop the animation or disable animated transitions on demand. 3 T EMPORAL N AVIGATION Staged transitions are designed to convey changes between any two time steps. Now we define methods for inter (across different time steps) and intra time steps navigation (within a transition). Inter Time Step Navigation — Using the left/right arrow keys allows navigation between adjacent time steps. Clicking on a thumbnail in the timeline directly moves to the associated time step. All these interactions trigger a staged transition.
below the main time line in order to create customized timelines by taking only specific time steps into account for navigation and difference highlighting.
Figure 2: GraphDiaries interface: a) graph view with colored node queries, b) timeline, c) layout stabilization slider, d) navigation history, e) query panel, f) settings for difference visibility, and g) time control panel.
Intra Time Step Navigation — We provide four options to control the duration of, and the position within, a single transition so that users can adapt it to the current task, either overview, tracking or searching for a particular event related to a graph entity. a) Pressing and holding the left mouse button on a thumbnail, or pressing and holding an arrow key runs the full, staged transition (Run to completion). b) Releasing the button or key during the transition interrupts the transition and plays the remaining stages quickly (200ms), and in parallel (Interrupt and finish). c) Clicking on a thumbnail or quickly hitting an arrow key jumps to the final step without any animation (Skip animations). This can be useful when browsing through time steps where the details of changes that occur are of lesser importance, as observed in a pilot study. d) While all the previous methods mentioned are based on fixed durations, controlling the pace with a time slider can be much more effective in exploring transitions (Interact). Between each time step, the time slider shows three colored regions which represent the three stages of the transition (Figure 2-b). 4 U SER I NTERFACE GraphDiaries is a set of components built in a consistent manner to effectively support time navigation. It consists of six complementary components (Figure 2). The Graph View (a) shows the network as a node-link diagram, at the time step currently selected in the Timeline (b). The Timeline shows small multiples corresponding to time steps; it is used for temporal navigation by clicking the thumbnails or dragging the slider. The Layout Slider (c) allows to adjust the stabilization of the layout between a globally optimized layout and optimal layout per time step. The History Panel (d) provides a list of recently-visited time steps in reverse chronological order, and the Query Panel (e) allows to manage groups of nodes for tracking over time. When grouped in a query, nodes are highlighted by a convex polygon (Figure 1). Queries can be refined at any point in time and are considered a flexible means to track clusters and subgraphs. The Time Control Panel (g) provides additional temporal navigation features, such as looped animations, speed adaption and temporal aggregation along common time units. Changing temporal granularity updates the thumbnails on the timeline and triggers an animation to adapt the graph view (Figure 2-g). Each thumbnail in the Timeline panel shows the network at its associated time step overlaid with a difference highlighting that reveals differences from the previous time step. Consistent with the transitions, removed elements are colored red, new ones blue and the remainder gray. Checkboxes in the control panel (Figure 2-f) allow to specify the type of change visible in order to focus on specific types of changes. Thumbnails can be dragged to other tracks
5 E VALUATION We conducted a controlled experiment, comparing our staged animated transitions and temporal navigation (ST) to existing solutions: no animated transitions (NA), and a simple non-staged animation without change highlighting between time steps (SA). Animations were not possible between non-adjacent time steps. We asked 18 participants (within-subject design) to perform three highlevel tasks upon the observation of changes in cluster size (When is cluster C largest? How does the size of cluster C behaves over time? and Which cluster changes the most over time?). Each participant spent approximately one hour on the experiment. We measured time and error, and asked participants to rank the techniques according to their preferences. Results suggest significant benefits for staged transitions in terms of error rate (ST=11.6%, SA=18.3%, NA=31.6%) without a significant increase in completion time (ST=20.3s, SA=19.3s, NA=18.4s). Most participants preferred the transitions and extended navigation techniques: ST was ranked as best by 80% of the participants, while NA was ranked last by 72% of them. 6 C ONCLUSIONS We described GraphDiaries, a system for effective temporal navigation in dynamic networks and described staged transitions with change highlighting between time steps. Change highlighting emphasizes changes and makes it easier to focus on types of changes as well as areas of change. Although GraphDiaries is independent from any particular layout algorithm, tests with more than 2000 nodes and 4500 edges show that layout stabilization is crucial, especially if user-driven adaption is requried. R EFERENCES [1] J. Ahn, M. Taieb-Maimon, A. Sopan, C. Plaisant, and B. Shneiderman. Temporal Visualization of Social Network Dynamics: Prototypes for Nation of Neighbors. In LLCS, pages 309–316, 2011. [2] M. Bastian, S. Heymann, and M. Jacomy. Gephi: An open source software for exploring and manipulating networks. In Proc. ICWSM, 2009. [3] U. Brandes and S. R. Corman. Visual unrolling of network evolution and the analysis of dynamic discourse. Information Visualization, 2(1):40–50, Mar. 2003. [4] M. Burch, C. Vehlow, F. Beck, S. Diehl, and D. Weiskopf. Parallel edge splatting for scalable dynamic graph visualization. TVCG, 17(12):2344 –2353, dec. 2011. [5] C. Collberg, S. Kobourov, J. Nagra, J. Pitts, and K. Wampler. A system for graph-based visualization of the evolution of software. In Proc. SoftVis, SoftVis ’03, pages 77–86. ACM, 2003. [6] S. Diehl and C. G¨org. Graphs, they are changing - dynamic graph drawing for a sequence of graphs. In M. Goodrich and S.G.Kobourov, editors, LNCS, volume 2528, pages 23–31. Springer, 2002. [7] P. Eades and M. L. Huang. Navigating clustered graphs using forcedirected methods. Graph Algorithms and Applications, 4(3):157–181, 2000. [8] M. Farrugia, N. Hurley, and Q. Aaron. Exploring temporal ego networks using small multiples and tree-ring layouts. In Proc. ACHI, pages 23–28, 2011. [9] C. Friedrich and P. Eades. The Marey Graph Animation Tool Demo. In J. Marks, editor, Proc. Graph Drawing, volume 1984 of Lecture Notes in Computer Science, pages 95–107. Springer, 2001. [10] C. Friedrich and P. Eades. Graph drawing in motion. Graph Algorithms and Applications, 6(3):353–370, 2002. [11] M. Hasco¨et and P. Dragicevic. Interactive Graph Matching and Visual Comparison of Graphs and Clustered Craphs. In Proc. AVI, 2012. [12] J. Heer and G. Robertson. Animated transitions in statistical data graphics. TVCG, 13:1240–1247, November 2007.