AMERICAN JOURNAL OF PHYSICAL ANTHROPOLOGY 128:35–56 (2005)
Temporalis Function in Anthropoids and Strepsirrhines: An EMG Study William L. Hylander,1,2* Christine E. Wall,1 Christopher J. Vinyard,3 Callum Ross,4 Mathew R. Ravosa,5 Susan H. Williams,6 and Kirk R. Johnson1 1
Department of Biological Anthropology and Anatomy, Duke University Medical Center, Durham, North Carolina 27710 Duke University Primate Center, Durham, North Carolina 27705 3 Department of Anatomy, NEOUCOM, Rootstown, Ohio 44272 4 Department of Anatomical Sciences, Stony Brook University, Health Sciences Center, Stony Brook, New York 11794 5 Department of Cell and Molecular Biology, Northwestern University Feinberg School of Medicine, Chicago, Illinois 60611 6 Department of Biomedical Sciences, Ohio University College of Osteopathic Medicine, Athens, Ohio 45701 2
KEY WORDS temporalis; electromyography; biomechanics; jaw-adductor muscle force; mastication; primates ABSTRACT The major purpose of this study is to analyze anterior and posterior temporalis muscle force recruitment and firing patterns in various anthropoid and strepsirrhine primates. There are two specific goals for this project. First, we test the hypothesis that in addition to transversely directed muscle force, the evolution of symphyseal fusion in primates may also be linked to vertically directed balancingside muscle force during chewing (Hylander et al. [2000] Am. J. Phys. Anthropol. 112:469 – 492). Second, we test the hypothesis of whether strepsirrhines retain the hypothesized primitive mammalian condition for the firing of the anterior temporalis, whereas anthropoids have the derived condition (Weijs [1994] Biomechanics of Feeding in Vertebrates; Berlin: Springer-Verlag, p. 282–320). Electromyographic (EMG) activities of the left and right anterior and posterior temporalis muscles were recorded and analyzed in baboons, macaques, owl monkeys, thick-tailed galagos, and ring-tailed lemurs. In addition, as we used the working-side superficial masseter as a reference muscle, we also recorded and analyzed EMG activity of the left and right superficial masseter in these primates. The data for the anterior temporalis provided no support for the hypothesis that symphyseal fusion in primates is linked to vertically directed jaw muscle forces during mastication. Thus, symphyseal fusion in primates is most likely mainly linked to the timing and
Craniofacial biomechanics continue to attract a significant amount of research interest. Furthermore, as the masticatory apparatus has a major influence on craniofacial form, considerable efforts have been directed toward studying the biomechanics of chewing and biting. These studies often require an estimate of the direction, magnitude, and/or timing of various jawclosing muscle forces. For this reason, we have been actively involved in analyzing jaw-muscle electromyographic (EMG) activity patterns among various species of mammals (e.g., Hylander et al., 2000, 2004; Vinyard et al., 2004a, b). This study is a continuation of these analyses, and here we focus on the recruitment and firing patterns of the anterior and posterior temporalis muscles in primates. ©
2005 WILEY-LISS, INC.
recruitment of transversely directed forces from the balancing-side deep masseter (Hylander et al. [2000] Am. J. Phys. Anthropol. 112:469 – 492). In addition, our data demonstrate that the firing patterns for the working- and balancing-side anterior temporalis muscles are near identical in both strepsirrhines and anthropoids. Their working- and balancingside anterior temporalis muscles fire asynchronously and reach peak activity during the power stroke. Similarly, their working- and balancing-side posterior temporalis muscles also fire asynchronously and reach peak activity during the power stroke. Compared to these strepsirrhines, however, the balancing-side posterior temporalis of anthropoids appears to have a relatively delayed firing pattern. Moreover, based on their smaller W/B ratios, anthropoids demonstrate a relative increase in muscle-force recruitment of the balancing-side posterior temporalis. This in turn suggests that anthropoids may emphasize the duration and magnitude of the power stroke during mastication. This hypothesis, however, requires additional testing. Furthermore, during the latter portion of the power stroke, the late activity of the balancing-side posterior temporalis of anthropoids apparently assists the balancing-side deep masseter in driving the working-side molars through the terminal portion of occlusion. Am J Phys Anthropol 128:35–56, 2005. ©
2005 Wiley-Liss, Inc.
Grant sponsor: NIH; Grant numbers: DE04531, DE05595, DE05663; Grant sponsor: NSF; Grant numbers: SBR-9420764, BCS0138565, BNS-91-00523. *Correspondence to: Professor William L. Hylander, Department of Biological Anthropology and Anatomy, Duke University Medical School, Box 3170, Durham, NC 27710. E-mail:
[email protected] Received 14 October 2003; accepted 29 January 2004. DOI 10.1002/ajpa.20058 Published online 15 February 2005 in Wiley InterScience (www.interscience.wiley.com).
36
W.L. HYLANDER ET AL.
HOW JAW-CLOSING MUSCLES WORK DURING CHEWING Prior to outlining the details about what we propose to do, it is important to provide some background information about how mammalian jaw muscles function during mastication. For many mammals, the jaw-closing muscles are thought to act as two force couples during jaw closing (e.g., Moller, 1966; Herring and Scapino, 1973; Luschei and Goodwin, 1974; de Vree and Gans, 1976; Gorniak, 1977; Weijs and Dantuma, 1981).1 These two “couples,” called “diagonals” or “diagonal pairs” by Herring (1976, 1985a, b, 1992, 1993) and “triplets” by Weijs and Dantuma (1981) and Weijs (1994), are made up of a combination of various muscles. Each diagonal or triplet has one muscle that pulls the mandible upward and backward, the temporalis, and two muscles that pull the mandible upward and forward, the opposite-side superficial masseter and medial pterygoid muscles (Herring, 1992; Weijs, 1994) (Fig. 1). Furthermore, these two muscle groups fire asymmetrically. The working-side (w-s) temporalis and the balancing-side (b-s) superficial masseter and medial pterygoids fire first (diagonal or triplet I). This causes the lower jaw to be elevated and its working side shifted laterally. The firing of triplet or diagonal I is followed by the firing of triplet or diagonal II, which consists of the b-s temporalis and the w-s superficial masseter and medial pterygoids. This causes the jaw to continue elevating, and shortly thereafter its working side is shifted medially, back towards the midline. As described above, for many mammals as well as all primates, the w-s and b-s posterior temporalis are thought to fire with triplets and diagonals I and II, respectively. On the other hand, for “prosimians” and many other “primitive” mammals, the left and right anterior temporalis muscles are said to fire as a third muscle group, the symmetric vertical closers (SVC) (Weijs, 1994; Langenbach and van Eijden, 2001). Following the suggestion of Weijs (1994), the SVC of “primitive” mammals (including “prosimians”) are said to fire synchronously, prior to triplet I and only during fast closing (Fig. 2A). In contrast, the so-called “transverse” chewers (including anthropoids) are said to fire their w-s and b-s anterior temporalis with triplets (or diagonals) I and II, respectively (Fig. 2B) (Weijs, 1994).
1 The concept of the jaw-closing muscles acting as force couples is a very useful first approximation for understanding their mechanical effects during unilateral mastication. In a strict sense, however, the jaw-closing muscles do not act solely as force couples, because a couple is characterized by two forces that are separated, parallel, equal in magnitude, and opposite in direction (Panjabi and White, 2001). Although separated, the muscle forces within each diagonal or triplet are not parallel, equal, or opposite. Nevertheless, if we resolve each muscle force into its vertical and horizontal components, the horizontal components of these forces closely approximate a force couple (Fig. 1B,C).
PURPOSE OF STUDY The purpose of this study is to analyze the EMG activity of the anterior and posterior temporalis in various anthropoid and strepsirrhine primates during mastication. There are two specific goals for this project. First, and most importantly, as part of our continuing efforts to identify possible links between biomechanical stress and symphyseal morphology, we propose to characterize the recruitment of relative force of the anterior and posterior temporalis muscles in baboons, macaques, owl monkeys, thicktailed galagos, and ring-tailed lemurs. We are particularly interested in determining whether anthropoids recruit relatively more force from their b-s anterior temporalis than do strepsirrhines with mobile unfused symphyses. If so, this would provide evidence to support the hypothesis that the evolution of symphyseal fusion in primates is also linked to vertically directed force from their b-s jaw muscles during chewing (Beecher, 1977, 1979; Hylander, 1975, 1977, 1979a, 1979b; Ravosa and Hylander, 1994; Hylander et al., 2000). Second, we want to determine firing patterns of the anterior and posterior temporalis. We are particularly interested in whether strepsirrhines retain the hypothesized primitive mammalian condition for the firing of the anterior temporalis, whereas anthropoids have a derived condition (Weijs, 1994). If so, among strepsirrhines, the w-s and b-s anterior temporalis should fire only during fast closing as members of the SVC muscles, whereas for anthropoids, the w-s and b-s anterior temporalis should fire along with members of triplets (or diagonals) I and II, respectively. Furthermore, we are interested in whether there are important differences between strepsirrhines and anthropoids in the firing patterns of the posterior temporalis. MATERIALS AND METHODS Subjects The following primates served as subjects: 3 adult male Papio anubis (baboons 2– 4), 3 adult male Macaca fuscata (macaques 11, 13, and 14), 2 adult Aotus trivirgatus, one male (owl monkey 1) and one female (owl monkey 2), 2 adult male Otolemur crassicaudatus and one adult male O. garnetti (galagos 6 – 8), and 4 adult Lemur catta, 2 males and 2 females (lemurs 1– 4). With the exception of the galagos, all subjects were used for two or more recording sessions. These different sessions are indicated in our tables by letters A–D. EMG electrodes and electrode placement procedure As many as eight fine-wire indwelling bipolar electrodes were placed within the left and right middle superficial masseter and the anterior and posterior temporalis muscles (Fig. 3). For all subjects, the tips of the electrodes were first placed into a fine-gauge
Fig. 1. Jaw-closing muscle firing patterns according to triplet (primitive mammalian condition) and diagonal hypotheses. See text for further discussion as to how triplets (A–C) differ from diagonals (B and C). A: Symmetric vertical closers (SVC). Simultaneous activity of working- (w-s) and balancing-side (b-s) anterior temporalis (and deep masseters) initiate vertical jaw closing. Peak activity of SVC occurs well before initiation of power stroke. Fb-s svc is balancing-side force of anterior temporalis and deep masseter muscles. Fw-s svc is working-side force for anterior temporalis and deep masseter muscles. B: Triplet I. Following SVC, triplet I, which is made up of b-s superficial masseter, b-s medial pterygoid, and w-s posterior temporalis muscles, fires more or less simultaneously. Diagonal I consists of above three muscles as well as w-s anterior temporalis. These groups reach peak activity early in power stroke. Vertical components of these muscles continue to close jaws as their horizontal components shift w-s corpus and teeth laterally by rotating mandible about a vertical axis located in vicinity of w-s mandibular condyle. Diagonal hypothesis does not recognize SVC as a separate muscle group. Instead, jaw closing is initiated by diagonal I. Fb-s sm ⫹ mpt is balancing-side force of superficial masseter and medial pterygoid. Fw-s pt is w-s force of posterior temporalis for triplets and w-s force of entire temporalis for diagonals. C: Triplet II. Following triplet I, triplet II, which is made up of w-s superficial masseter, w-s medial pterygoid, and b-s posterior temporalis, fires more or less simultaneously.Diagonal II consists of above three muscles as well as b-s anterior temporalis muscles. These groups reach peak activity late in power stroke. Vertical components of these muscles continue to close jaws as their horizontal components shift w-s corpus and teeth back toward midline by rotating mandible about a vertical axis located in vicinity of w-s mandibular condyle. Fw-s sm ⫹ mpt is the w-s force of superficial masseter and medial pterygoid. Fb-s pt is b-s force of posterior temporalis for triplets and w-s force of entire temporalis for diagonals.
Fig. 2. Jaw muscle firing patterns. A: Predictions of firing patterns of jaw closing muscles for “primitive” mammals according to triplet hypothesis (Weijs, 1994). Note that symmetric vertical closers fire first, followed by triplet I, and then triplet II. B: Predictions of firing patterns of jaw-closing muscle for anthropoids according to triplet and diagonal hypotheses (Herring, 1992; Weijs, 1994). C: Predictions of masseter firing pattern associated with wishboning of symphysis. This hypothesis predicts occurrence of this pattern in only those primates with a partially or completely fused mandibular symphysis, but not in those strepsirrhines with a highly mobile mandibular symphysis, such as thick-tailed galagos and ring-tailed lemurs (Hylander and Johnson, 1994; Hylander et al., 2000, 2004). Note that workingside deep masseter peaks first and balancing-side deep masseter peaks last. Furthermore, balancing-side superficial masseter peaks after working-side deep and before working-side superficial masseter. Vertical line indicates peak activity in reference muscle, i.e., working-side superficial masseter. Solid squares and circles, working-side superficial and deep masseter, respectively; open squares and circles, balancing-side superficial and deep masseter, respectively. See text for further description.
38
W.L. HYLANDER ET AL.
Fig. 3. Drawing of lateral view of a male macaque skull and superficial masseter and temporalis muscles. Solid black dots indicate location of bipolar fine-wire indwelling electrodes in superficial masseter (sm) and anterior (at) and posterior (pt) temporalis.
needle, and the needle was then inserted into the masseter or temporalis muscles until its point encountered mandibular or cranial bone, respectively. The needle was then withdrawn, leaving the electrode tips embedded in muscle near the surface of the bone. The electrodes in the superficial masseter were positioned midway between its anterior and posterior borders, between 5–10 mm above the lower border of the angle of the mandible, depending on the size of the subject. Inserting these electrodes near the ventral edge of the mandible avoids inadvertent recording from the deep masseter. The electrode tips in the anterior temporalis were positioned 5–10 mm behind the postorbital bar at the level of the center of the eyeball. The electrode tips in the posterior temporalis were positioned 5–10 mm above the external auditory meatus. All electrodes were inserted with the subjects under light sedation. For baboons, macaques, owl monkeys, and galagos, we used a combination of acepromazine and ketamine (Connolly and Quimby, 1978). For ring-tailed lemurs, we used a medetomidine-based sedation procedure (Williams et al., 2003). As the subjects were not killed, electrode position was not verified by dissection, although proper electrode depth was easily confirmed when removing the electrodes at the end of the recording session. Recording procedure Prior to recovery from the sedative, subjects were restrained as described elsewhere (Hylander et al., 2000). Once the animal fully recovered from sedation, it was fed relatively easy-to-chew foods, i.e., pieces of fruit pulp with attached skin (apple or pear), fresh carrot, and moist raisins. We also fed the subjects relatively difficult-to-chew brittle or tough (B/T) foods, i.e., unpopped popcorn kernels, cherry pits, dried gelatin candy (dried gummy bears), dried apricots, and dried prunes. The EMG potentials were simultaneously amplified and filtered (bandpass, 100 –3,000 Hz) and then recorded
with a 14-channel FM tape recorder at 15 inches per second. At this time, we identified whether the subject chewed on the left or right side by procedures outlined elsewhere (Hylander et al., 2000). Details of the training and recording procedures were described previously (Hylander and Johnson, 1989, 1994). The entire data set is based on 42 separate electrode placement and recording sessions: 9 for baboons and 9 for macaques (3 for each subject), 8 for owl monkeys (4 for each subject), 3 for thick-tailed galagos (one for each subject), and 9 for ring-tailed lemurs (1–3 for each subject). All EMG data were recorded as subjects vigorously chewed various food items. EMG quantification All EMG recordings of each chewing sequence were initially reproduced for visual examination by playing the raw EMG data from the tape recorder into two multiple-channel storage oscilloscopes. As macaques and baboons rarely shift chewing sides during a chewing sequence, we selected for analysis one long sequence of chewing on the left and one for chewing on the right for each food. In contrast, owl monkeys, galagos, and lemurs usually shift chewing sides frequently during a sequence. Therefore, when possible and for each food, we selected for analysis at least one sequence that started with chewing on the left and one that started with chewing on the right. For each chewing sequence analyzed, the raw EMG data were played from the FM tape recorder into a 16-channel analog-to-digital converter (12-bit resolution), and the digitized values were written to the hard disk of a microcomputer. Each channel was sampled and digitized at a rate of 10,000 Hz. The digitized values were then read back into the microcomputer for subsequent processing and analysis. The digitized raw EMG values were quantified by calculating the root-mean-square (rms) values in 2-millisecond (ms) intervals from the raw digitized values, using a 42-ms time constant (Fig. 4) (Hylander and Johnson, 1993). We then identified the largest rms value based on peak amplitude for each electrode throughout a given experiment, regardless as to whether it was a working- (w-s) or balancingside (b-s) muscle. For each power stroke, the peak values for each electrode were then scaled by assigning a value of 1.0 to the largest value, and the remaining peak values were scaled in a linear fashion. Thus, for each power stroke and muscle, there was a scaled value for peak EMG activity for values between 0 –1.0. Parenthetically, for purposes of this analysis, the EMG timing values of one muscle relative to another were not necessarily dependent on employing what has been called “the optimal time constant” (Hylander and Johnson, 1993). This is true so long as the selected time constant is neither too short (too small) nor too long (too large). If too small (e.g., about 20 ms or less), the rms EMG in our subjects
39
TEMPORALIS EMG
in our subjects the rms EMG takes on a single prolonged flat appearance, and if further increased, the rms EMG is eventually transformed to a flat signal (Hylander and Johnson, 1993). Thus, if the selected time constant was too short or too long, it became impracticable to determine EMG timing values for loading, peak, and unloading. W/B EMG ratios For each power stroke, the scaled peak w-s EMG value was then divided by the scaled peak b-s EMG value. We refer to this value as the working/balancing (W/B) EMG ratio. If the w-s EMG level is larger than the b-s level, the W/B ratio is larger than 1.0. Conversely, if the b-s EMG level is larger, the W/B ratio is less than 1.0. As the W/B EMG ratio is a derived variable with values distributed above and below 1.0 and a distribution that is theoretically skewed to the right, the mean of these ratios is not a good estimate of central tendency (Hylander and Johnson, 1994). Therefore, a log transformation of the data was performed to normalize the distribution of W/B ratio values (Sokal and Rohlf, 1981). The mean W/B value for each experiment was calculated from the log-transformed W/B values for all the analyzed chews in that experiment. The mean W/B value for each subject was calculated from the experiment means for that subject. The grand mean W/B value for each group of primates was calculated from all the experiment means for that group. The mean values were then transformed back to their original scale for ease of interpretation in the tables. The standard deviations of log-transformed values are reported for each experiment as a measure of variation. The standard deviations are not transformed back to their original scale, due to the problems associated with antilogged standard deviations (see Vinyard et al., 2004a, b). Jaw muscle firing patterns
Fig. 4. Digitized raw and rms EMGs of working-side superficial masseter (reference muscle) and working- and balancing-side anterior and posterior temporalis muscles in a male macaque during mastication of popcorn kernels. On average, working-side temporalis muscles reach peak activity before reference muscle, and balancing-side temporalis muscles reach peak activity after reference muscle. Dashed vertical lines indicate peak activity in reference muscle. Time is in milliseconds (ms); rms values were calculated using a 42-ms time constant, for reasons outlined in Hylander and Johnson (1993). On average, for macaques and baboons, peak muscle force follows peak rms EMG by about 30 ms (Hylander and Johnson, 1993).
takes on multiple short-acting peaks, and if the time constant is further reduced, the rms EMG eventually appears more and more as a raw EMG. If the time constant is too large (e.g., about 80 ms or more),
The timings of peak EMG activity of the w-s and b-s temporalis were compared to the peak EMG activity of our reference muscle, the middle portion of the w-s superficial masseter (Hylander and Johnson, 1994). In addition to determining the timing differences between peak EMG values, the timing differences between the 25%, 50%, and 75% level of peak EMG values were also determined for each power stroke during loading and unloading. For each muscle, the duration of the rise time (25% to peak during loading), the fall time (peak to 25% during unloading), and the total time (25% during loading to 25% during unloading) of EMG activity were also determined for each power stroke (Fig. 5). Means of the timing values for each experiment were calculated from the values for all analyzed chews in that experiment. Means for each subject were calculated from the experiment means for that subject. Grand means for each group of primates were calculated from the mean values for all the experiment
40
W.L. HYLANDER ET AL.
it does allow us to focus our analysis on some of the more forceful power strokes. At the very beginning of a chewing sequence, our subjects occasionally engaged in two or three prolonged and near-isometric bites interrupted by extensive intraoral manipulation of the food item. Immediately following these behaviors, they engaged in rhythmic chewing behaviors. Our W/B ratio and timing data are based entirely on these rhythmic chewing behaviors. RESULTS
Fig. 5. Method for determining rise time and fall time of jaw-muscle EMG values. Figure indicates rms EMG of one power stroke for superficial masseter muscle of a female baboon during mastication. Rise time and fall time are operationally defined as time between 25–100% of peak EMG during loading and unloading, respectively. Total time of activity is operationally defined as rise time plus fall time (from Hylander and Johnson, 1994).
means for that group. Unless specifically indicated, all tests of significance are on the grand means. As our EMG timing data may not satisfy all of the requirements for parametric statistical tests, the mean timing differences in peak EMGs between muscles were tested for significance at the 0.05 level using a nonparametric test, i.e., the Wilcoxon signed-ranks test for paired comparisons. When peak EMG of a muscle was predicted to either precede or follow peak EMG of another muscle, as when testing a diagonal or triplet I muscle relative to a diagonal or triplet II muscle, a one-tailed test of significance was utilized. Conversely, when testing peak EMG of those muscles within each triplet or diagonal group, all tests of significance were two-tailed tests. Data selection As biomechanical adaptations in the craniofacial region are likely to be in response to the more forceful loading regimes, we focus on data recorded during the chewing of hard, brittle, or tough (B/T) foods. Earlier work established that among various primates, W/B ratios are generally influenced by overall masticatory force levels, and that the lowest W/B ratios are usually associated with the more forceful power strokes (Hylander, 1985; Hylander et al., 1992, 2000). This is also true for certain nonprimate mammals (Didelphis virginiana) (Crompton and Hylander, 1986; Crompton, 1995). Therefore, for the more difficult-to-chew foods, we also analyze W/B ratios for 10 of the largest balancing-side peak EMG values so as to focus the analysis on the more forceful power strokes. The identification of these power strokes is operationalized by selecting those power strokes with the five largest b-s EMG values for chewing on the left side and the five largest b-s values for chewing on the right side for the anterior temporalis muscle. This procedure arguably does not identify the 10 most forceful power strokes, but
For baboons, macaques, owl monkeys, and ringtailed lemurs, we recorded a substantial amount of EMG data for many recording sessions. For galagos, however, we were only able to record data from the anterior temporalis during one recording session (galago 6), and from the posterior temporalis during three recording sessions (one session for each galago subject). As we are unable to increase these samples due to the current unavailability of adult galago subjects, we present the galago data with the understanding that these data are preliminary. Some subjects refused to eat certain foods. All, however, chewed at least one difficult-to-chew brittle or tough (B/T) food on both the left and right sides. Therefore, EMG data were recorded for each subject during episodes of relatively forceful mastication. Unlike the anthropoids, the galagos always and the lemurs usually refused to eat apple skin. For baboons and macaques, the b-s posterior temporalis EMGs were often barely detectable during the chewing of less resistant foods. When this occurred, this caused the W/B ratio for this muscle to become very large. In order to prevent unusually large ratio values from grossly distorting the overall mean W/B ratios, any ratios larger than 10.0 were simply assigned a value of 10.0 (for further discussion of this issue, see Hylander et al., 2000). W/B EMG ratios of anterior and posterior temporalis muscles Table 1 presents the descriptive statistics of W/B ratios for all five primate groups during chewing of B/T foods. Table 1 also presents mean values of W/B ratios associated with the 10 more forceful power strokes (in parentheses). Table 2 consists of summary data of the grand means of W/B ratios for all five groups. Anterior temporalis. The grand mean W/B ratios during the chewing of B/T foods for baboons, macaques, owl monkeys, and lemurs are 1.2, 1.2, 1.4, and 1.5, respectively. For the 10 more forceful power strokes, these values are reduced to 1.0, 1.0, 1.2, and 1.2. For the single galago recording session, the mean for all power strokes and the 10 more forceful power strokes are much larger (4.4 and 3.1, respectively). During the chewing of less resistant foods, the W/B ratios are much larger for baboons and ma-
41
TEMPORALIS EMG TABLE 1. W/B EMG ratios for anterior and posterior temporalis muscles during mastication of brittle/tough foods for each of five groups TABLE 1A. Baboons1 Anterior temporalis Subject Baboon 3 Exp. A Exp. B Exp. C Subject means Baboon 4 Exp. A Exp. B Exp. C Subject means Baboon 5 Exp. A Exp. B Exp. C Subject means Grand means
Posterior temporalis
N
Mean
(Mean)
SDlog10
Mean
(Mean)
SDlog10
64 52 48
1.1 1.1 1.0 1.1
(0.9) (0.9) (0.9) (0.9)
0.07 0.08 0.09 0.08
0.8 1.0 0.9 0.9
(0.8) (0.9) (0.8) (0.8)
0.20 0.10 0.56 0.29
66 60 81
1.0 1.8 1.1 1.3
(0.9) (1.4) (1.0) (1.1)
0.07 0.18 0.07 0.11
0.8 1.3 0.8 0.9
(0.8) (1.0) (0.8) (0.9)
0.09 0.21 0.17 0.16
75 70 58
1.3 1.0 1.2 1.2 1.2
(1.1) (1.1) (1.0) (1.1) (1.0)
0.09 0.07 0.11 0.09 0.09
1.0 1.0 1.1 1.0 1.0
(0.9) (0.7) (1.2) (0.9) (0.9)
0.12 0.30 0.08 0.17 0.20
1 Values in parentheses (Mean) indicate mean W/B ratio for 10 power strokes (5 from each side), with greatest balancing-side contribution based on BAT muscle. N, number of power strokes; SDlog10, standard deviation of log-transformed values.
TABLE 1B. Macaques1 Anterior temporalis Subject Macaque 11 Exp. A Exp. B Exp. C Subject means Macaque 13 Exp. A Exp. B Exp. C Subject means Macaque 14 Exp. A Exp. B Exp. C Subject means Grand means
Posterior temporalis
N
Mean
(Mean)
SDlog10
Mean
(Mean)
SDlog10
83 48 113
1.5 1.3 1.2 1.3
(1.0) (1.0) (0.9) (1.0)
0.16 0.09 0.09 0.11
1.8 1.2 1.0 1.3
(1.4) (1.1) (1.0) (1.2)
0.18 0.13 0.12 0.14
68 83 85
1.5 1.0 1.1 1.2
(1.0) (0.9) (1.0) (1.0)
0.15 0.11 0.07 0.11
# 1.0 1.2 1.1
(1.0) (0.9) (0.9)
0.12 0.20 0.16
53 71 84
1.3 1.2 1.1 1.2 1.2
(1.1) (0.9) (0.9) (1.0) (1.0)
0.11 0.12 0.08 0.10 0.11
1.2 1.4 1.2 1.3 1.2
(1.1) (1.3) (1.2) (1.2) (1.1)
0.14 0.16 0.13 0.14 0.15
1 Values in parentheses (Mean) indicate mean W/B ratio for 10 power strokes (5 from each side), with greatest balancing-side contribution based on BAT muscle. N, number of power strokes; SDlog10, standard deviation of log-transformed values. #, no electrodes for this muscle, or electrode failed.
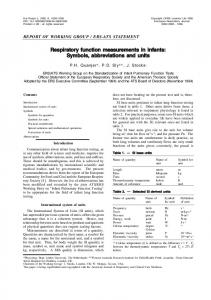
caques (2.8 and 4.1), and only slightly larger for owl monkeys (1.5). Posterior temporalis. The W/B ratios during the chewing of B/T foods for baboons, macaques, owl monkeys, galagos, and lemurs are 1.0, 1.2, 1.4, 2.4, and 2.0, respectively. For the 10 more forceful power strokes, these values are reduced to 0.9, 1.1, 1.3, 2.1, and 1.8. During the chewing of less resistant foods, the W/B ratios are much larger for baboons and macaques (7.2 and 7.6), and nearly identical for owl monkeys (1.3). % EMG activity of the anterior and posterior temporalis muscles Figure 6 is a bar graph indicating average % EMG values for all five groups during the chewing of B/T foods.
Anterior temporalis. On average, all subjects exhibit about the same percentage of peak EMG activity of their w-s anterior temporalis (62–70%) during the chewing of B/T foods. With the exception of the single galago recording session, the b-s anterior temporalis exhibits 41–59% of peak activity. For galagos, the b-s anterior temporalis is less than 20%. During the chewing of less resistant foods (anthropoids only), the w-s percentages are reduced to between 50 –54%. For baboons and macaques these values fall to 17% and 19%, respectively, whereas for owl monkeys they fall to only 39%. Posterior temporalis. Baboons and macaques exhibit about the same percentage of peak EMG activity for their w-s posterior temporalis during the chewing of B/T foods (42% and 39%, respectively), whereas owl monkeys, galagos, and lemurs exhibit a
42
W.L. HYLANDER ET AL. TABLE 1C. Owl monkeys1 Anterior temporalis
Subject Owl monkey 1 Exp. A Exp. B Exp. C Exp. D Subject means Owl monkey 2 Exp. A Exp. B Exp. C Exp. D Subject means Grand means
Posterior temporalis
N
Mean
(Mean)
SDlog10
Mean
(Mean)
SDlog10
32 39 56 21
1.3 1.7 1.2 1.9 1.5
(1.2) (1.2) (1.0) (1.5) (1.2)
0.10 0.15 0.14 0.15 0.14
1.3 1.8 1.2 1.9 1.5
(1.2) (1.2) (1.1) (1.8) (1.3)
0.08 0.19 0.11 0.12 0.13
42 57 69 75
1.2 1.6 1.3 1.4 1.4 1.4
(1.0) (1.2) (1.2) (1.2) (1.1) (1.2)
0.13 0.16 0.09 0.09 0.12 0.13
1.3 1.6 1.2 # 1.4 1.4
(1.2) (1.3) (1.1)
0.09 0.14 0.11
(1.2) (1.3)
0.11 0.12
1 Values in parentheses (Mean) indicate mean W/B ratio for 10 power strokes (5 from each side), with greatest balancing-side contribution based on BAT muscle. N, number of power strokes; SDlog10, standard deviation of log-transformed values. #, no electrodes for this muscle, or electrode failed.
TABLE 1D. Thick-tailed galagos1 Anterior temporalis Subject Galago 6 Exp. A Subject means Galago 7 Exp. A Subject means Galago 8 Exp. A Subject means Grand means
Posterior temporalis
N
Mean
(Mean)
SDlog10
Mean
(Mean)
SDlog10
45
4.4 4.4
(3.1) (3.1)
0.19 0.19
3.5 3.5
(2.6) (2.6)
0.29
37
#
2.0 2.0
(2.0) (2.0)
0.13
38
#
2.0 2.0 2.4
(1.8) (1.8) (2.1)
0.10
4.4
(3.1)
0.19
0.17
1 Values in parentheses (Mean) indicate mean W/B ratio for 10 power strokes (5 from each side) with greatest balancing-side contribution based on BAT muscle. N, number of power strokes; SDlog10, standard deviation of log-transformed values. #, no electrodes for this muscle, or electrode failed.
TABLE 1E. Ring-tailed lemurs1 Anterior temporalis Subject Ring-tailed lemur 1 Exp. C Subject means Ring-tailed lemur 2 Exp. B Exp. C Exp. D Subject means Ring-tailed lemur 3 Exp. A Exp. B Subject means Ring-tailed lemur 4 Exp. A Exp. B Exp. C Subject means Grand means
Posterior temporalis
N
Mean
(Mean)
SDlog10
Mean
(Mean)
SDlog10
51
2.2 2.2
(1.7) (1.7)
0.11
2.5 2.5
(2.1) (2.1)
0.10
44 49 33
1.4 1.3 1.6 1.4
(1.2) (1.2) (1.4) (1.3)
0.10 0.09 0.08
2.5 2.3 3.1 2.6
(2.5) (2.4) (2.9) (2.6)
0.17 0.15 0.13
43 41
1.9 1.3 1.6
(1.4) (1.0) (1.2)
0.12 0.12
2.1 1.7 1.9
(1.7) (1.6) (1.6)
0.14 0.12
44 67 37
1.4 1.1 1.7 1.4 1.5
(1.1) (0.8) (1.3) (1.0) (1.2)
0.11 0.15 0.12
1.6 1.3 1.6 1.5 2.0
(1.3) (1.1) (1.2) (1.2) (1.8)
0.20 0.10 0.17
(0.11)
(0.14)
1 Values in parentheses (Mean) indicate mean W/B ratio for 10 power strokes (5 from each side), with greatest balancing-side contribution based on BAT muscle. N, number of power strokes; SDlog10, standard deviation of log-transformed values.
much larger amount (67%, 62%, and 61%, respectively). For the b-s posterior temporalis, these values are 45% for baboons, 32% for macaques, 48% for owl monkeys, 28% for galagos, and 33% for lemurs.
During the chewing of less resistant foods (anthropoids only), the w-s percentages fall to 27% and 28% in baboons and macaques, respectively, and 49% for owl monkeys. The b-s percentages also fall for all
43
TEMPORALIS EMG TABLE 2. Summary of mean W/B EMG ratios1 Anterior temporalis Mean Softer foods Baboons Macaques Owl monkeys Brittle/tough foods Baboons Macaques Owl monkeys Thick-tailed galagos Ring-tailed lemurs
(Mean)
2.8 4.1 1.5
Posterior temporalis Mean
(Mean)
7.2 7.6 1.3
1.2 1.2 1.4 4.4
(1.0) (1.0) (1.2) (3.1)
1.0 1.2 1.4 2.4
(0.9) (1.1) (1.3) (2.1)
1.5
(1.2)
2.0
(1.8)
1 Values in parentheses (Mean) indicate mean W/B ratio for 10 power strokes (5 from each side) with greatest balancing-side contribution.
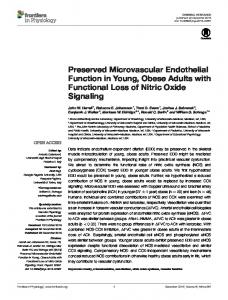
three anthropoid species, but for baboons and macaques their values dramatically fall to 4% and 2%, respectively, whereas for owl monkeys the fall is only to about 37%. Firing patterns of anterior and posterior temporalis muscles Table 3 presents the descriptive statistics for the firing patterns of the temporalis muscles for all five groups. Positive values indicate that peak EMG of a given muscle precedes peak activity of the reference muscle, the w-s superficial masseter (a triplet II and diagonal II muscle), and negative values indicate the reverse. Table 4 contains summary data of the grand mean values for each group. Figure 7 presents the mean timing of the reference muscle, the w-s superficial masseter, and the anterior and posterior temporalis muscles throughout the power stroke for one subject of each of the five groups. In addition to the timing of peak EMG values, these figures also indicate the relative timing of 25%, 50%, and 75% of peak EMGs during loading and unloading. Baboons and macaques Similar to our earlier study of the superficial and deep masseter (Hylander et al., 2000), the overall firing patterns of the anterior and posterior temporalis for the two cercopithecine species (Fig. 7A,B) are remarkably similar, and therefore will be described together. Working-side temporalis. Peak EMG activity of the w-s anterior temporalis (a triplet I and diagonal I muscle) precedes activity of the w-s superficial masseter in baboons and macaques (grand means ⫽ 16 ms and 8 ms, respectively). These values are all significantly larger than zero (P ⱕ 0.02). Peak EMG activity of the w-s posterior temporalis (a triplet I and diagonal I muscle) also precedes activity of the w-s superficial masseter in baboons and macaques (grand means ⫽ 20 msec and 7 msec, respectively).
Once again, these values are all significantly larger than zero (P ⱕ 0.02). Balancing-side temporalis. Unlike the w-s anterior temporalis, peak EMG of the b-s anterior temporalis (a triplet II and diagonal II muscle) occurs after the w-s superficial masseter. The grand means indicate that peak EMG in both species occurs about 6 ms after the w-s superficial masseter, but these values are not significantly different from zero (P ⬎ 0.05). Peak EMG of the b-s posterior temporalis (a triplet II and diagonal II muscle) also occurs after the w-s superficial masseter (grand means ⫽ ⫺19 ms and ⫺16 ms, respectively). These mean values are significantly different from zero (P ⱕ 0.01). Anterior vs. posterior temporalis. None of the grand mean values for the w-s anterior temporalis are significantly different from the corresponding w-s posterior temporalis, whereas the b-s values for these two muscles are significantly different from one another (baboons, P ⱕ 0.01; macaques, P ⱕ 0.02). Overall, the b-s posterior temporalis peaks after the b-s anterior temporalis. Owl monkeys Working-side temporalis. Similar to baboons and macaques, peak EMG activity of the w-s anterior and posterior temporalis muscles (Fig. 7C) precedes activity of the w-s superficial masseter (grand means ⫽ 13 ms for both the anterior and posterior temporalis), and these values are significantly larger than zero (P ⱕ 0.01). Balancing-side temporalis. Also similar to baboons and macaques, the b-s anterior and posterior temporalis muscles reach peak activity after the w-s superficial masseter (grand means ⫽ ⫺14 ms and ⫺15 ms for the anterior and posterior temporalis, respectively). Unlike baboons and macaques, however, rather than just the grand mean for the posterior temporalis, grand mean values for both the anterior and posterior temporalis are significantly different from zero (P ⱕ 0.05). Moreover, note that the amount of asynchrony between the b-s posterior temporalis and the reference muscle is quite pronounced for owl monkey 1. This is the same subject that exhibited the reversed timing of the two superficial masseters (Hylander et al., 2000). Anterior vs. posterior temporalis. The timing values of the ipsilateral (same side) anterior and posterior temporalis muscles are virtually identical, and not significantly different. Thick-tailed galagos Our results for galagos (Fig. 7D) should be considered preliminary because our sample of successful recording sessions is small. Furthermore, recall that whereas for anthropoids, the w-s and b-s anterior temporalis muscles are said to be members of triplets I and II, respectively, for strepsirrhines, these
44
W.L. HYLANDER ET AL.
Fig. 6. Bar graphs of average percent EMG activity in (A) baboons, (B) macaques, (C) owl monkeys, (D) thick-tailed galagos, and (E) ring-tailed lemurs during chewing of B/T foods. WAT, working-side anterior temporalis; BAT, balancing-side anterior temporalis; WPT, working-side posterior temporalis; BPT, balancing-side posterior temporalis. TABLE 3. Timing differences (in ms) between peak EMG activity of working- and balancing-side anterior and posterior temporalis muscles relative to reference muscle, i.e., working-side superficial masseter, during mastication of brittle/tough foods for each of five groups TABLE 3A. Baboons1 Triplet I and diagonal I, working Anterior temporalis Subject Baboon 3 Exp. A Exp. B Exp. C Subject means Baboon 4 Exp. A Exp. B Exp. C Subject means Baboon 5 Exp. A Exp. B Exp. C Subject means Grand means
N
Mean
SD
Triplet II and diagonal II, balancing
Posterior temporalis Mean
Anterior temporalis
Posterior temporalis
SD
Mean
SD
Mean
SD
64 52 48
28 24 9 20
20.9 24.0 25.3 23.4
22 20 18 20
20.9 19.2 24.1 21.4
10 0 ⫺15 ⫺2
17.9 20.4 26.9 21.7
⫺16 ⫺18 ⫺29 ⫺21
19.0 19.9 28.9 22.6
68 60 81
18 18 20 19
18.5 23.0 20.2 20.6
20 26 24 23
19.5 23.2 19.7 20.8
⫺6 ⫺15 ⫺4 ⫺8
16.7 21.6 19.1 19.1
⫺21 ⫺17 ⫺25 ⫺21
20.6 25.9 23.8 23.4
75 70 58
17 6 6 10 16.2
15.1 16.8 14.1 15.3 19.8
19 15 20 18 20.4
14.5 17.0 14.6 15.4 19.2
⫺6 ⫺8 ⫺12 ⫺9 ⫺6.2
14.8 21.0 12.8 16.2 19.0
⫺14 ⫺17 ⫺13 ⫺15 ⫺18.9
12.9 16.8 15.1 14.9 20.3
1 Positive values indicate that balancing-side superficial masseter or temporalis muscles precede working-side superficial masseter. N, number of power strokes; SD, standard deviation.
muscles may be members of the symmetric vertical closers (Weijs, 1994). Working-side temporalis. In the one galago recording session, the w-s anterior temporalis precedes the w-s superficial masseter (experiment mean ⫽ 13 ms). This value, which is based on the individual chews from one experiment, is significantly larger than zero (P ⱕ 0.001). Similarly, peak EMG activity of the w-s posterior temporalis also precedes activity of the w-s superficial masseter (grand mean ⫽ 14 ms). Our sample for the posterior temporalis is restricted to only three experiments, and the grand mean value of 14 ms is not significantly larger than zero (P ⱕ 0.125). Furthermore, for each individual recording session, each experiment mean value, which is based on individual chews, is significantly larger than zero (P ⱕ 0.001). Balancing-side temporalis. Similar to anthropoids, the galago b-s anterior and posterior tempo-
ralis muscles reach peak activity after the w-s superficial masseter (mean ⫽ ⫺12 ms and about ⫺3 ms, respectively). The mean value for the one recording session of the anterior temporalis is significantly different from zero (P ⱕ 0.002). The grand mean value for the posterior temporalis is not significantly different from zero. Furthermore, in one of the three recording sessions, the b-s posterior temporalis actually preceded the w-s superficial masseter. Anterior vs. posterior temporalis. In the one session where simultaneous EMG from both the anterior and posterior temporalis were recorded, the data suggest that peak EMG values for the ipsilateral anterior and posterior temporalis occur nearly simultaneously. Ring-tailed lemurs Working-side temporalis. Similar to the anthropoids and galagos, peak EMG activity of the w-s anterior and posterior temporalis muscles (Fig. 7E)
45
TEMPORALIS EMG TABLE 3B. Macques1 Triplet I and diagonal I, working Anterior temporalis Subject Macaque 11 Exp. A Exp. B Exp. C Subject means Macaque 13 Exp. A Exp. B Exp. C Subject means Macaque 14 Exp. A Exp. B Exp. C Subject means Grand means
Triplet II and diagonal II, balancing
Posterior temporalis
Anterior temporalis
Posterior temporalis
N
Mean
SD
Mean
SD
Mean
SD
Mean
SD
83 48 113
11 4 15 10
18.1 16.5 14.2 16.3
12 2 20 11
18.2 20.1 14.0 17.4
⫺9 ⫺6 ⫺2 ⫺6
12.5 13.0 11.1 12.2
⫺17 ⫺23 ⫺4 ⫺15
14.8 12.9 10.2 12.6
68 83 85
15 7 18 13
13.1 15.0 20.3 16.1
# 17 7 12
17.4 28.8 23.1
⫺6 1 10 2
9.2 13.7 19.1 14.0
# ⫺16 ⫺6 ⫺11
12.8 20.2 16.5
53 71 84
0 ⫺4 5 0 7.9
7.2 15.8 21.1 14.7 15.7
3 ⫺6 2 0 7.1
13.0 14.9 22.8 16.9 19.1
⫺17 ⫺14 ⫺15 ⫺15 ⫺6.4
13.5 12.1 21.0 15.5 13.9
⫺22 ⫺27 ⫺15 ⫺21 ⫺16.3
13.3 14.9 20.1 16.1 15.1
1 Positive values indicate that balancing-side superficial masseter or temporalis muscles precede working-side superficial masseter. N, number of power strokes; SD, standard deviation. #, no electrodes for this muscle.
TABLE 3C. Owl monkeys1 Triplet I and diagonal I, working Anterior temporalis Subject Owl monkey 1 Exp. A Exp. B Exp. C Exp. D Subject means Owl monkey 2 Exp. A Exp. B Exp. C Exp. D Subject means Grand means
Triplet II and diagonal II, balancing
Posterior temporalis
Anterior temporalis
Posterior temporalis
N
Mean
SD
Mean
SD
Mean
SD
Mean
SD
32 39 56 21
22 14 4 18 15
22.4 28.5 36.1 11.7 24.7
21 30 6 12 17
19.2 31.0 34.0 8.3 23.1
⫺13 ⫺21 ⫺47 ⫺19 ⫺25
21.5 26.0 27.9 13.9 22.3
⫺12 ⫺21 ⫺47 ⫺22 ⫺26
18.6 35.3 29.5 18.2 25.4
42 57 69 75
11 18 3 13 11 12.9
8.4 11.6 7.7 10.2 9.5 17.1
9 14 6 82 10 13.3
9.5 12.0 5.8 10.3 9.4 16.3
0 1 ⫺9 ⫺2 ⫺3 ⫺13.8
6.6 10.4 9.0 9.6 8.9 15.6
⫺5 ⫺1 ⫺11 ⫺12 ⫺6 ⫺15.0
8.0 9.2 6.6 9.2 8.3 16.8
1 Positive values indicate that balancing-side superficial masseter or temporalis muscles precede working-side superficial masseter. N, number of power strokes; SD, standard deviation. 2 Times based on right posterior temporalis electrode only.
precedes activity of the w-s superficial masseter (grand means ⫽ 23 ms and 17 ms, respectively). Each of these means is significantly larger than zero (P ⱕ 0.01). Balancing-side temporalis. The b-s anterior temporalis muscle reaches peak activity before the w-s superficial masseter (grand mean ⫽ 6 ms), whereas the b-s posterior temporalis reaches peak activity along with the w-s superficial masseter (grand mean ⫽ ⫺0.1 ms). Unlike the mean value for the posterior temporalis, the anterior temporalis is significantly different from zero (P ⱕ 0.01). Anterior vs. posterior temporalis. On average, the ipsilateral anterior temporalis for both the working and balancing sides tends to fire significantly earlier than the ipsilateral posterior temporalis (P ⱕ 0.01).
Rise, fall, and total time of activity of superficial masseter and temporalis muscles Table 5 presents the descriptive statistics for the duration of the rise, fall, difference between rise and fall, and total time of EMG activity of the superficial masseter and temporalis muscles during the chewing of B/T foods. Positive values for the difference between rise and fall times indicate that the rise time is of longer duration. Negative values indicate the reverse condition. Table 6 contains summary data of the grand mean values for each group. There is a considerable amount of variability in the mean values for the five groups. Nevertheless, an interesting pattern emerged. For baboons and macaques, the rise and fall times for all muscles analyzed tended to be either of near equal duration, or the fall time tended to be longer than the rise
46
W.L. HYLANDER ET AL. TABLE 3D. Thick-tailed galagos1 Triplet I and diagonal I, working
Subject Galago 6 Exp. A Subject means Galago 7 Exp. A Subject means Galago 8 Exp. A Subject means Grand means
Triplet II and diagonal II, balancing
Posterior temporalis
Anterior temporalis2
Anterior temporalis2
Posterior temporalis
N
Mean
SD
Mean
SD
Mean
SD
Mean
SD
45
13 13
21.5 21.5
12 12
17.3 17.3
⫺12 ⫺12
19.4 19.4
⫺13 ⫺13
19.8 19.8
37
#
12 12
12.0 12.0
#
⫺3 ⫺3
11.0 11.0
38
#
18 18 14.0
14.0 14.0 14.4
#
6 6 ⫺3.3
8.9 8.9 13.2
13.0
21.5
⫺12.0
19.4
1 Positive values indicate that balancing-side superficial masseter or temporalis muscles precede working-side superficial masseter. N, number of power strokes; SD, standard deviation. #, no electrodes for this muscle. 2 Anterior temporalis is not considered to be a triplet I or II muscle for strepsirrhines (Weijs, 1994).
TABLE 3E. Ring-tailed lemurs1 Triplet I and diagonal I, working
Subject Ring-tailed lemur 1 Exp. C Subject means Ring-tailed lemur 2 Exp. B Exp. C Exp. D Subject means Ring-tailed lemur 3 Exp. A Exp. B Subject means Ring-tailed lemur 4 Exp. A Exp. B Exp. C Subject means Grand means
Triplet II and diagonal II, balancing
Posterior temporalis
Anterior temporalis2
Anterior temporalis2
Posterior temporalis
N
Mean
SD
Mean
SD
Mean
SD
Mean
SD
51
7 7
11.2 11.2
6 6
11.1 11.1
⫺4 ⫺4
13.1 13.1
⫺7 ⫺7
14.1 14.1
44 49 33
18 27 31 25
18.3 16.9 14.8 16.7
15 25 28 23
20.1 11.0 10.5 13.9
5 9 5 6
11.7 12.2 15.7 13.2
⫺6 3 ⫺1 ⫺1
12.1 11.0 8.3 10.5
43 41
31 28 30
13.8 22.4 18.1
25 16 21
11.9 16.0 14.0
6 8 7
12.7 13.7 13.2
1 1 1
7.1 14.3 10.7
44 67 37
22 22 22 22 23.1
15.1 15.3 11.6 14.0 15.5
5 19 16 13 17.2
11.0 13.8 10.4 11.7 12.9
6 11 9 9 6.1
18.9 15.0 13.1 15.7 14.0
⫺4 4 8 3 ⫺0.1
10.2 13.1 16.4 13.2 11.8
1 Positive values indicate that balancing-side superficial masseter or temporalis muscles precede working-side superficial masseter. N, number of power strokes; SD, standard deviation. 2 Anterior temporalis is not considered to be a triplet I or II muscle for strepsirrhines (Weijs, 1994).
time. This contrasts with galagos and lemurs, where for the same muscles, the duration of the rise time tended to be longer than the fall time. Finally, owl monkeys were intermediate in that the rise and fall times of their w-s muscles were similar to those of baboons and macaques, whereas their b-s muscles behaved more like those of galagos and lemurs. DISCUSSION This study has two main goals. First, in order to identify possible links between biomechanical stress and the evolution of symphyseal fusion, we characterized the recruitment of relative force of the working- (w-s) and balancing-side (b-s) anterior and posterior temporalis muscles for baboons, macaques, owl monkeys, thick-tailed galagos, and ring-tailed lemurs. We also characterized the rise (loading), fall (unloading), and total time of EMG activity for these
muscles. Second, to increase our understanding of the biomechanics of the power stroke, we analyzed the firing patterns of these same muscles. Jaw muscle recruitment and symphyseal fusion It was suggested that symphyseal fusion strengthens the symphysis so as to counter increased symphyseal stress during chewing and biting (Beecher, 1977, 1979; Hylander, 1975, 1977, 1979a, b; Ravosa and Hylander, 1994). Based primarily on an in vivo analysis of strain along the mandibular symphysis of macaques (Hylander, 1984, 1985), we identified three loading regimes that may be associated with increased symphyseal stress and the evolution of symphyseal fusion in primates (Hylander et al., 1998). These regimes are: 1) lateral transverse bending or “wishboning” due to increased transversely directed b-s jaw-muscle force; 2) dorsoventral shear-
47
TEMPORALIS EMG TABLE 4. Summary of mean timing differences1 Triplet I and diagonal I, working
Soft foods Baboons Macaques Owl monkeys Brittle/tough foods Baboons Macaques Owl monkeys Thick-tailed galagos Ring-tailed lemurs
Anterior temporalis,2 mean
Posterior temporalis, mean
7.9*** 8.1*** 3.0
11.9*** 15.3*** 2.0
16.2*** 7.9** 12.9*** 13.0 23.1***
20.4*** 7.1** 13.3*** 14.0 17.2***
Triplet II and diagonal II, balancing Anterior temporalis,2 mean ⫺2.4 ⫺2.6 ⫺6.5 ⫺6.2* ⫺6.4* ⫺13.8** ⫺12.0 6.1***
Posterior temporalis, mean ⫺20.4* ⫺14.2* ⫺9.5 ⫺18.9*** ⫺16.3*** ⫺15.0*** ⫺3.3 ⫺0.1
1 Positive values indicate that balancing-side superficial masseter or temporalis muscles precede working-side superficial masseter. SD, standard deviation. 2 Anterior temporalis is not considered to be a triplet I or II muscle for strepsirrhines (Weijs, 1994). *P ⱕ .10 **P ⱕ .05. ***P ⱕ .01.
ing of the symphysis due to increased vertically directed b-s jaw-muscle force; and 3) frontal bending of the symphysis associated with twisting of the mandibular corpus due to increased vertically directed b-s jaw-muscle force. As one or more of these three loading regimes may be importantly linked to symphyseal fusion in primates, we formulated the following three hypotheses (Hylander et al., 1998, 2000). Hypothesis 1 states that the evolution of symphyseal fusion in primates is linked to both increased vertically directed and transversely directed b-s forces from the jaw closing muscles. Hypothesis 2 states that the evolution of symphyseal fusion in primates is linked to only increased transversely directed b-s jaw muscle force. Hypothesis 3 states that the evolution of symphyseal fusion in primates is linked to only increased vertically directed b-s jaw muscle force. Following our EMG analysis of the superficial and deep masseter in baboons, macaques, owl monkeys, galagos, and ring-tailed lemurs (Hylander et al., 2000, 2002, 2004), we concluded that the data provide strong support for hypothesis 2, refute hypothesis 3, and arguably refute hypothesis 1. Moreover, data from Lieberman and Crompton (2000) demonstrated small W/B ratios for the vertically aligned jaw-closing muscles in goats and opossums, two species with unfused mobile symphyses. Therefore, these data also arguably refute hypotheses 1 and 3. We previously noted, however, that an EMG analysis of additional portions of the jaw adductor muscle mass in primates is needed so as to provide a more thorough test of these hypotheses. The present analysis of the temporalis muscle provides additional data to do so, particularly hypothesis 1, which states that symphyseal fusion is linked to both vertically and transversely directed muscle forces. For functional reasons, the temporalis of primates is arbitrarily divided into anterior and posterior portions. The muscle fiber arrangements of these portions are such that the anterior temporalis pulls the
mandible primarily upward, whereas the posterior portion pulls the mandible mainly upward and backward. If symphyseal fusion is an adaptation to strengthen the symphysis so as to counter increased mechanical stress associated with increased vertical force, as stated by hypotheses 1 and 3, then during forceful chewing, anthropoids should recruit more b-s anterior temporalis force than do those strepsirrhines with highly mobile symphyses. Using our temporalis EMG data, one test of these hypotheses is the following. If we focus exclusively on data recorded for the three anthropoids and ringtailed lemurs, the grand mean values for the W/B ratios of the anterior temporalis for baboons, macaques, owl monkeys, and lemurs are 1.2, 1.2, 1.4, and 1.5, respectively. For the more forceful power strokes, these mean values are all reduced to 1.0, 1.0, 1.2, and 1.2, respectively. It is apparent that these values are all quite similar to one another. Furthermore, in all four species there is considerable overlap in mean values for the individual recording sessions. We conclude, therefore, that there are no significant differences in the recruitment of relative force of the b-s anterior temporalis between anthropoids and ring-tailed lemurs. Therefore, these data refute or at least provide no evidence to support hypotheses 1 and 3. In contrast, the data for the one recording session for galagos indicate relatively large W/B ratios for the anterior temporalis (overall mean ⫽ 4.4 and larger power stroke mean ⫽ 3.1), and these data arguably support hypothesis 1. Nevertheless, even if a large sample of galago recordings were to demonstrate that galagos do indeed have large W/B ratios for the anterior temporalis, the data for ring-tailed lemurs lead us to conclude that increased recruitment of vertically directed b-s jaw muscle force is not likely linked to the evolution of symphyseal fusion in primates. Furthermore, and as already noted, previous studies of the superficial and deep masseter muscles for baboons, macaques, owl monkeys, gala-
48
W.L. HYLANDER ET AL.
Fig. 7. Mean values for timing of average percent EMG activity of working-side superficial masseter and working- and balancingside anterior and posterior temporalis muscles during mastication of popcorn kernels in (A) baboon 5 and (B) macaque 11, and dried gelatin candy in (C) owl monkey 1, (D) galago 6, and (E) ring-tailed lemur 2. Vertical line indicates peak activity in reference muscle, i.e., working-side superficial masseter. Positive timing values indicate that a muscle reaches peak activity prior to peak activity of reference muscle, whereas negative values indicate peak activity after reference muscle. Abbreviations as in Figure 6.
49
TEMPORALIS EMG TABLE 5. Rise, fall and total time of EMG activity durations during mastication of brittle/tough foods for each of five groups TABLE 5A. Baboons1 Anterior temporalis Working Subject Baboon 3 Exp. A Exp. B Exp. C Subject means Baboon 4 Exp. A Exp. B Exp. C Subject means Baboon 5 Exp. A Exp. B Exp. C Subject means Grand means
2
3
Posterior temporalis Balancing
4
5
Total
Working
Balancing
N
Rise
Fall
Diff.
Rise Fall Diff. Total Rise Fall Diff. Total Rise Fall Diff. Total
64 52 48
65 59 73 66
94 86 98 93
⫺29 ⫺27 ⫺25 ⫺27
159 145 171 158
64 60 71 65
106 85 88 93
⫺42 ⫺25 ⫺17 ⫺28
170 145 159 158
48 45 * 47
59 52 * 56
⫺11 ⫺7
107 97
⫺9
68 60 81
79 62 69 70
84 72 82 79
⫺5 ⫺10 ⫺13 ⫺9
163 134 151 149
83 70 76 76
96 69 95 87
⫺13 1 ⫺19 ⫺11
179 139 171 163
48 53 36 46
51 60 49 53
75 70 58
66 77 61 68 68
67 65 66 66 79
⫺1 12 ⫺5 2 ⫺11
133 142 127 134 147
63 68 63 65 69
68 64 54 62 81
⫺5 4 9 3 ⫺12
131 132 117 127 149
39 43 51 44 45
50 46 67 54 54
70 62 * 66
⫺17 ⫺11
123 113
102
53 51 * 52
⫺14
118
⫺3 ⫺7 ⫺13 ⫺7
99 113 85 99
56 38 44 46
77 60 79 72
⫺21 ⫺22 ⫺35 ⫺26
133 98 123 118
⫺11 ⫺3 ⫺16 ⫺10 ⫺9
89 89 118 99 100
42 42 43 42 46
62 48 63 58 65
⫺20 ⫺6 ⫺20 ⫺16 ⫺19
104 90 106 100 111
1
N, number of chews in each experiment. Mean values in milliseconds. Duration of time from 25% of peak EMG activity to 100% of peak EMG activity during loading. 3 Duration of time from 100% of peak EMG activity to 25% of peak EMG activity during unloading. 4 Difference equals rise time minus fall time. 5 Duration of time from 25% of peak EMG activity during loading to 25% of peak EMG activity during unloading. * Very low values prevent determination of rise and fall times. 2
TABLE 5B. Macaques1 Anterior temporalis Working Subject Macaque 11 Exp. A Exp. B Exp. C Subject means Macaque 13 Exp. A Exp. B Exp. C Subject means Macaque 14 Exp. A Exp. B Exp. C Subject means Grand means
N
Posterior temporalis
Balancing
Working
Balancing
Rise2 Fall3 Diff.4 Total5 Rise Fall Diff. Total Rise Fall Diff. Total Rise Fall Diff. Total
83 48 113
59 59 45 54
66 66 41 58
⫺7 ⫺7 4 ⫺3
125 125 86 112
35 45 35 38
43 51 42 45
⫺8 ⫺6 ⫺7 ⫺7
78 96 77 84
56 55 41 51
56 56 50 54
0 ⫺1 ⫺9 ⫺3
112 111 91 105
27 31 32 30
43 41 40 41
⫺16 ⫺10 ⫺8 ⫺11
70 72 72 71
68 83 85
47 57 69 58
58 57 72 62
⫺11 0 ⫺3 ⫺4
105 114 141 120
37 48 55 47
44 50 62 52
⫺7 ⫺2 ⫺7 ⫺5
81 98 117 99
54 58 61 58
56 58 66 60
⫺2 0 ⫺5 ⫺2
110 116 127 118
31 41 36 36
44 48 52 48
⫺13 ⫺7 ⫺16 ⫺12
75 89 88 84
53 71 84
46 50 64 53 55
62 64 78 68 63
⫺16 ⫺14 ⫺14 ⫺15 ⫺8
108 114 142 121 118
38 36 50 41 42
42 49 57 49 49
⫺4 ⫺13 ⫺7 ⫺8 ⫺7
80 85 107 91 91
41 45 64 50 53
58 59 68 62 59
⫺17 ⫺14 ⫺4 ⫺12 ⫺6
99 104 132 112 111
30 30 42 34 33
39 44 58 47 45
⫺9 ⫺14 ⫺16 ⫺13 ⫺12
69 74 100 81 79
1
N, number of chews in each experiment. Mean values in milliseconds. Duration of time from 25% of peak EMG activity to 100% of peak EMG activity during loading. Duration of time from 100% of peak EMG activity to 25% of peak EMG activity during unloading. 4 Difference equals rise time minus fall time. 5 Duration of time from 25% of peak EMG activity during loading to 25% of peak EMG activity during unloading. 2 3
gos, and ring-tailed lemurs led us to a similar conclusion, and provided strong support for hypothesis 2, i.e., that increased recruitment of transversely directed b-s muscle force is linked to symphyseal fusion in primates (Hylander et al., 2000, 2002, 2004). The large galago ratios do, however, suggest that certain aspects of symphyseal morphology and increased vertically directed forces are linked. That is, compared to ring-tailed lemurs, galagos have little symphyseal fibrous connective tissue binding their two dentaries together (Beecher, 1977). Further-
more, compared to ring-tailed lemurs, galagos have larger W/B ratios for all jaw muscles analyzed by us (superficial and deep masseter and anterior and posterior temporalis; Hylander et al., 2000, 2004). Thus, although increased vertical force in lemurs may be linked to the increased strength of their symphysis, this increased force is not sufficient to necessitate symphyseal fusion. Finally, we are impressed by the variability in W/B ratios for the posterior temporalis muscles. These data indicate that anthropoids on average have relatively greater recruitment of their b-s pos-
50
W.L. HYLANDER ET AL. TABLE 5C. Owl monkeys1 Anterior temporalis Working
Subject Owl monkey 1 Exp. A Exp. B Exp. C Exp. D Subject means Owl monkey 2 Exp. A Exp. B Exp. C Exp. D Subject means Grand means
N
Posterior temporalis Balancing
Working
Balancing
Rise2 Fall3 Diff.4 Total5 Rise Fall Diff. Total Rise Fall Diff. Total Rise Fall Diff. Total
32 39 56 21
53 86 73 63 69
63 85 81 56 71
⫺10 1 ⫺8 7 ⫺3
116 171 154 119 140
71 102 84 91 87
46 69 59 47 55
25 33 25 44 32
117 171 143 138 142
54 72 81 77 71
63 101 80 57 75
⫺9 ⫺29 1 20 ⫺4
117 173 161 134 146
68 98 98 99 91
56 70 60 46 58
12 28 38 53 33
124 168 158 145 149
42 57 69 75
37 41 40 42 40 54
42 46 46 48 46 58
⫺5 ⫺5 ⫺6 ⫺6 ⫺6 ⫺4
79 87 86 90 86 113
44 50 41 48 46 66
41 45 41 43 43 49
3 5 0 5 3 18
85 95 82 91 88 115
36 39 41 38b 39 55
42 43 49 45 45 60
⫺6 ⫺4 ⫺8 ⫺7 ⫺6 ⫺5
78 82 90 83 83 115
43 52 46 456 47 69
41 42 42 43 42 50
2 10 4 2 5 19
84 94 88 88 89 119
1
N, number of chews in each experiment. Mean values in milliseconds. Duration of time from 25% of peak EMG activity to 100% of peak EMG activity during loading. Duration of time from 100% of peak EMG activity to 25% of peak EMG activity during unloading. 4 Difference equals rise time minus fall time. 5 Duration of time from 25% of peak EMG activity during loading to 25% of peak EMG activity during unloading. 6 Times based on right posterior temporalis electrode only. 2 3
TABLE 5D. Thick-tailed galagos1 Anterior temporalis Working Subject Galago 6 Exp. A Subject means Galago 7 Exp. A Subject means Galago 8 Exp. A Subject means Grand means
2
3
N
Rise
Fall
Diff.
45
74 74
56 56
18 18
Posterior temporalis Balancing
4
5
Total
Balancing
Rise Fall Diff. Total Rise Fall Diff. Total Rise Fall Diff. Total 73 73
49 49
24 24
122 122
42 42
42 42
0 0
84 84
37
97 97
46 46
51 51
143 143
100 100
42 42
58 58
142 142
38
62 62 77
49 49 48
13 13 29
111 111 125
62 62 68
47 47 44
15 15 24
109 109 112
74
56
18
130 130
Working
130
65 65
65
44 44
44
21 21
21
109 109
109
1
N, number of chews in each experiment. Mean values in milliseconds. Duration of time from 25% of peak EMG activity to 100% of peak EMG activity during loading. 3 Duration of time from 100% of peak EMG activity to 25% of peak EMG activity during unloading. 4 Difference equals rise time minus fall time. 5 Duration of time from 25% of peak EMG activity during loading to 25% of peak EMG activity during unloading. 2
terior temporalis muscles. That is, W/B ratios for baboons, macaques, owl monkeys, galagos, and lemurs are 1.0, 1.2, 1.4, 2.4, and 2.0, respectively. This suggests that anthropoids may emphasize an increase in posteriorly directed b-s muscle force on the mandible during mastication Similar to the lateral component of force from the b-s deep masseter, perhaps posteriorly directed force on the mandible from the b-s posterior temporalis is also linked to symphyseal fusion in primates. We do not see this as likely, however, simply because force from the b-s posterior temporalis does not appear to cause forceful bending or twisting of the macaque symphysis (Hylander, 1984). On the other hand, as compared to strepsirrhines, for anthropoids this increase in relative force from the b-s posterior temporalis may result in an increase in magnitude of the power stroke. In summary, our anterior temporalis data for primates provide no support for linking symphyseal fusion and increased recruitment of vertically di-
rected b-s muscle force. We are, however, reluctant to dismiss completely hypothesis 1, because increased vertically directed force in crown anthropoids may simply be due to an absolute increase in the mass of the anterior temporalis (Cachel, 1979; Ross, 2000; Ross and Hylander, 2000), rather than to the evolution of altered recruitment patterns, as revealed by W/B ratios.2 Also, compared to strepsirrhines, extant anthropoids are characterized by a more anteriorly repositioned and vertically aligned anterior temporalis muscle (Ross, 1995a, b, 2000; Ross and Hylander, 2000). This repositioning (and increased size?) likely results in an increase in closing moments associated with muscle force from the
2 Perhaps increased vertically directed b-s force due to enlarged temporalis muscles is largely responsible for symphyseal fusion in various large-bodied carnivorans, such as certain ursids and felids (Scapino, 1981).
51
TEMPORALIS EMG TABLE 5E. Ring-tailed lemurs1 Anterior temporalis Working Subject Ring-tailed lemur 1 Exp. C Subject means Ring-tailed lemur 2 Exp. B Exp. C Exp. D Subject means Ring-tailed lemur 3 Exp. A Exp. B Subject means Ring-tailed lemur 4 Exp. A Exp. B Exp. C Subject means Grand means
N
Posterior temporalis
Balancing
Working
Balancing
Rise2 Fall3 Diff.4 Total5 Rise Fall Diff. Total Rise Fall Diff. Total Rise Fall Diff. Total
51
56 56
45 45
11 11
101 101
58 58
44 44
14 14
102 102
55 55
43 43
12 12
98 98
62 62
43 43
19 19
105 105
44 49 33
74 74 80 76
59 58 58 58
15 16 22 18
133 132 138 134
88 91 92 90
50 50 48 49
38 41 44 41
138 141 140 140
61 58 53 57
51 51 53 52
10 7 0 6
112 109 106 109
74 74 66 71
45 49 43 46
29 25 23 26
119 123 109 117
43 41
78 68 73
60 67 64
18 1 10
138 135 137
94 97 96
45 50 48
49 47 48
139 147 143
83 81 82
52 51 52
31 30 31
135 132 134
86 101 94
42 45 44
44 56 50
128 146 137
44 67 37
71 54 54 60 68
60 54 52 55 57
11 0 2 4 11
131 108 106 115 125
89 65 72 75 83
50 52 48 50 49
39 13 24 25 34
139 117 120 125 131
76 61 55 64 65
46 49 46 47 49
30 12 9 17 16
122 110 101 111 114
82 70 61 71 75
42 48 50 47 45
40 22 11 24 30
124 118 111 118 120
1
N, number of chews in each experiment. Mean values in milliseconds. Duration of time from 25% of peak EMG activity to 100% of peak EMG activity during loading. 3 Duration of time from 100% of peak EMG activity to 25% of peak EMG activity during unloading. 4 Difference equals rise time minus fall time. 5 Duration of time from 25% of peak EMG activity during loading to 25% of peak EMG activity during unloading. 2
TABLE 6. Summary for rise, fall, and total time of EMG activity for brittle/tough foods Anterior temporalis Working Brittle/Tough Foods Rise1 Fall2 Baboons Macaques Owl Monkeys Thick-tailed galagos Ring-tailed lemurs
68 55 54 74 68
79 63 58 56 57
Diff.3 ⫺11** ⫺8** ⫺4 18 11***
Posterior temporalis Balancing
Total4 Rise Fall 147 118 113 130 125
69 42 66 65 83
81 49 49 44 49
Diff. ⫺12* ⫺7*** 18** 21 34***
Working Total Rise Fall 149 91 115 109 131
45 53 55 77 65
54 59 60 48 49
Diff. ⫺9*** ⫺6** ⫺5 29 16***
Balancing Total Rise Fall 100 111 115 125 114
46 33 69 68 75
65 45 50 44 45
Diff.
Total
⫺19*** ⫺12*** 19 24 30***
111 79 119 112 120
N ⫽ number of chews in each experiment. Mean values in milliseconds. 1 Duration of time from 25% of peak EMG activity to 100% of peak EMG activity during loading. 2 Duration of time from 100% of peak EMG activity to 25% of peak EMG activity during unloading. 3 The difference equals rise time minus fall time. 4 Duration of time from 25% of peak EMG activity during loading to 25% of peak EMG activity during unloading. *P ⱕ .10 **P ⱕ .05 ***P ⱕ .01
b-s anterior temporalis, which in turn may cause increased levels of dorsoventral shear and frontal bending of the symphysis. Rise time, fall time, and symphyseal fusion We originally hypothesized that compared to strepsirrhines, anthropoid jaw-closing muscles may have a relatively longer fall time during forceful mastication. For example, a comparison of w-s mandibular bone strain patterns of macaques, owl monkeys, and galagos (Fig. 8A–C) demonstrates differences between the duration of rise and fall times of masticatory forces during the power stroke. Furthermore, we also suspected that longer fall times in anthropoids are functionally linked to symphyseal fusion. Data in Tables 5 and 6 partially allow us to test this hypothesis.
For the five primate groups analyzed, there is considerable amount of variability in the rise, fall, and total time duration for the anterior and posterior temporalis muscles. For example, for baboons and macaques, either the rise and fall times tend to be of near equal duration, or the fall time is longer than the rise time. This contrasts with galagos and lemurs, where the duration of the rise time is usually relatively longer than the fall time. For owl monkeys, however, the rise and fall times of their w-s muscles are similar to the pattern of baboons and macaques, whereas their b-s muscles are more similar to those of galagos and lemurs. We conclude from these data that there is no linkage between a prolonged fall time of individual muscles and symphyseal fusion. This is simply because if prolonged fall times are linked to increased symph-
52
W.L. HYLANDER ET AL.
perhaps the best method for characterizing its duration (and magnitude) is by utilizing w-s mandibular corpus bone strain data (Hylander, 1986; Hylander et al., 1987). Differential firing and recruitment patterns of jaw muscles and symphyseal fusion
Fig. 8. Working-side mandibular corpus shear strain during mastication of (A) monkey chow in macaque 4, (B) hard prune in owl monkey 2, and (C) dried gelatin candy in galago 7 (data from Hylander et al., 1998).
yseal stress and a necessary strengthening of the symphysis, we would expect that this would be true for the balancing-side muscles. Instead, anthropoids uniformly differ from strepsirrhines in only having prolonged fall times of their working-side muscles. As noted above, unlike baboons and macaques, owl monkeys do not have a prolonged fall time of their b-s muscles. Finally, for individual muscles, the total time of EMG from 25% of peak activity during loading to 25% of peak activity during unloading does not indicate significant differences in the duration of the power stroke between anthropoids and strepsirrhines. On the other hand, as noted earlier, the delayed activity of the b-s posterior temporalis and b-s deep masseter in anthropoids leads us to suspect that anthropoids may have a power stroke of longer duration than these strepsirrhines (Hiiemae and Kay, 1973). Nevertheless, an EMG analysis of jaw closing muscles may not the best method available for characterizing the duration of the power stroke. Instead,
Previous work on macaques, baboons, owl monkeys, tamarins, and marmosets suggested that these anthropoids share a common b-s deep masseter firing pattern during mastication (Hylander and Johnson, 1994; Hylander et al., 2000; Vinyard et al., 2001, 2004a). On the other hand, galagos, ringtailed lemurs, treeshrews, and opossums do not have this pattern 1980 (Hylander et al., 2000, 2002, 2004; Vinyard et al., 2004b). For nonhuman anthropoids, the last masseter muscle to reach peak activity is the b-s deep (Figs. 2C, 9A). For galagos, ringtailed lemurs, tree shrews, and opossums, the b-s deep masseter reaches peak activity earlier, and the last muscle to reach peak activity is the w-s superficial masseter (Fig. 9B–D). Thus, there is a distinct difference in firing of the b-s deep masseter between thick-tailed galagos and ring-tailed lemurs on the one hand, and anthropoids on the other. We argued elsewhere that the presence or absence of the latefiring b-s deep masseter determines whether or not the primate mandible experiences wishboning during mastication (Hylander and Johnson, 1994). Furthermore, when wishboning does occur, it has the potential to cause intense tensile stress along the lingual aspect of the symphysis. The most effective way to counter these loads is to fuse the symphysis, as cortical bone is 5–10 times stronger than ligament (Panjabi and White, 2001). The cost of fusion, however, includes loss of independent movement of the dentaries, which in turn may influence occlusal function (Hylander, 1979b; Lieberman and Crompton, 2000). In summary, the data on recruitment and firing patterns of jaw-closing muscles support the hypothesis that in primates, symphyseal fusion and transversely directed muscle force during the power stroke are functionally linked (hypothesis 2). Unlike anthropoids, muscle recruitment and firing pattern data for the b-s deep masseter suggest that galago and lemur symphyses experience little if any wishboning. This is because of two major factors. First, for galagos and lemurs (also opossums and tree shrews), the overall bending moment that causes wishboning is relatively small because the force associated with this moment, i.e., the force from their balancing-side deep masseter is relatively small. Second, and more importantly, whereas the b-s deep masseter (and b-s posterior temporalis) of nonhuman anthropoids reaches peak activity following peak activity of the other jaw-closing muscles, in galagos and lemurs (also opossums and tree shrews), peak activity of the b-s deep masseter (and b-s posterior temporalis) occurs at a time when the other jaw-closers are highly active. Therefore, it is
TEMPORALIS EMG
53
Fig. 9. Mean values for timing of average percent EMG activity of deep and superficial masseters during chewing of B/T foods in (A) macaque 11, (B) galago 6, (C) opossum 1, and (D) treeshrew 1 (data from Hylander et al., 2000, unpublished data; Vinyard et al., 2004b). Vertical line indicates peak activity in reference muscle, i.e., working-side superficial masseter. WSM and BSM, w-s superficial masseter and b-s superficial masseter; WDM and BDM, w-s deep masseter and b-s deep masseter. Remaining abbreviations as in Figure 6.
quite likely that for galagos and lemurs, the moments associated with the force from the medial (and lateral?) pterygoid muscles likely counter the wishboning moments of their deep (and superficial) masseter muscles. This is not the case for anthropoids, simply because peak b-s deep masseter force follows well after most of the force occurs from the other jaw muscles, and therefore the moments associated with the remaining jaw muscles cannot counter the wishboning moments associated with the b-s deep masseter. Stiffness, strength, and symphyseal fusion Lieberman and Crompton (2000) suggested that although increased transverse b-s muscle force is associated with symphyseal fusion, and that fusion results in increased symphyseal strength, the most important characteristic associated with fusion is
that it provides increased stiffness (for a convincing contrary view, see Hogue and Ravosa, 2001). Lieberman and Crompton (2000) went on to suggest that increased symphyseal stiffness is particularly important for those mammals that have a large transverse component to their power stroke, i.e., those mammals that have relatively flat occlusal surfaces that are nearly parallel to the horizontal plane. The basis for their argument as to the functional significance of symphyseal fusion is that increased symphyseal stiffness facilitates a more complete (more efficient) transfer of transverse b-s muscle force across the symphysis. In an attempt to deal with this issue, Lieberman and Crompton (2000) defined what they meant by efficiency. As Lieberman and Crompton (2000, p. 519) clearly noted, “The term efficiency here is used in this paper in the context of the timing and degree
54
W.L. HYLANDER ET AL.
of force transfer. Stiffness increases the efficiency of force transfer between two objects because no force is stored elastically, or dissipated through movement or the generation of heat.” There are a number of problems associated with their overall argument. For starters, when these authors claim that “no force is stored elastically, or dissipated through movement or the generation of heat” in a stiff object such as a fused symphysis, they are presumably referring to energy, rather than to force. If so, their claim is incorrect, as all solid objects (e.g., ligament, cartilage, and bone) are capable of storing strain energy. Moreover, and most importantly, if energy storage, energy dissipation through movement, and energy dissipated as heat are important issues associated with the transfer of transverse b-s muscle force across an unfused symphysis, why don’t these same issues apply to the transfer of vertical b-s muscle force across an unfused symphysis? As Hogue and Ravosa (2001) noted, shouldn’t the symphysis also fuse in response to increased vertical forces so as to avoid these undesirable conditions? Finally, during force transfer across the symphysis, mechanical energy can indeed be lost to the system, and one way this can occur is when the tissues of the unfused symphysis experience the rapid accumulation of microdamage. If so, increased strength due to partial or complete fusion helps prevent structural failure of the tissues of the symphysis. Triplets, diagonals, and primates: predictions and data Weijs (1994) noted that for “primitive” mammals (including “prosimians”),3 the w-s and b-s anterior temporalis muscles fire simultaneously as members of the SVC, whereas for anthropoids, these muscles fire as members of triplets I and II. Our second major goal is to test two aspects of jaw-muscle function. First, for anthropoids and strepsirrhines during rhythmic chewing, does the w-s posterior temporalis fire as triplet I and diagonal I, and does the b-s posterior temporalis fire as triplet II and diagonal II (Weijs, 1994; Herring, 1992)? Second, for strepsirrhines, do the two anterior temporalis muscles fire simultaneously, and do they fire prior to triplet I (Weijs, 1994)? Or, do their anterior temporalis muscles simply fire as triplets and diagonals I and II? Triplets and diagonals I and II and posterior temporalis. For all subjects, the w-s posterior temporalis muscles reach peak activity prior to the w-s superficial masseter. Thus, these data indicate that the firing pattern of the w-s posterior temporalis of primates conforms to the pattern predicted by both the triplet and diagonal hypotheses. For baboons, macaques, and owl monkeys, the b-s posterior temporalis reaches peak activity well after the w-s
3
Weijs (1994) included treeshrews as prosimians.
superficial masseter, whereas for galagos and lemurs, it fires with the w-s superficial masseter. These data also indicate that the firing pattern for the b-s posterior temporalis in primates conforms more or less to the triplet and diagonal hypotheses. Furthermore, it appears that anthropoids may have prolonged the duration of the power stroke by delaying the firing of the b-s posterior temporalis, as well as the b-s deep masseter. Symmetric vertical closers and anterior temporalis. In all five groups of primates, the w-s anterior temporalis reaches peak activity prior to the w-s superficial masseter, and its timing is not significantly different from that of the w-s posterior temporalis. In baboons, macaques, owl monkeys, and galagos, the b-s anterior temporalis reaches peak activity slightly after the w-s superficial masseter, but only for owl monkeys are the mean values significantly different (P ⱕ 0.05). For lemurs, the b-s anterior temporalis reaches peak activity before the w-s superficial masseter (P ⱕ 0.01), but well after the b-s superficial masseter muscle. These data demonstrate that in strepsirrhine primates, the w-s and b-s anterior temporalis muscles do not fire symmetrically, nor do they only fire during fast closing, prior to triplet I. Instead, as in anthropoids, the w-s anterior temporalis always leads the b-s anterior temporalis. Furthermore, the w-s anterior temporalis fires near simultaneously with the w-s posterior temporalis. On the balancing side, the anterior temporalis firing pattern is more variable. For baboons and macaques, the b-s anterior temporalis fires slightly after the w-s superficial masseter, but these differences are not statistically significant from one another (P ⱕ 0.1). For owl monkeys, the b-s anterior temporalis also fires after the w-s superficial masseter (P ⱕ 0.05). Finally, for lemurs, the b-s anterior temporalis fires before the w-s superficial masseter (P ⱕ 0.01), but still well after triplet I and diagonal I muscles. In summary, it is clear that similar to anthropoids, among strepsirrhines the w-s and b-s anterior temporalis muscles do not fire simultaneously, nor well before triplet I and diagonal I. As a first approximation, the w-s and b-s temporalis muscles of primates simply fire as members of triplets and diagonals I and II, respectively. An arguable exception to this pattern is that for anthropoids, the b-s posterior temporalis firing peaks very late in the power stroke. As in pigs (Herring, 1993), this late firing of the b-s posterior temporalis in anthropoids likely assists the b-s deep masseter in driving the w-s molars through the terminal portion of the power stroke (Hylander and Johnson, 1994). CONCLUSIONS The purpose of this study was to analyze the force recruitment and firing patterns of the anterior and posterior temporalis muscles in strepsirrhine and anthropoid primates. As indicated by the W/B ratios,
TEMPORALIS EMG
the data for the anterior temporalis provide no support for the hypothesis that symphyseal fusion in primates is linked to vertically directed jaw muscle forces during forceful mastication. Thus, indirectly, these data provide support for the hypothesis that symphyseal fusion in primates is most importantly linked to transversely directed forces. Another purpose of this study was to confirm whether primates conform to current notions as to how mammalian jaw muscles work during mastication. The firing patterns of the anterior and posterior temporalis of anthropoids conform well to the diagonal hypothesis of Herring (1993) and the triplet hypothesis of Weijs (1994). This is only partially true for strepsirrhines. Although the firing patterns of the posterior temporalis of our two groups of strepsirrhines conform to these two hypotheses, data for the anterior temporalis only conform to the diagonal hypothesis. Weijs (1994) hypothesized that prosimians (plus an array of other “primitive” mammals) retain the primitive mammalian condition for the firing pattern of their anterior temporalis. That is, that the working- and balancing-side anterior temporalis muscles in these mammals fire synchronously, only during fast closing, and do not fire during the power stroke of mastication. Our data demonstrate that this is not the case for thick-tailed galagos and ring-tailed lemurs. Instead, the firing patterns for their anterior temporalis muscles are virtually identical to those of anthropoids. That is, they fire asynchronously, reach peak activity during the power stroke, and are an important source of masticatory force during the power stroke of mastication. Moreover, both increased recruitment and late firing patterns of the b-s posterior temporalis suggest that anthropoids may emphasize the duration and magnitude of the power stroke. Finally, during the late portion of the power stroke, the b-s posterior temporalis assists the b-s deep masseter in driving the working-side molars through the terminal portion of occlusion. ACKNOWLEDGMENTS This study was supported by research grants from the NIH (Merit Award DE04531 to W.L.H.; DE05595 to M.J.R. and W.L.H.; and DE05663 to C.E.W. and W.L.H.) and NSF (SBR-9420764 to WLH and BCS-0138565 to W.L.H., C.E.W., and C.J.V.; and BNS-91-00523 to C.F.R. and W.L.H.). Thanks go to Dr. Don Schmechel for providing us access to the galagos in his care, and to the veterinary staff at the Duke University Primate Center. This is Duke University Primate Center publication #765. LITERATURE CITED Beecher RM. 1977. Function and fusion at the mandibular symphysis. Am J Phys Anthropol 47:325–336. Beecher RM. 1979. Functional significance of the mandibular symphysis. J Morphol 159:117–130.
55
Cachel SM. 1979. A functional analysis of the primate masticatory system and the origin of the anthropoid post-orbital septum. Am J Phys Anthropol 50:1–18 Connolly R, Quimby FW. 1978. Acepromazine-ketamine anesthesia in the rhesus monkey (Macaca mulatta). Lab Anim Sci 28:72–74. Crompton AW. 1995. Masticatory function in nonmammalian cynodonts and early mammals. In Thomason JJ, editor. Functional morphology in vertebrate paleontology. Cambridge: Cambridge University Press. p 55–75. Crompton AW, Hylander WL. 1986. Changes in mandibular function following the acquisition of the dentary-squamosal jaw articulation. In: Hotton N, MacLean PD, Roth JJ, editors. The ecology and biology of mammal-like reptiles. Washington, DC: Smithsonian Institution Press. p 263–282. de Vree F, Gans C. 1976. Mastication in pygmy goats (Cupra hircus). Ann Soc R Zool Belg 105:255–306. Gorniak GC. 1977. Feeding in golden hamsters, Mesocricetus auratus. J Morphol 154:427– 458. Herring SW. 1976. The dynamics of mastication in pigs. Arch Oral Biol 21:473– 480. Herring SW. 1985a. Morphological correlates of masticatory patterns in peccaries and pigs. J Mammol 66:603– 617. Herring SW. 1985b. The ontogeny of mammalian mastication. Am Zool 25:339 –349. Herring SW. 1992. Muscles of mastication: Architecture and functional organization. In: Davidovitch Z, editor. Biological mechanisms of tooth movement and craniofacial adaptation. Columbus, OH: Ohio State University College of Dentistry. p 541– 548. Herring SW. 1993. Epigenetic and functional influences on skull growth. In: Hanken J, Hall BK, editors. The skull, volume 1: development. Chicago: University of Chicago. p 153–206. Herring SW, Scapino RP. 1973. Physiology of feeding in miniature pigs. J Morphol 141:427– 460. Hiiemae KM, Kay RF. 1973. Evolutionary trends in the dynamics of primate mastication. In: Zingeser MR, editor. Craniofacial biology of primates. Basel: Karger. p 28 – 62. Hogue AS, Ravosa MJ. 2001. Transverse masticatory movements, occlusal orientation, and symphyseal fusion in selenodont artiodactyls. J Morphol 249:221–241. Hylander WL. 1975. The human mandible: lever or link? Am J Phys Anthropol 43:227–242. Hylander WL. 1977. In vivo bone strain in the mandible of Galago crassicaudatus. Am J Phys Anthropol 46:309 –326. Hylander WL. 1979a. Mandibular function in Galago crassicaudatus and Macaca fascicularis: an in vivo approach to stress analysis of the mandible. J Morphol 159:253–296. Hylander WL. 1979b. The functional significance of primate mandibular form. J Morphol 160:223–240. Hylander WL. 1984. Stress and strain in the mandibular symphysis of primates: a test of competing hypotheses. Am J Phys Anthropol 64:1– 46. Hylander WL. 1985. Mandibular function and biomechanical stress and scaling. Am Zool 25:315–330. Hylander WL. 1986. In-vivo bone strain as an indicator of masticatory bite force in Macaca fascicularis. Arch Oral Biol 31: 149 –157. Hylander WL, Johnson KR. 1989. The relationship between masseter force and masseter electromyogram during mastication in the monkey Macaca fascicularis. Arch Oral Biol 34:713–722. Hylander WL, Johnson KR. 1993. Modelling relative masseter force from surface electromyograms during mastication in nonhuman primates. Arch Oral Biol 38:233–240. Hylander WL, Johnson KR. 1994. Jaw muscle function and wishboning of the mandible during mastication in macaques and baboons. Am J Phys Anthropol 94:523–547. Hylander WL, Johnson KR, Crompton AW. 1987. Loading patterns and jaw movements during mastication in Macaca fascicularis: a bone-strain, electromyographic, and cineradiographic analysis. Am J Phys Anthropol 72:287–314. Hylander WL, Johnson KR, Crompton AW. 1992. Muscle force recruitment and biomechanical modeling: an analysis of mas-
56
W.L. HYLANDER ET AL.
seter muscle function in Macaca fascicularis. Am J Phys Anthropol 88:365–387. Hylander WL, Ravosa MJ, Ross CF, Johnson KR. 1998. Mandibular corpus strain in primates: further evidence for a functional link between symphyseal fusion and jaw-adductor muscle force. Am J Phys Anthropol 107:257–271. Hylander WL, Ravosa MJ, Ross CF, Wall CE, Johnson KR. 2000. Symphyseal fusion and jaw-adductor muscle force: an EMG study. Am J Phys Anthropol 112:469 – 492. Hylander WL, Vinyard CJ, Wall CE, Williams SH, Johnson KR. 2002. Recruitment and firing patterns of jaw muscles during mastication in ring-tailed lemurs. Am J Phys. Anthropol [Suppl] 34:88. Hylander WL, Wall CE, Vinyard C, Ross CF, Ravosa MJ, et al. 2004. Jaw adductor force and symphyseal fusion. In: Anapol F, German R, Jablonski N, editors. Shaping primate evolution. Cambridge: Cambridge University Press. p 229 –257. Langenbach GEJ, van Eijden TMGJ. 2001. Mammalian feeding motor patterns. Am Zool 41:1338 –1351. Lieberman DE, Crompton AW. 2000. Why fuse the mandibular symphysis? A comparative analysis. Am J Phys Anthropol 112: 517–540. Luschei ES, Goodwin GM. 1974. Patterns of mandibular movement and jaw muscle activity during mastication in the monkey. J Neurophysiol 37:954 –966. Moller E. 1966. The chewing apparatus: an electromyographic study of the action of the muscles of mastication and its correlation to facial morphology. Acta Physiol Scand [Suppl] 69:1–229. Panjabi MM, White AA. 2001. Biomechanics in the musculoskeletal system. New York: Churchhill Livingstone. Ravosa MJ, Hylander WL. 1994. Function and fusion of the mandibular symphysis in primates: stiffness or strength? In: Fleagle JG, Kay RF, editors. Anthropoid origins: the fossil evidence. New York: Plenum Press. p 447– 468. Ross CF. 1995a. Muscular and osseous anatomy of the primate anterior temporal fossa and the function of the postorbital septum. Am J Phys Anthropol 98:275–306.
Ross CF. 1995b. Allometric and functional influences on orbit orientation in primates and the origins of the Anthropoidea. J Hum Evol 29:201–227. Ross CF. 2000. Into the light: the origins of the Anthropoidea. Ann Rev Anthropol 29:147–194. Ross CF, Hylander WL. 2000. Electromyography of the anterior temporalis and masseter muscles of owl monkeys (Aotus trivirgatus) and the function of the postorbital septum. Am J Phys Anthropol 112:455– 468. Scapino RP. 1981. Morphological investigations into functions of the jaw symphysis in carnivorans. J Morphol 167:339 –375. Sokal RR, Rohlf FJ. 1981. Biometry. New York: W.H. Freeman. Vinyard CJ, Williams SH, Wall CE, Johnson KR, Hylander WL. 2001. Deep masseter recruitment patterns during chewing in callitricids. Am J Phys Anthropol [Suppl] 32:156. Vinyard CJ, Ravosa MJ, Wall CE, Williams SH, Johnson KR, et al. 2004a. Jaw-muscle function and the origins of primates. In: Ravosa MJ, Dagosto M, editors. Primate origins and adaptations: a multidisciplinary perspective. New York: Kluwer Press (in press). Vinyard CJ, Williams SH, Wall CE, Johnson KR, Hylander WL. 2004b. Jaw-muscle electromyography during chewing in Belanger’s treeshrews (Tupaia belangeri). Am J Phys Anthropol (accepted for publication). Weijs WA. 1994. Evolutionary approach of masticatory motor patterns in mammals. In: Bels M, Chardon VL, Vandewalle P, editors. Biomechanics of feeding in vertebrates. Berlin: Springer-Verlag. p 282–320. Weijs WA, Dantuma R. 1981. Functional anatomy of the masticatory apparatus in the rabbit (Oryctolagus cuniculus L.). Neth J Zool 31:99 –147. Williams CV, Glenn KM, Levine JF, Horne WA. 2003. Comparison of the efficacy and cardiorespiratory effects of medetomidine-based anesthetic protocols in ring-tailed lemurs (Lemur catta). J Zoo Wildlife Med 34:163–170.