one based on simulated data and the other based on administrative micro data from. Missouri. .... uniform across the test-score distribution â scores at the center of the ...... size and call it R. We say that the CSEM weights offer benefits in model ...
Test Measurement Error and Inference from Value-Added Models Cory Koedel Rebecca Leatherman Eric Parsons* August 2012
It is widely known that standardized tests are noisy measures of student learning, but value added models (VAMs) rarely account for test measurement error (TME). We incorporate information about TME directly into VAMs, focusing on TME that derives from the testing instrument itself. Our analysis is divided into two parts – one based on simulated data and the other based on administrative micro data from Missouri. In the simulations we control the data generating process, which ensures that we obtain accurate TME metrics. In the real-data portion of our analysis we use estimates of TME provided by a major test publisher. In both the simulations and real-data analyses, we find that inference from VAMs is improved by making simple TME adjustments to the models. The improvement is larger in the simulations, but even in the real-data analysis the improvement is on the order of what one could expect if teacher-level sample sizes were increased by 11 to 17 percent.
* University of Missouri, Department of Economics. The authors thank Daniel McCaffrey for useful comments and Mark Ehlert for research assistance. The usual disclaimers apply.
I.
Introduction Value-added models (VAMs) are commonly used to evaluate educational interventions in
research. Moreover, school districts and state education agencies across the country are increasingly relying on VAMs to measure school and teacher performance, sometimes with high stakes attached.1 The rapid expansion of VAM-based teacher evaluations is driven by a large body of research showing that teacher effectiveness varies considerably (for a review of the literature see Hanushek and Rivkin, 2010).2 This variability is poorly reflected by traditional teacher evaluations (The New Teacher Project, 2009), which has led to a number of recent studies suggesting that teacher assessments based on student test scores be incorporated into the evaluation process at some level (Boyd et al., 2011; Goldhaber and Hansen, 2010; Hanushek, 2009; Podgursky and Springer, 2007; Staiger and Rockoff, 2010). While concerns about using VAMs for high-stakes decisions in education remain (Briggs and Domingue, 2011; Corcoran, 2010; Hill, 2009; Rothstein, 2010), there is a growing consensus that VAMs can play a productive, if not yet entirely determined, evaluative role in education (Harris, 2011). The issue of test-based measurement error (TME) has received little direct attention in the research literature on VAMs.3 It is well known that tests are noisy measures of student learning, which can affect inference from the models. For example, value-added estimates can be biased if students are sorted based on true achievement and there is measurement error in the lagged-score control(s) (Lockwood and McCaffrey, 2012). Furthermore, even when sorting bias is not a key Recent “Race to the Top” legislation encourages states to design teacher evaluation systems based on student achievement. Some of the winning proposals attached consequences to VAM-based assessments including tenure denial and tenure revocation. Other federal programs, like the Teacher Incentive Fund, also encourage achievement-based teacher evaluations. In addition, locales from Washington DC to New York City to the state of Missouri are experimenting with VAM-based accountability in a variety of forms. 2 Chetty et al. (2011) and Hanushek (2011) link variation in teaching effectiveness to future labor market outcomes for students. Both studies find that high-quality teachers have great economic value. 3 McCaffrey et al. (2003) make this point in a book that predates much of the VAM literature. But despite the rapid growth of research in this area in recent years, few studies have directly examined the implications of test measurement error for VAMs. Notable recent exceptions include Boyd et al. (2008) and Lockwood and McCaffrey (2012). 1
1
concern – for instance, if students are sorted to teachers at random, or more generally, when bias from non-random sorting is determined to be negligible – TME can still affect inference from VAMs. This is particularly true when the objective is to evaluate individual teachers because (1) teacher-level sample sizes are inherently small and (2) the share of the variance in student test-score gains attributable to TME is large. The contribution of the present study is to examine the extent to which inference from VAMs can be improved, from an efficiency perspective, by incorporating TME information directly into the models. We focus on VAMs that are designed to estimate teacher effects. Beginning in a simulated data environment where we control the data generating process, we incorporate information about TME into VAMs under ideal estimation conditions. We describe the estimation conditions as “ideal” for two reasons. First, our knowledge of the data generating process ensures that we obtain accurate TME metrics. Second, by construction, we abstract from any issues related to student-teacher sorting bias. Our simulation analysis shows that incorporating TME information into VAMs can meaningfully improve the accuracy of estimated teacher effects. Next, we extend our analysis to examine real data from the state of Missouri and readilyavailable TME metrics. We augment our models with conditional standard errors of measurement (CSEMs), which are publisher-provided estimates of the TME variance in student test scores. The CSEMs capture TME variance derived from the testing instrument itself – for example, TME resulting from the process by which raw scores are converted to scale scores and from randomness in the selection of test items (Boyd et al., 2012). Consistent with our simulation results, we find that the Missouri VAMs perform better, in the sense that the teacher-effect estimates are more precise, when we incorporate the CSEMs directly into the models. We benchmark the improvement in model performance by comparing it to the improvement that would come from increasing withinteacher sample sizes. Modifying a typical VAM to include the CSEM information produces an 2
improvement similar to what would be observed if within-teacher sample sizes were increased by 11-17 percent. Our findings support the immediate adaptation of VAMs to incorporate readily-available CSEM data. The efficiency gains that come from incorporating the CSEMs into VAMs are modest, but can be had at near-zero cost and are notable given the increased reliance on VAMs for highstakes teacher assessments nationwide. Our analysis also suggests that even larger improvements in model performance may be possible by incorporating TME information into VAMs. One indication of the potential for improvement comes from a comparison between our simulation and real-data analyses. The simulations provide an upper bound of sorts on how much we can hope to gain by incorporating TME information into VAMs, and the gains in the real-data models do not reach the frontier. Also, because we use CSEM-based TME metrics, we only consider TME that derives from the testing instrument itself. Thorndike (1951) discusses a number of other possible factors that may contribute to TME, and Boyd et al. (2012) suggest a framework for constructing more broadlydefined TME metrics. In an exploratory analysis, we consider a case where the total TME variance from all sources is on the order of what is suggested by Boyd et al. (2012) and find small additional improvements in model performance associated with our procedure. II.
Background Value-Added Models We focus our analysis on the most-commonly used models for teacher evaluation in current
practice.4 From an informal review of the various VAMs in use in different locales across the nation, we conclude that the typical VAM takes the following general form:
Yit 0 Yit 11 X it 2 Tit it
(1)
Previous research discusses the basic modeling assumptions that underlie VAMs. See Harris et al. (2011) and Todd and Wolpin (2003) for methodological overviews. 4
3
In equation (1), Yit is a test score for student i in year t, Yit 1 is the lagged score, X it is a vector of student-level covariates, and Tit includes indicator variables for students’ teacher assignments. Many variants of this general modeling structure can be found, including models that (1) control for multiple measures of lagged performance, (2) control for school- and/or classroom-level aggregated student characteristics, (3) estimate the teacher effects as random instead of fixed, and (4) are estimated in multiple levels. In addition, it is common in the research literature to see models that incorporate multiple levels of fixed effects (i.e., schools, students), although we are not aware of any such models in present policy application.5 In the analysis that follows we focus on the basic modeling structure presented in equation (1) and its gainscore analog. The gainscore version of (1) forces 1 1 and moves the lagged-score term to the left-hand side of the equation. Although the gainscore VAM has some undesirable properties (Andrabi et al., 2011) and is less common in application than the general VAM, it offers a key benefit for our analysis: namely, all of the TME is in the dependent variable. Test Measurement Error It is well understood that test scores are noisy measures of student learning, and test publishers have long provided TME information along with student scores. However, in practice this information is rarely incorporated into VAMs.6 An important aspect of TME is that it is not uniform across the test-score distribution – scores at the center of the distribution are measured with less error than scores in the tails. The intuition is that standardized tests are well-designed to assess student learning for “targeted” students (who score near the center of the distribution), but Another class of models is based on transformed student scores, where the typically-suggested transformation is into percentiles (Ballou, 2009; Betebenner, 2008; Neal and Barlevy, forthcoming). We do not examine these models here, but the general concerns about TME that we raise will apply to transformed student scores as well. 6 Recent exceptions include the models being estimated in Washington DC (Isenberg and Hock, 2010) and New York City (Value-Added Research Center, 2010). Of note, however, is that neither of the technical reports associated with these models cites any research that directly assesses the TME issue within the VAM context. 5
4
not for students whose level of knowledge is not well-aligned with the content of the exam (who score in the tails of the distribution).7 Test publishers provide conditional standard errors of measurement (CSEMs) as estimates of the TME variance associated with student scores. In brief, the CSEMs are based on item-level information functions, which depend on item-level response functions. The response functions predict the likelihood that a student with ability will answer each item q correctly. In the standard three-parameter framework, the response functions take the following form (following Baker’s (2001) notation): Pq ( ) cq (1 cq )*
1 1 e
aq ( bq )
(2)
In equation (2), the parameters aq, bq and cq represent, respectively, the extent to which question q discriminates between students by ability, the general difficulty of the item, and the likelihood of success from guessing.8 During the test-calibration process these parameters are estimated via maximum likelihood (MLE), and an iterative MLE procedure is used to jointly estimate for each exam taker, thus defining the ability scale of the exam. With the scale and parameters determined in this manner, the ability level, θ, of future test takers is estimated using standard MLE.9 The response functions are used to estimate item-level information functions (see Baker, 2001). Because the information functions depend on the response functions, the information functions are also conditional on student ability. The information function for the entire exam is the summation of the item-level information functions.
The non-uniformity of TME variance across the underlying score distribution is often ignored in application. Recent exceptions in the research literature include Boyd et al. (2012) and Lockwood and McCaffrey (2012). 8 The distinction between “discrimination” and “difficulty” is that the “discrimination” parameter measures how quickly the probability of answering the question correctly changes over the ability spectrum, while the “difficulty” parameter defines the ability level at which the probability of a correct answer is midway between certainty and random guessing. 9 More information on this process can be found in Baker (2001), Lord (1980, 1984) and Hambleton et al. (1984). 7
5
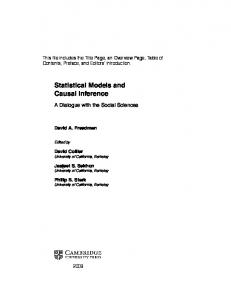
Figure 1 shows publisher-provided CSEM data from the Missouri Assessment Program (MAP) exam. The CSEMs are plotted against students’ scale scores for the 2009 cohort of Missouri fifth graders. The U-shape in the figure reflects the relative precision of test scores in the center of the distribution relative to the tails. One reason for the U-shape is that for high- and low-ability students, the exam contains fewer discriminatory items.10 The key question that we aim to answer is this: if we adjust VAMs to account for the fact that some student scores are measured with more error than others, can we improve inference? Our analysis requires growth-based TME metrics because VAMs are models of test-score growth. However, CSEMs are estimated and reported by publishers in levels. We follow Thompson (2008) to convert level-score CSEMs into gainscore CSEMs, which we use as the TME metrics for the bulk of our analysis.11 To illustrate the construction of the gainscore CSEMs we write student i’s test score in year t as Sit it it ; where Sit is comprised of a true ability component, it , and a TME component, it . The TME variance in the level score is the variance of it . Academic growth can be written as AGit it it 1 , and is observed as Git AGit (it it 1 ). Under the maintained assumption that the TME realizations are uncorrelated over time, cov(it , it 1 ) = 0, which means that the TME variance in gainscores can be written as {var( it ) + var( it 1 )}. Noting that the publisher-provided CSEMs estimate level-score standard errors conditional on ability, it follows from above that the formula for the gainscore CSEM is:12
Baker (2001) illustrates the discrimination property graphically. Item-level response curves are S-shaped. That is, their slopes flatten in the tails of the ability distribution, making it more difficult to discriminate between students at particularly high and low ability levels. 11 Later on, we also consider a slight modification to Thompson’s (2008) approach that produces a different TME metric for application in the lagged-score VAM. 10
Sit and Sit 1 ) have the same gainscore CSEM. This is because scale scores are MLE estimates of true achievement; e.g., E ( Sit ) it . 12
Note that in practice students with the same observed scores in periods t and (t-1) (i.e.,
6
CSEM ( AGit ) CSEM (it )2 CSEM (it 1 )2
III.
(3)
Simulations We begin our evaluation by constructing a simulated data environment where we control the
data generating process. This ensures that we know the variance of the distribution from which the TME component for each student’s score is drawn – unlike with real data, we do not need to rely on estimates of the TME variance. We also assign students to teachers at random, which removes any issues related to sorting bias from the simulations by construction, and allows us to isolate the potential efficiency gains from incorporating TME into VAMs free from other confounding factors. For simplicity we focus on a simple gainscore model in the simulations. Again, the benefit of the gainscore framework is that all of the TME is in the dependent variable, which allows for a straightforward TME adjustment. When we turn to the real data, we evaluate both gainscore and lagged-score VAMs. Data Construction We construct each student’s gainscore in the simulations as the summation of three components: (1) a student-specific component, α, (2) a TME component, λ, and (3) a teacher-effect component, τ:
Gi i i i
(4)
An important aspect of the simulation design is that each component’s variance share in the simulated data is proportional to its real-world variance share. Beginning with the teacher-effect components, Rockoff (2004) reports that teacher effects explain roughly 4 percent of the variation in student test-score levels. Therefore, we estimate the variance share of the gainscores attributable to the teacher effects as
0.04* var( S ) , where var(S) is var(G )
the variance of student test-score levels, and var(G) is the variance of students’ test-score gains. We 7
estimate the test-score variances (in levels and gains) using test data from the 2009 cohort of grade-5 students in Missouri (the gainscore variance is for the gain between grades 4 and 5). The teacher effects are drawn from a normal distribution and explain 9 percent of the total variance in gainscores in the simulated data. Next we use data from the same cohort of grade-5 Missouri students to determine the TME variance share. We begin by calculating students’ gainscore CSEMs as in equation (2), then take the weighted average of the squared CSEMs across the entire distribution of scores from the state. This provides an estimate of the TME variance in student gainscores, which we divide by var(G) to obtain the TME variance share. Our calculations indicate that TME explains 50 percent of the total gainscore variance. In constructing students’ gainscores for the simulations, we draw from the actual distribution of Missouri gainscore CSEMs and then rescale the draws by a constant to ensure that the overall TME-variance share is 50 percent.13 Finally, the remaining components to the gainscores – the student components – are drawn from a normal distribution weighted so that the student components sweep up the residual gainscore variance (i.e., the variance not explained by teachers or TME). Conceptually then, the variability in the student components contains everything that one might observe in a student score other than test-based measurement error and teacher effects. This includes student ability, luck, nonschooling inputs, etc. The variance share of the student component is approximately 41 percent.14 After creating the three properly-weighted distributions that represent the student, TME and teacher-effect components, we construct a dataset consisting of 2000 students. The process for The 50-percent figure may seem high, but note that the variance in student scores attributable to differences in student ability is much smaller in test-score gains than test-score levels. Conversely, the variance in student scores attributable to TME increases moving from levels to gains (by virtue of each gain being the function of two noisily-estimated level scores). In fact, the 50-percent figure is surely an understatement of gainscore TME, broadly defined, in that it is derived solely from TME related to the testing instrument itself. Below we consider the potential for the TME variance to be much larger, which is likely when multiple sources of measurement error are considered (Boyd et al., 2012). 14 A portion of the student-component variance could also be properly characterized as TME variance, e.g. the effect of an exam-day illness, although the TME in the student component is not related to the testing instrument itself. 13
8
assembling the student scores is as follows. First, we take 2000 draws from the student-component distribution. We rank the student components from largest to smallest in absolute value and then assign draws from the TME distribution to the student components so that the largest TME variance metrics are assigned to the student components that are largest in absolute value.15 Noting that the TME metrics measure the TME variance associated with a given score, not the realized TME, we take a random draw from a normal distribution with the indicated variance to create the realized TME value for each student. Finally, we randomly assign the students to teachers, and in doing so we attach the teacher-effect components and complete the observed scores. The random assignment of students to teachers is consistent with the objective of examining the efficiency gains from incorporating TME into VAMs under ideal estimation conditions – it mitigates any concerns about sorting bias in the simulations. We examine the issue of student-teacher sorting bias directly when we analyze the Missouri data (Section VI). We evaluate the effects of the TME adjustments over a range of different class-size scenarios. Noting that in practice some VAMs evaluate teachers based on as few as five students (e.g., see Isenberg and Hock, 2010), we consider class sizes of 5, 10, 20, 40, 60, 80 and 100. The larger “class size” scenarios can be thought of in the context of teacher evaluations that span multiple years.16 We redraw the student scores, re-attach new TME metrics, and re-assign students to
In reality, the largest CSEMs are associated with the largest and smallest level scores as shown in Figure 1. Assigning the TME metrics in the simulations based on the gainscore magnitudes, therefore, is imperfect; but it is of little consequence in practice because the key issue for the simulations is how TME is distributed across teachers. More specifically, the key condition for the TME adjustments to improve inference from the models is that high- and lowTME students are dispersed across classrooms. 16 Our simulations ignore the issue of class-specific shocks, which are ruled out by the data generating process. The weighting, of course, would also clarify the “shock” effects from year to year in real data. Whether this would be desirable or not depends on whether the shocks capture true year-to-year variability in effectiveness or something unrelated to teacher quality. Also, caution should be used in extrapolating the simulation results into higher grades as the simulations are parameterized using elementary-level data. One way that the data generating process may be different in higher grades, for example, is that individual teachers may contribute less to student test-score growth. 15
9
teachers 1,000 times. We report our results by averaging our findings across the 1,000 simulations.17 Analysis and Results We estimate the following gainscore model using the simulated data:
Gi Ti i
(5)
In (5), Gi is student i’s gainscore and Ti is a vector of teacher indicator variables. The simulations are designed so that student covariates are irrelevant (i.e., the student components of the test scores do not depend on any covariates, and even if they did, students are assigned to teachers at random). We also abstract conceptually from schools for simplicity, although putting additional structure on the simulations to incorporate schools would not affect our findings qualitatively.18 All teachers are assigned equal-sized classes in the simulated data. Because we know the data generating process we can compare the teacher-effect estimates from the models, ˆ , to the true teacher effects, . Noting that all of the TME is in the dependent variable in equation (4), the TME adjustment involves weighting the model by the inverse of the TME metric (i.e., the standard deviation of the TME variance). The intuition behind the weighting is simple: student scores measured with more precision will be assigned higher weights relative to noisier student scores. So, for example, if a teacher has 15 students with relatively precise scores and 5 students with relatively noisy scores, the 15 students will contribute more toward the teacher’s estimated effect. Table 1 shows the simulation results. In the first panel we report correlations between the actual teacher effects and the estimates from the weighted and unweighted models. In the second panel we document how the inaccuracies in the estimated teacher effects correspond to cross-
We run the simulations using 2000 students in all class-size scenarios. So, for example, when class sizes are set to 5 students we use 400 teachers; when class sizes are set to 10 we include 200 teachers; and so on. The exception is the 60student class-size scenario, where we use 1980 students (and 33 teachers). 18 Most of the variance in student test scores occurs within, and not between, schools (also see Kane and Staiger, 2002). Per Figure 1, this ensures that there is considerable dispersion of TME within schools. Only if the within-school variability in TME were small would the division of students into schools become an important issue for our analysis. 17
10
quintile movements in teacher rankings. We focus on “major” classification errors, which we define as occurring whenever a teacher’s placement in the distribution is off by more than one quintile (e.g., a teacher below the 20th percentile in the true distribution whose estimate suggests she belongs above the 40th percentile).19 For all class-size scenarios the TME weighting produces improvements in inference from the VAM. In terms of the correlations, the gains decline monotonically as the student-teacher ratio increases.20 This is to be expected because the TME is mean-zero. In most cases the improvement in model performance translates into real consequences for teachers’ quintile rankings. For example, in the 20-student class size scenario the TME weighting is associated with a five percentage-point increase in the number of teachers without a major classification error (from 79 to 84 percent).21 The gains from weighting are largest for the smallest class-size scenarios, which supports our focus on teacher evaluations. Models that evaluate teachers based on a single year of data, where the typical number of observations per teacher would be close to 20, are particularly likely to benefit from TME adjustments. Table 1 also suggests that non-negligible efficiency gains are possible for multi-year models; for example, a model that uses three years of data for each teacher would be expected to include, on average, 50-70 student observations for the typical elementary teacher. In contrast, TME weighting is likely to be less beneficial for school-level evaluations. Notice that by the time we reach 100 observations per teacher, the gains in model performance become quite small. In
The efficiency gains can be documented in other ways too. For example, the average standard error of the teacher effects declines in magnitude by 16-17 percent when we weight the models in each class-size scenario. The absolute improvement, of course, is larger when class sizes are smaller. 20 This is true when the gains are measured as a percentage of the unweighted baseline. The gains as measured by the absolute difference between the weighted and unweighted correlations also mostly decline as the student-teacher ratio rises, with the exception occurring between the five- and ten-student scenarios. 21 The pattern of results in the second panel is interesting. For very small class sizes, when the teacher effect estimates are extremely noisy, the gains from TME-weighting are small; then they rise for mid-sized classes; then decline again for large classes. The intuition is that the noise is so large in the small-class scenarios that the improvements from weighting are often not large enough to prevent major errors. When classes get very large (e.g., n=100), of course, placement errors are uncommon with and without weighting. 19
11
most school-level VAMs, particularly in analyses that involve multiple years of data, schools will be associated with well over 100 student observations. Extensions We briefly consider two extensions that modify the estimation conditions in the simulations. First, we introduce noise into the weights. Specifically, we replace the precise weights with a weighted average of the precise weights and a pure-noise component. We construct new weights as 2 2 Wi 1/ ( * TME ,i (1 ) WN ,i ) , where TME ,i
WN
is the TME-variance for observation i,
1 N 2 TME ,i , and WN ,i is drawn for each student from a uniform distribution over the range N i 1
WN [0.80*WN ]. 22 The preceding simulation results reflect the case where 1 ; we additionally consider cases where =0.0, 0.25, 0.50 and 0.75. We report our findings in Table 2. For brevity, we show results for the scenario with 20 students per teacher only. Table 2 shows average correlations between the actual and estimated teacher effects, with the different weights, across 1,000 simulation draws. In addition, we report the standard deviation of the correlation estimates across the simulation draws. In Table 1, the correct weights ensure that the draw-to-draw variability is smaller than in the unweighted case. However, in Table 2, where we apply the wrong weights, this is no longer necessarily the case. Note that even in the extreme situation where is set to zero – that is, where the weights are incorrect but random – the average
There are reasonable alternative procedures that could be used to introduce imprecision into the TME metrics. Unfortunately, we are not aware of any information on the reliability of currently-available TME metrics, so the 22
parameterization we use here is somewhat arbitrary. The distribution of
WN ,i
was chosen such that the variance of the
noise component across students is approximately one quarter of the variance of the TME component across students. In Appendix A we show similar output where
2 Wi 1/ ( * TME ,i ) . In this case the weights are suboptimal but
ordinally accurate.
12
correlation over 1,000 simulations is the same as in the unweighted case.23 But what the average correlations mask is revealed by the correlation-variance estimates: as the weights become less and less accurate, the standard deviation of the correlations across draws increases. Unsurprisingly, Table 2 shows that weighting works best when we use more accurate weights. As the weights become less accurate, the average correlations approach the unweighted average and the variance in the accuracy of the results from draw-to-draw increases. Based on the scenario we’ve constructed, the standard deviation of the correlations for the weighted estimates does not exceed the standard deviation for the unweighted estimates until 0. However, it is important to recognize that this result depends partly on our parameterization. If, for example, we increased the magnitude of the variance of WN ,i , the average correlation would be lower and the standard deviation of the correlation higher for all . The key takeaway from Table 2 is that the gains from weighting are reduced as imprecision in the weights increases. Whether the level of imprecision in the real-data weighting metrics is too large for weighting to improve model performance is an empirical question, which we address below in our analysis of the Missouri data. Next, we return to using the correct weights but adjust the data-generating process so that TME variance accounts for a larger share – 80 percent – of the total variance in student scores. We maintain the teacher-effect variance share at 9 percent, and reduce the student-component share to 11 percent to accommodate the larger TME variance. The 80 percent figure is based on findings from Boyd et al. (2012), who estimate the TME variance from all sources on math and reading exams in New York (i.e., not just TME derived from the testing instrument itself). Their estimates for math suggest that approximately 80 percent of the variance in student gainscores is generated by TME. In the present application, we maintain the shape of the TME-variance distribution shown in This is because the expected value of the correlation with random but incorrect weights is the same as in the unweighted case. The efficiency loss from improper weighting can be seen by the correlation variance. 23
13
Figure 1 and simply shift the curve up to allow for an overall increase in the total TME variance. This approach is broadly consistent with the findings from Boyd et al. (see their Figures 6 and 7) and appealing if one believes that the shape in Figure 1 is driven by measurement error derived from the testing instrument itself.24 Table 3 replicates the correlations from Table 1 with the new data generating process (we omit the quintile movements for brevity). Overall, the correlations are smaller in Table 3 than in Table 1 because a larger fraction of the variance in student scores is due to TME. However, the gains from weighting are generally similar to what we see in Table 1 (although somewhat larger in the scenarios where the student-teacher ratio is high).25 The reason for the similar weighting effects is that the gains from weighting depend on the information conveyed about the relative precision with which student scores are estimated. Although the total variance in TME is larger in Table 3, the weights still contain the same relative information. Finally, we also briefly note a third issue that we do not address with the simulated data: the possibility for non-random student and/or teacher sorting. Addressing student and teacher sorting in the simulations is challenging because we know so little about the sorting dynamics in schools (for a discussion of some possibilities, see Rothstein, 2009). For this reason, we address the studentteacher sorting issue when we turn to our analysis of real data in Sections V and VI.
To summarize our simulation findings, they show that TME adjustments to VAMs have the potential to meaningfully improve the accuracy with which teacher effects are estimated. The
24
Clearly, the design of the testing instrument produces variability in the accuracy with which student scores are estimated across the ability distribution. However, it is less obvious that TME variance deriving from other sources varies by underlying student ability (e.g., a dog barking in the parking lot, performance variability due to illness, etc.), which supports our approach of vertically shifting the curve in Figure 1. 25 Given the lower baseline values, the similar absolute improvements in the correlations presented in Table 3 correspond to larger improvements in percentage terms than in Table 1.
14
efficiency improvements in the simulations are achieved within a simple and well-controlled data environment; still, they raise the possibility for efficiency gains more generally, even when we deviate from the optimal estimation conditions. We now turn to the question of whether these findings can be replicated with real data, and if so, to what extent inference from VAMs can be improved using typical administrative micro data and readily-available TME metrics. IV.
Missouri Data For the real data portion of our analysis we use statewide administrative panel data from
Missouri. The data allow us to link students and teachers at the classroom level and include standard student information. We model math scores for grade-5 students in 2008-2009 and 2009-2010. Our analysis is limited to students for whom gainscores can be constructed, and to teachers who do not change schools and teach more than 10 students in each year. Table 4 shows basic summary information for the data.26 Publisher-provided CSEMs are available for most large-scale standardized tests nationwide. We obtained the CSEM data from the publisher of the Missouri test (the Missouri Assessment Program – MAP). The extent to which inference from VAMs can be improved by incorporating CSEM information is an empirical one, and to the best of our knowledge it has not been addressed in prior research. V.
Real-Data Analysis and Results Analysis We use the Missouri data to estimate lagged-score VAMs, as described in equation (1), and
analogous gainscore VAMs. Our VAMs include controls for student race, gender, free/reducedprice lunch status, language status, mobility status, and whether the student has an individualized As with other similar statewide datasets, we cannot link all students in Missouri to their teachers. But for the students we can link to teachers, approximately 84 percent of all students, we have a high degree of confidence that the linkages are correct. Details on the process that we use to create the student-teacher links are available upon request. 26
15
education plan (i.e., special education status). We estimate single-year VAMs for reasons that will become clear shortly, which rules out the inclusion of school- and classroom-level aggregates in the models because their effects are not separately identified from the teacher effects.27 Shrinkage estimators are commonly used to minimize the role of estimation error in teacher coefficients from VAMs (Chetty et al., 2011; Goldhaber and Hansen, 2010; Isenberg and Hock, 2010; Kane et al., 2008; Lockwood et al., 2002; Value-Added Research Center, 2010). Shrunken estimates are constructed as the weighted average of a prior, typically the average teacher effect, and each teacher’s estimated effect based on available data. Teachers for whom more-precise information is available have more weight applied to the data; teachers for whom less-precise information is available have more weight applied to the prior. A key benefit of shrinkage in the teacher context is that it addresses variability in the data in within-teacher sample sizes. Albeit indirectly, shrinkage estimators may also partly account for TME in the sense that teachers who teach students with noisier scores will have more weight applied to the prior.28 In the analysis that follows we consider both shrunken and unshrunken VAM estimates. For the gainscore VAM the TME adjustment is the same as in the simulations – we weight the regression by the inverse of the gainscore CSEM. The proper TME adjustment in the laggedscore VAM is more complicated because some of the TME is on the right-hand side of the equation. Lockwood and McCaffrey (2012) suggest using a latent-regression framework to incorporate lagged-score TME into VAMs. Fuller (1987) also develops an approach that could potentially be used to properly model the lagged-score TME; however, a concern is that the In results omitted for brevity we also estimate two-step models that allow us to bring in these school and classroomlevel controls; our findings from the two-step models are very similar to what we report below. 28 This depends on how shrinkage is performed – shrinkage estimators are sometimes constructed in ways that do not account for TME at all. For example, in some applications the only variability in the shrinkage factors across teachers comes from differences in within-teacher sample sizes. In such cases there is the implicit assumption that all student scores are equally reliable. In the analysis that follows we shrink the estimated teacher effects using a formula that allows for variation across teachers in TME to influence the shrinkage factors (because this is the only interesting case in our application). 27
16
estimates would be highly sensitive to outliers (Fuller, 1987), and the approach may perform poorly with student achievement data for this reason.29 In the few instances where TME is explicitly acknowledged and modeled in lagged-score VAMs in policy application, modelers have made the assumption that the TME variance in the lagged score is constant across the test-score distribution (Isenberg and Hock, 2010; Value-Added Research Center, 2010). This greatly simplifies the problem and a straightforward errors-in-variables correction can be applied (Fuller, 1987). However, Figure 1 shows that the TME variance is clearly not constant across the score distribution. The consequences of this assumption being violated are not obvious ex ante. In the absence of a clearly preferred modeling approach for the lagged-score VAM we consider four different TME adjustments. First, we ignore the TME variance in the current-year score and model the lagged-score TME as being constant across the distribution. This approach is conceptually unappealing given the U-shaped curve in Figure 1, but it is of interest because it is the only approach of which we are aware in present application. Second, we maintain the incorrect assumption of constant error variance in the lagged score, and model it as such, but also weight the entire model by the CSEM of the current-year test score (in levels). Third, we ignore the fact that the TME in the lagged score enters on the right-hand-side of the equation entirely and simply weight the lagged-score VAM by the gainscore CSEM – that is, we treat the TME in the lagged-score VAM the same way that we treat it in the gainscore VAM. Fourth, we apply modified lagged-score CSEM weights of the following form: In addition to Fuller (1987) and Lockwood and McCaffrey (2012), other useful references include Brown (1982), Carroll and Gallo (1982) and Zamar (1989). The costs associated with using a complex TME correction may outweigh the benefits for VAMs, particularly if one expects the gains in terms of bias reduction owing to the proper correction to be small. In addition to the primary concern that outlying data can result in poor performance (Fuller, 1987; Brown, 1982), some suggested approaches produce estimates that are asymptotically biased (Zamar, 1989). Furthermore, much of the work in this area has been performed using Monte Carlo methods, and in actual application it may not be straightforward to determine whether the TME correction is successful. An alternative strategy involves using instrumental variables (IV) to address the lagged-score TME, with test scores in other years and/or subjects serving as instruments. But an IV solution requires assumptions that may not hold (Lockwood and McCaffrey, 2012), more data, and has the potential for considerable efficiency loss. 29
17
CSEM ( AGit ) CSEM (it )2 ˆ12 * CSEM (it 1 )2
(6)
Equation (6) is analogous to equation (3) except that the lagged-score TME variance is downweighted by ˆ12 . ˆ1 is the coefficient on the lagged-score term from the general VAM, estimated by unweighted OLS. While none of the TME adjustments that we consider for the laggedscore VAM are technically correct, the case can be made that no preferable alternative is presently available. In the absence of a robust strategy for properly modeling TME in the lagged-score VAM, we ask whether available imperfect solutions improve inference from the model. Unlike in the simulations, we do not know the true values of the teacher effects for this portion of our analysis. This makes it difficult to quantify the benefits of the TME adjustments because we cannot compare the estimated teacher effects to the true parameter values. Instead, we evaluate the benefits of the TME adjustments in terms of their influence on the year-to-year stability of the teacher-effect estimates. Although teacher performance is not perfectly stable over time, there is clearly a stable component.30 We hypothesize that TME-adjusted VAMs will produce estimates of teacher effects that are more stable over time relative to unadjusted models due to the efficiency gains. That is, the TME adjustments will lower the contribution of noisily estimated student scores in favor of more-precisely estimated scores, which will clarify the stable components of the estimates. To facilitate our stability analysis we estimate teacher effects separately for the 2008-2009 and 2009-2010 school years. We compare the year-to-year stability in teachers’ estimated effects from the VAMs with different TME adjustments. As noted in the previous section, we restrict our
This finding has been replicated by numerous studies. Examples include Aaronson et al. (2007), Boyd et al. (2011) and Goldhaber and Hansen (2010). 30
18
analysis to teachers who teach at least 10 students and are employed at the same school for both years.31 A potential limitation of our approach is that the “stable” components of the teacher effects may include bias. For example, if a teacher is systematically assigned students who are poised for high growth in consecutive years, the weighting will clarify this signal in addition to the signal of teaching effectiveness. We examine the bias issue directly in the next section and find no evidence to suggest that the stability gains that we observe from CSEM weighting are driven by persistent sorting bias. Results Tables 5 and 6 show our results for the gainscore and lagged-score models, respectively, using unshrunken VAM estimates. First, Table 5 shows year-to-year correlations in the teachereffect estimates, and the stability in teachers’ quintile assignments over time, for weighted and unweighted gainscore models. Consistent with the hypothesis that the weighting improves inference, the estimated teacher effects are more stable over time in the weighted models. Specifically, the yearto-year correlation in the estimates is higher, and there are marginally fewer teachers who experience major quintile-ranking changes.32 Table 6 reports findings for the lagged-score models. When we apply the simple gainscorebased weights our findings for the lagged score models are very similar to what we report for the gainscore model. The CSEM weighting results in modest improvements in the year-to-year In unreported results we also estimate the models using the subsample of teachers who have more than 3 years of teaching experience because new teachers are likely to have less stable year-to-year effects. Our results from this supplementary analysis are similar to what we report in the text. 32 Unlike in the simulations, we are unable to compute a statistic analogous to the standard deviation of the correlation using the real data (we only observe one “draw”). Such a statistic would be helpful given that we do not know the degree of imprecision in the CSEM weights. However, the correlations for the weighted estimates in Tables 5 and 6 are clearly higher than for the unweighted estimates, and the differences are statistically significant (see Steiger (1980) for information about the test we use to determine statistical significance between the correlations). These findings are consistent with the weighting conferring some benefits. For example, in the simulation analysis in Table 2 we find that whenever the average correlation is higher in the weighted models, the correlation variance is lower. 31
19
correlations in the teacher effects, and in the stability of teachers’ quintile assignments over time. This is a notable result – despite the fact that the weighting procedure is technically incorrect in the lagged-score models, the adjustment produces results very similar to what we find in the gainscore model where the weighting procedure is technically correct. In contrast, the models do not perform well when we make the errors-in-variables correction under the assumption that the TME variance in the lagged score is constant.33 The year-to-year stability in the teacher effects is actually lower in the model that makes this correction without any corresponding adjustment for current-score TME (column 2), and the year-to-year stability is only marginally higher than in the unweighted model when we add the TME weights based on the current-year CSEM (column 3). Hence, our results suggest that it is costly to assume that the TME variance in the lagged score is constant.34 Tables 5 and 6 show that incorporating the CSEM information can improve inference from VAMs, but it is not obvious how to interpret our findings. How much better do the TME-adjusted models in Tables 5 and 6 really perform? To quantify the benefits of the CSEM adjustments we benchmark the gains against the benefits associated with changing a well-understood feature of the data: within-teacher sample sizes. Specifically, we equate the gains in model performance that come from the CSEM adjustments with the gains that would come from increasing the number of student observations per teacher in the data. We perform the benchmarking procedure using the year-to-year correlations in the estimates. Note that the year-to-year correlations will get smaller as within-teacher sample sizes decline independent of the TME issue. With this in mind we begin with the correlations from the CSEM-adjusted VAMs. We randomly drop a single student from each teacher’s classroom in each For the models where we assume that the TME variance in the lagged score is constant and model it as such (columns 2 and 3), we use the unconditional standard error of measurement (SEM) of the testing instrument to estimate the TME variance. 34 Assuming that the role of the TME correction in terms of reducing bias is small. We investigate this assumption directly, and provide additional discussion, in Section VI. 33
20
year, re-estimate the adjusted models, and re-calculate the correlations. Then we drop a second student from each classroom at random and repeat our analysis again, and so on. For each CSEMadjusted VAM, there comes a point where the year-to-year stability in the teacher-effect estimates from the restricted sample aligns with the year-to-year stability in the estimates from the unweighted model based on the full sample. When this happens, we identify the within-teacher restricted sample size and call it R. We say that the CSEM weights offer benefits in model performance equivalent to increasing within-teacher sample sizes in the unweighted models by {(F-R)/R} percent, where F is the average number of students per teacher in the full sample (F ≈ 21, see Table 4). Put differently, if we were to begin with R students per teacher, we could obtain similar improvements in model performance by either (1) weighting the model using the CSEMs or (2) increasing the average within-teacher sample size from R to F without weighting. Our results from the benchmarking exercise are reported in Table 7. In our preferred models where we use the gainscore-based CSEM weights (columns 1, 4 and 5), the benefits from the TME adjustments are equivalent to increasing average within-teacher sample sizes by 2-3 students. This finding is consistent in both the lagged-score and gainscore VAMs. Noting that R ≈ 18-19, the benefits associated with the weighting correspond to increasing the average within-teacher sample size by approximately 11-17 percent. In Table 8 we evaluate shrunken VAM estimates from the gainscore and simple-weighted lagged-score models (columns 1, 4 and 5 in Table 7). We shrink the estimated effect for teacher j in year t by multiplying it by the reliability ratio rjt
ˆ2 , where ˆ2t is an estimate of the 2 2 ˆ ˆ t
t
jt
variance of true teaching effectiveness (estimated as in Aaronson et al., 2007) and ˆ2jt is an estimate of the variance of the effect for teacher j, which we estimate by the square of teacher j’s standard error. It should be no surprise that the baseline year-to-year stability in the shrunken estimates in 21
Table 8 is higher than in Table 7.35 But even for the shrunken estimates we identify noticeable benefits from directly augmenting the VAMs to incorporate CSEM information. We conclude that the shrinkage procedure is a broad-brush approach to dealing with the inherent imprecision in estimated teacher effects, and can be improved upon by applying direct measures of TME into VAMs.36 Finally, for comparative purposes we perform a similar benchmarking procedure to what we show in Tables 7 and 8 with the simulated data. Using the 20-students-per-teacher scenario from Table 1 as our baseline, we find that the improvement in model performance associated with the TME weighting is equivalent to increasing within-teacher sample sizes by 25 to 33 percent. While Tables 7 and 8 show that inference from VAMs can be improved by the CSEM weighting, a discrepancy remains between the gains from the TME adjustments in the simulations and real-data models. One explanation is that the weighting metrics are less accurate with the real data, which will adversely affect the gains from weighting (see Table 2). VI.
Bias Thus far we have worked under the maintained assumption that student-teacher sorting
along unobserved dimensions is negligible. Put differently, we focus on the efficiency implications of incorporating TME into VAMs in situations where the researcher expects a minimal role for bias from sorting along unobserved dimensions.37 Our shift in focus away from the issue of
Although the shrunken estimates are more stable, there is no consensus in the literature as to whether shrunken estimates are preferred. Shrunken estimates improve stability by introducing systematic bias (toward the prior) in the teacher effects. 36 We also consider analogous random effects models, which produce true empirical Bayes’ (EB) estimates. Our results are nearly identical. In the gainscore model the correlations between teachers’ random-effect estimates from the weighted and unweighted models are 0.455 and 0.476, respectively. The comparable correlations from Table 8 are 0.457 and 0.477. For the lagged-score models (using either set of weights), the correlations from the random effects models are 0.466 and 0.487 for the weighted and unweighted estimates, respectively. The comparable estimates in Table 8 are 0.467 and 0.488. 37 There is a large and robust research literature in economics and statistics that considers general measurement error issues with a focus on recovering unbiased and/or consistent parameter estimates, or their bounds (notable examples 35
22
unbiasedness, and toward efficiency, is supported by recent research. For example, Chetty et al. (2011) estimate a VAM that includes standard conditioning variables and find that the bias in the estimated teacher effects is just 3.4 percent. Other recent studies also suggest that the scope for bias in teacher-effect estimates from standard VAMs is limited (Goldhaber and Chaplin, 2012; Kane and Staiger, 2008; Kinsler, forthcoming; Koedel and Betts, 2011).38 Nonetheless, the critical reader may remain concerned about bias. Consider, for example, the model in column (2) of Table 7. We show that the year-to-year stability in the estimated teacher effects declines when we apply the TME correction. In the previous section we present these findings as evidence that this approach underperforms relative to available alternatives. But our findings are also consistent with the presence of persistent student-teacher sorting across years, which may generate persistent bias.39 It cannot be ruled out that the lower year-to-year correlation in the estimated teacher effects after the TME correction in column (2) reflects bias reduction, not lost efficiency. If this were the case, the decreased stability of the estimates would be viewed favorably. More generally, our weighting procedure in all of the models clarifies the signal components in the underlying “teacher effects” by reducing the impact of testing-instrument-related noise. If the underlying effects are biased, the bias components are also clarified through weighting. We follow a procedure similar to the one outlined by Clotfelter et al. (2006) to examine the bias issue directly. Specifically, we identify a subset of schools in Missouri where student sorting into classrooms, within grades, is indistinguishable from what sorting would look like under random assignment. We perform a modified version of the Clotfelter et al. (2006) tests where we include include Fuller, 1987; Horowitz and Manski, 1995; Pischke, 1995; Stefanski, 1985). There is also a literature on efficiency considerations (see, for example, Fuller, 1987; Stefanski and Carroll, 1987). The efficiency gains from incorporating measurement error into VAMs are likely to be of greater importance than in typical evaluations because within-teacher sample sizes are small (e.g., see Schochet and Chiang, forthcoming). 38 Rothstein (2010) is a notable exception, and in fact, his work prompted several of the studies cited in the main text. 39 Koedel and Betts (2011) provide direct evidence on the year-to-year persistence of student sorting to teachers based on observed test scores. They find that student sorting is not highly persistent within teachers over time.
23
schools in the “random assignment” subsample if they pass separate tests based on lagged, continuous math and reading exam scores in all grades where lagged scores are available (typically grades 4 and 5 for Missouri elementary schools). Like in the Clotfelter et al. (2006) study, only schools with more than one classroom in at least one grade are included.40 The procedure identifies schools where there is no evidence of sorting along observable dimensions, but we expect less sorting along unobservable dimensions at these schools as well (Clotfelter et al., 2006; also see Altonji et al., 2005). Any persistent sorting bias in the teacher effects from our main analysis will be lessened when we estimate our models using the “random assignment” subsample of schools. In Tables 9 and 10 we replicate our analysis from Table 7 using the random-assignment subsample. First, Table 9 reports estimates using the same VAMs as in the previous section. The benefit of holding the models constant is that our findings are directly comparable to what we show in Table 7. However, a drawback is that the test for random assignment is a within-schools test and therefore does not speak to between-school sorting, which may also be important. Nonetheless, whatever persistent sorting bias is present in our main analysis will be smaller (weakly) in the random-assignment subsample owing to the diminished within-school sorting. If persistent sorting bias were influencing our findings in Table 7, we would expect the TME adjustments in columns (1), (4) and (5) of Table 9 to produce lower year-to-year correlations in the teacher effect estimates. This is because any contributions of persistent sorting bias to the stability measures in Table 7 would be diminished in Table 9. Alternatively, the correlations reported in columns (2) and (3) in Table 9 would increase because persistent sorting bias will be reduced by the Clotfelter et al. (2006) procedure, which means that the role of the lagged-score TME correction in 40
The procedure identifies 49.9 percent of the schools in our original sample as passing; the analogous number in the Clotfelter et al. study is 44.9 percent. In unreported results we also obtain similar findings to what we report below if we perform the Clotfelter et al. test as implemented in North Carolina. However, more schools pass the test in Missouri than in North Carolina (74.8 percent in our data). One reason is that schools are smaller and more-homogeneous in Missouri so fewer dimensions of the test apply in many cases.
24
in terms of reducing persistent bias should be smaller. However, neither of these patterns emerge in Table 9. In fact, the only notable difference between our findings in Tables 7 and 9 is that the baseline correlations in the weighted and unweighted models are slightly smaller in Table 9, but this difference can be explained entirely by the fact that the average class size in the random-assignment subsample is one student smaller (see table notes). Next, in Table 10 we report estimates from models that include school fixed effects (and are otherwise the same as in Equation 1). As mentioned previously, the Clotfelter et al. (2006) procedure evaluates within-school student sorting. The motivation for moving to the school-fixed-effects specification is that it compares teachers to other teachers in the same school. Therefore, it is even less likely that our analysis will be confounded by persistent sorting bias in Table 10. The shift in the modeling structure in Table 10 creates more inherent variability in the estimates. Correspondingly, the correlations in the year-to-year teacher effects are smaller overall, but the internal comparisons remain valid holding the modeling structure fixed.41 Interestingly, while the correction in column (2) continues to show no improvement in terms of stability in Table 10, the estimates from the models that involve weighting show even larger stability improvements. The explanation lies in the switch from the between- to within-schools VAM structure. The structural change shrinks teachers’ comparison groups and in doing so, it increases the efficiency gains from TME-weighting. Unlike in the between-schools model, weighting in the within-schools model meaningfully improves the precision with which each teacher’s comparison-group effect is estimated
The teacher effects within schools are centered on zero. The lower overall stability in the year-to-year estimates is driven in part by the smaller comparison groups for teachers (other teachers in the same school, rather than all teachers), which introduces more year-to-year performance variability in the relative effects. Other studies have documented the decline in stability moving from models that do and do not include school fixed effects (Aaronson et al., 2007; Koedel and Betts, 2007). 41
25
in addition to affecting the teacher’s own estimate.
42
Correspondingly, the efficiency gains from
weighting translate into even larger benefits in terms of inference from the VAM. Together, Tables 9 and 10 provide no evidence to suggest that our primary findings are driven by sorting bias. This result is consistent with a growing research literature showing that sorting bias in teacher-effect estimates from VAMs is small. VII.
Conclusion
We examine the efficiency gains associated with incorporating information about test measurement error into value-added models. We use simulations to establish the potential for efficiency improvements under ideal estimation conditions, then show that models based on real data from Missouri perform better when we make simple TME adjustments. The benefits associated with incorporating the publisher-provided CSEMs into VAMs are equivalent to what would be observed if we could increase within-teacher sample sizes by 11-17 percent. This is a notable result because CSEM data can be incorporated into VAMs at near-zero cost.43 The benefits from incorporating TME information into our simulations are larger than the benefits that we observe with real data, which suggests that it may be feasible to produce TME metrics that are more accurate than the metrics currently provided by most test publishers. We also note that the development of alternative TME metrics, which incorporate measurement error from sources beyond the testing-instrument itself (Thorndike, 1951; Boyd et al., 2012), could be used in place of the CSEM-based TME metrics that we consider here. 42
Consider a hypothetical school k with three teachers. For each teacher j in school k, we estimate the teacher effect as
(ˆkj ˆk ) in the school-fixed-effects model, where ˆk is estimated using data from just the three teachers. One might worry that the weighting procedure will give teachers an incentive to change teaching practices so as to focus on students who score near the center of the distribution, which may be costly. However, note that this incentive is already in place because the tests are not designed to measure learning as accurately in the tails, which means that the gains from teacher effort devoted toward helping students in the tails are more likely to be obfuscated by noise. It is important to recognize that the CSEM weights only adjust for TME variance, a statistical property of the exam data. The weights do not add any additional incentives for teachers to teach to particular types of students beyond those already in place given the quality of information produced by the exam. 43
26
We conclude by returning to the issue of bias versus efficiency. There is a growing consensus in the research literature that the bias in teacher-effect estimates from VAMs is small (Chetty, 2011; Goldhaber and Chaplin, 2012; Kane and Staiger, 2008; Kinsler, forthcoming; Koedel and Betts, 2011). Taking this general result as a point of departure, we focus on the efficiency gains that come with incorporating TME information into the models. With the Missouri data this appears to have been an effective strategy per our analysis in Section VI, which shows that the increased stability in teachers’ value-added estimates is not driven by persistent bias. In other locales, tests along the lines of what is proposed by Chetty et al. (2011) can help to shed light on the bias issue prior to making any TME corrections. Ex post analyses similar to what we show in Section VI, based on work by Clotfelter et al. (2006), may also be informative. These types of investigations would be advisable under general circumstances, and given what we know from available studies it is our expectation that in most cases they will reveal a limited scope for sorting bias. When bias from student sorting is determined to be small, our weighting approach to incorporating TME into VAMs represents a simple, cheap and effective way to obtain more accurate estimates of teacher value-added.44
44
Of course, there may be situations where VAMs produce estimated teacher effects with larger bias components. The bias may or may not be affected by TME in the lagged score. In cases where the lagged-score TME is important for bias reduction, a simple weighting-based approach to correcting for TME would be undesirable and alternative options should be considered (e.g., see Lockwood and McCaffrey, 2012).
27
References Aaronson, Daniel, Lisa Barrow and William Sander. 2007. Teachers and Student Achievement in the Chicago Public High Schools. Journal of Labor Economics 25(1), 95-135. Altonji, Joseph G., Todd E. Elder and Chistopher R. Taber. 2005. Selection on Observed and Unobserved Variables: Assessing the Effectiveness of Catholic Schools. Journal of Political Economy 113(1): 151-184. Andrabi, Tahir, Jishnu Das, Asim Ijaz Khwaja and Tristan Zajonc. 2011. Do Value-Added Estimates Add Value? Accounting for Learning Dynamics. American Economic Journal: Applied Economics 3(3), 2954. Ballou, Dale. 2009. Test Scaling and Value-Added Measurement. Education Finance and Policy 4(4), 351-383. Betebenner, Damien. 2008. A Primer on Student Growth Percentiles. Policy Report. National Center for the Improvement of Educational Assessment. Boyd, Donald, Hamilton Lankford, Susanna Loeb, and James Wyckoff .2011. Teacher Layoffs: An Empirical Illustration of Seniority v. Measures of Effectiveness. Education Finance and Policy 6(3), 43954. --. 2012. Measuring Test Measurement Error: A General Approach. Unpublished Manuscript. Boyd, Donald, Pam Grossman, Hamilton Lankford, Susanna Loeb and Jim Wyckoff. 2008. Measuring Effect Sizes: The Effect of Measurement Error. CALDER Working Paper No. 19. Briggs, Derek and Ben Domingue. 2011. Due Diligence and the Evaluation of Teachers. National Education Policy Center Report. Brown, Michael L. 1982. Robust Line Estimation with Errors in Both Variables. Journal of the American Statistical Association 77, 71-9. Carroll, Raymond J. and P.P. Gallo. 1982. Some Aspects of Robustness in the Functional Errors-inVariables Model. Communications in Statistics, Series A 11, 2573-2585. Chetty, Raj, John N. Friedman and Jonah E. Rockoff. 2011. The Long-Term Impacts of Teachers: Teacher Value-Added and Student Outcomes in Adulthood. National Bureau of Economic Research Working Paper No. 17699. Clotfelter, Charles T., Helen F. Ladd and Jacob L. Vidgor. 2006. Teacher-Student Matching and the Assessment of Teacher Effectiveness. Journal of Human Resources 41(4): 778-820. Corcoran, Sean P. 2010. Can Teachers be Evaluated by their Students’ Test Scores? Should They Be? The Use of Value-Added Measures of Teacher Effectiveness in Policy and Practice. Report for the Annenberg Institute for School Reform, Education Policy for Action Series. 28
Fuller, Wayne A. 1987. Measurement Error Models. John Wiley & Sons, Inc. Goldhaber, Dan and Duncan Chaplin. 2011. Assessing the Rothstein Falsification Test: Does It Really Show Teacher Value-Added Models Are Biased? CEDR Working Paper 2011-5. Goldhaber, Dan and Michael Hansen. 2010. Using Performance on the Job to Inform Teacher Tenure Decisions. American Economic Review (P&P) 100(2), 250-255. Hambleton, Ronald K., H. Swaminathan and H. Jane Rogers. 1991. Fundamentals of Item Response Theory. Newbury Park, CA: Sage Publications. Hanushek, Eric A. 2009. Teacher Deselection, in Creating a New Teaching Profession eds. Dan Goldhaber and Jane Hannaway. Urban Institute, Washington, DC. --. 2011. The Economic Value of Higher Teacher Quality. Economics of Education Review 30(3), 466-479. Hanushek, Eric A. and Steven G. Rivkin. 2010. Generalizations about Using Value-Added Measures of Teacher Quality. American Economic Review (P&P) 100(2), 267-271. Harris, Douglas N. 2011. Value-Added Measures in Education: What Every Educator Needs to Know. Harvard Education Press: Cambridge, MA. Harris, Douglas N., Tim R. Sass and Anastasia Semykina. 2011. Value-Added Models and the Measurement of Teacher Productivity. Unpublished Manuscript, Florida State University. Hill, Heather. 2009. Evaluating Value-Added Models: A Validity Argument Approach. Journal of Policy Analysis and Management 28(4), 700-708. Horowitz, Joel L. and Manski, Charles F., 1995. Identification and Robustness with Contaminated and Corrupted Data. Econometrica 63(2): 281-302. Isenberg, Eric and Heinrich Hock. 2010. Measuring School and Teacher Value Added for IMPACT and TEAM in DC Public Schools: Final Report. Unpublished report, Mathematica Policy Research. Kane, Thomas J. and Douglas O. Staiger. 2002. The Promise and Pitfalls of Using Imprecise School Accountability Measures. Journal of Economic Perspectives 16(4), 91-114. --. 2008. Estimating Teacher Impacts on Student Achievement: An Experimental Evaluation. National Bureau of Economic Research Working Paper No. 14607. Kane, Thomas J., Jonah E. Rockoff and Douglas O. Staiger. 2008. What Does Certification Tell us About Teacher Effectiveness? Evidence from New York City. Economics of Education Review 27(6), 615-631. Kinsler, Joshua. Forthcoming. Assessing Rothstein's Critique of Teacher Value-Added Models. Quantitative Economics. 29
Koedel, Cory and Julian R. Betts. 2011. Does Student Sorting Invalidate Value-Added Models of Teacher Effectiveness? An Extended Analysis of the Rothstein Critique. Education Finance and Policy 6(1), 18-42. --. 2007. Re-Examining the Role of Teacher Quality in the Educational Production Function. University of Missouri Department of Economics Working Paper No. 07-07. Lockwood, J.R., Thomas A. Louis and Daniel F. McCaffrey. 2002. Uncertainty in Rank Estimation: Implications for Value-Added Modeling Accountability Systems. Journal of Educational and Behavioral Statistics 27(3), 255-270. Lockwood, J.R. and Daniel F. McCaffrey. 2012. Reducing Bias in Observational Analyses of Education Data by Accounting for Test Measurement Error. Unpublished manuscript. RAND Corporation. Lord, Frederic M. 1980. Applications of Item Response Theory to Practical Testing Problems. Hillsdale, NJ: Erlbaum. --. 1984. Standard Error of Measurement at Different Ability Levels. Journal of Educational Measurement 21(3), 239-243. McCaffrey, Daniel F., J.R. Lockwood, Daniel M. Koretz and Laura S. Hamilton. 2003. Evaluating Value-Added Models for Teacher Accountability. Santa Monica, CA: The RAND Corporation. Neal, Derek and Gadi Barlevy (forthcoming). Pay for Percentile. American Economic Review. Pischke, Jorn-Steffen, 1995. Measurement Error and Earnings Dynamics: Some Estimates from the PSID Validation Study. Journal of Business & Economic Statistics13(3): 305-14. Podgursky, Michael J. and Mathew G. Springer. 2007. Teacher Performance Pay: A Review. Journal of Policy Analysis and Management 26(4), 909-949. Rockoff, Jonah. 2004. The Impact of Individual Teachers on Student Achievement: Evidence from Panel Data. American Economic Review (P&P) 94(2), 247-252 Rothstein, Jesse. 2009. Student Sorting and Bias in Value-Added Estimation: Selection on Observables and Unobservables. Education Finance and Policy 4(4), 537-571. --. 2010. Teacher Quality in Educational Production: Tracking, Decay, and Student Achievement. Quarterly Journal of Economics 125(1), 175-214. Schochet, Peter Z. and Harnley S. Chiang. Forthcoming. What are Error Rates for Classifying Teacher and School Performance Using Value-Added Models? Journal of Educational and Behavioral Statistics.
30
Staiger, Douglas O. and Jonah E. Rockoff. 2010. Searching for Effective Teachers with Imperfect Information. Journal of Economic Perspectives 24(3), 97-118. Steiger, James H. 1980. Tests for Comparing Elements of a Correlation Matrix. Psychological Bulletin 87(2), 245-251. Stefanski, Leonard A. 1985. The Effects of Measurement Error on Parameter Estimation. Biometrika 72(3), 583-592. Stefanski, Leonard A. and Raymond J. Carroll. 1987. Conditional Scores and Optimal Scores for Generalized Linear Measurement-Error Models. Biometrika 74(4), 703-716. The New Teacher Project. 2009. The Widget Effect: Our National Failure to Acknowledge and Act on Differences in Teacher Effectiveness. TNTP Policy Report. Thompson, Tony D. 2008. Growth, Precision, and CAT: An Examination of Gain Score Conditional SEM. Unpublished Research Report. Pearson Publishing. Thorndike, Robert L. 1951. Reliability, in Educational Measurement edited by Everett F. Lindquist. Washington, DC: American Council on Education. Todd, Petra E. and Kenneth I. Wolpin. 2003. On the Specification and Estimation of the Production Function for Cognitive Achievement. The Economic Journal 113, F3-F33 Value-Added Research Center. 2010. NYC Teacher Data Initiative: Technical Report on the NYC Value-Added Model. Unpublished report, Wisconsin Center for Education Research, University of Wisconsin-Madison. Zamar, Ruben H. 1989. Robust Estimation in the Errors-in-Variables Model. Biometrica 76(1), 149160.
31
60 50 40 30 20 10
Conditional Standard Error of Measurement
70
80
Figure 1. Conditional Standard Errors of Measurement for Student Level Scores from the Missouri Data. Grade-5 Students, 2009.
500
600
700
Achievement Level
32
800
Table 1. Simulation Results. Random Assignment of Students to Teachers. Class Size Unweighted VAM Weighted VAM Correlation between teacher-effect estimates and actual values 5 0.42 10 0.54 20 0.68 40 0.80 60 0.86 80 0.90 100 0.93
0.50 0.63 0.76 0.86 0.91 0.93 0.95
Share of teachers without a major quintile-assignment error 5 0.69 10 0.74 20 0.79 40 0.87 60 0.91 80 0.94 100 0.97
0.71 0.77 0.84 0.92 0.95 0.97 0.99
Notes: The simulations are performed 1,000 times. Averages across simulations are reported in the table. A “major” error in quintile assignment occurs when a teacher’s VAM estimate suggests that she belongs in a quintile that is more than one quintile away from her actual placement(e.g., from below the 20th to above the 40th percentile).
33
Table 2. Correlations between Teacher Effect Estimates and Actual Values from Weighted Models with Imprecise Weights. Random Assignment of Students to Teachers. Class Size Average Correlation Correlation Standard Dev 20
Unweighted
0.68
0.052
20 20 20 20 20
1.00 0.75 0.50 0.25 0.00
0.76 0.74 0.71 0.69 0.67
0.041 0.047 0.048 0.051 0.055
Notes: indicates the degree of imprecision in the weights. Higher values indicate more precision, with =1 representing the case with precise weights shown in Table 1.The simulations are performed 1,000 times. Average correlations across simulations are reported along with the variance in the correlation estimates.
Table 3. Correlations between Teacher Effect Estimates and Actual Values Using Larger TME Variance Share (80 percent). Random Assignment of Students to Teachers. Class Size Unweighted VAM Weighted VAM 5 10 20 40 60 80 100
0.37 0.48 0.62 0.76 0.83 0.88 0.91
0.45 0.57 0.71 0.83 0.88 0.92 0.94
Notes: The simulations are performed 1,000 times. Averages across simulations are reported in the table.
34
Table 4. Data Details. 2008-2009 35,027 1,657 662
2009-2010 35,394 1,657 662
Average class size
21.1
21.4
Sample means for students Minority share Female share Free/reduced-price lunch share Limited English proficiency share Share of mobile students Share of students with individualized education program
0.17 0.49 0.42 0.02 0.01 0.13
0.17 0.49 0.44 0.02 0.01 0.13
Number of students Number of teachers Number of schools
Notes: The data include all grade-5 students in Missouri with current and lagged MAP scores who can be linked to a valid classroom teacher. Teachers are required to have taught 10-or-more students in the same school for each year of the data panel.
35
Table 5. Year-to-Year Stability of Estimated Teacher Effects from Missouri Gainscore Models. Unweighted CSEM-Weighted Year-to-year correlation between teacher0.454 0.475 effect estimates Share of teachers without a major quintileassignment change from year-to-year
0.687
0.694
Note: A “major” change in quintile assignment occurs when a teacher moves more than one quintile in the teacher rankings from year to year (e.g., from below the 20th to above the 40th percentile).
36
Table 6. Year-to-Year Stability of Estimated Teacher Effects from Missouri Lagged-Score Models. Correct for Correct for Constant Constant LaggedLagged-Score TME Score TME Variance, Weight by Unweighted Variance, Current-Score CSEM Unweighted Year-to-year correlation between 0.466 0.448 0.471 teacher-effect estimates Share of teachers without a major quintile-assignment change from yearto-year
0.693
0.684
0.687
Weight by Gainscore CSEM
Weight by Modified Gainscore CSEM
0.487
0.487
0.701
0.700
Notes: A “major” quintile assignment change occurs when a teacher moves more than one quintile in the teacher rankings from year to year (e.g., from below the 20th to above the 40th percentile). The four adjustments to the VAM are described in more detail in the text (see the end of Section V).
37
Table 7. Benchmarking Improvements in Model Performance from the CSEM Adjustments Using Changes to Within-Teacher Sample Sizes. Gainscore Model
Lagged-Score Models Correct for Constant Lagged-Score TME Weight by Variance, Weight by Gainscore Current-Score CSEM CSEM
Weight by Gainscore CSEM
Correct for Constant Lagged-Score TME Variance, Unweighted
Unadjusted VAM “target” correlation (from Tables 3 and 4)
0.454
0.466
0.466
0.466
0.466
CSEM-adjusted VAM correlation, full sample (from Tables 3 and 4)
0.475
0.448
0.471
0.487
0.487
0.469 0.461 0.451 0.442
N/A N/A N/A N/A
0.464 0.456 0.446 0.437
0.480 0.472 0.463 0.453
0.480 0.473 0.463 0.453
2-3 students
N/A
0-1 students
2-3 students
2-3 students
CSEM-adjusted VAM correlations: Drop one student per teacher per year Drop two students per teacher per year Drop three students per teacher per year Drop four students per teacher per year Approximate per-teacher sample size gain from TME model adjustment
Weight by Modified Gainscore CSEM
Notes: The average within-teacher sample size in the full dataset is approximately 21 (see Table 2). At each restricted sample-size threshold (e.g., drop 1 student, drop 2 students, etc.), we repeat the procedure by which students are randomly dropped from teachers’ classrooms 10 times. The average correlation across the 10 iterations is reported in each cell. The correlations are very stable across iterations.
38
Table 8. Benchmarking Improvements in Model Performance from the CSEM Adjustments Using Changes to Within-Teacher Sample Sizes. Shrunken Teacher-Effect Estimates. Gainscore Model Weight by Gainscore CSEM
Lagged-Score Models Weight by Weight by Modified Gainscore CSEM Gainscore CSEM
Unadjusted shrunken VAM “target” correlation
0.457
0.467
0.467
CSEM-adjusted shrunken VAM correlation, full sample
0.477
0.488
0.488
0.470 0.464 0.454 0.446
0.481 0.475 0.465 0.456
0.482 0.475 0.465 0.456
2-3 students
2-3 students
2-3 students
CSEM-adjusted VAM correlations: Drop one student per teacher per year Drop two students per teacher per year Drop three students per teacher per year Drop four students per teacher per year Approximate per-teacher sample size gain from TME model adjustment Notes: Same as in Table 5.
39
Table 9. Replication of Table 7 Using the “Random Assignment” Subsample of Schools, Using the Same VAM Specification as in Table 7. Gainscore Model
Lagged-Score Models Correct for Constant Lagged-Score TME Weight by Variance, Weight by Gainscore Current-Score CSEM CSEM
Weight by Gainscore CSEM
Correct for Constant Lagged-Score TME Variance, Unweighted
Unadjusted VAM “target” correlation
0.445
0.458
0.458
0.458
0.458
CSEM-adjusted VAM correlation, full sample
0.466
0.437
0.462
0.479
0.480
0.460 0.453 0.448 0.440 0.436
N/A N/A N/A N/A N/A
0.456 0.448 0.443 0.435 0.430
0.473 0.466 0.462 0.454 0.449
0.473 0.466 0.462 0.454 0.449
3-4 Students
N/A
0-1 Students
3-4 Students
3-4 Students
CSEM-adjusted VAM correlations: Drop one student per teacher per year Drop two students per teacher per year Drop three students per teacher per year Drop four students per teacher per year Drop five students per teacher per year Approximate per-teacher sample size gain from TME model adjustment
Weight by Modified Gainscore CSEM
Notes: The average within-teacher sample size in the “random assignment” data subsample is approximately 20. At each restricted sample-size threshold (e.g., drop 1 student, drop 2 students, etc.), we repeat the procedure by which students are randomly dropped from teachers’ classrooms 10 times. The average correlation across the 10 iterations is reported in each cell. The correlations are very stable across iterations.
40
Table 10. Replication of Table 7 Using the “Random Assignment” Subsample of Schools and Models that Include School Fixed Effects. Gainscore Model
Lagged-Score Models Correct for Constant Lagged-Score TME Weight by Variance, Weight by Gainscore Current-Score CSEM CSEM
Weight by Gainscore CSEM
Correct for Constant Lagged-Score TME Variance, Unweighted
Unadjusted VAM “target” correlation
0.333
0.343
0.343
0.343
0.343
CSEM-adjusted VAM correlation, full sample
0.378
0.322
0.364
0.389
0.389
0.372 0.358 0.349 0.340 0.338 0.326
N/A N/A N/A N/A N/A N/A
0.358 0.344 0.335 0.326 0.324 0.314
0.382 0.369 0.360 0.351 0.347 0.335
0.382 0.369 0.360 0.351 0.347 0.335
5-6 students
N/A
2-3 students
5-6 students
5-6 students
CSEM-adjusted VAM correlations: Drop one student per teacher per year Drop two students per teacher per year Drop three students per teacher per year Drop four students per teacher per year Drop five students per teacher per year Drop six students per teacher per year Approximate per-teacher sample size gain from TME model adjustment
Weight by Modified Gainscore CSEM
Notes: The average within-teacher sample size in the “random assignment” data subsample is approximately 20. At each restricted sample-size threshold (e.g., drop 1 student, drop 2 students, etc.), we repeat the procedure by which students are randomly dropped from teachers’ classrooms 10 times. The average correlation across the 10 iterations is reported in each cell. The correlations are very stable across iterations.
41
Appendix A Alternative Specification of Imprecise Weights The results in Appendix Table A.1 are analogous to what we show in Table 2, except that we 2 specify the imprecise weights as Wi 1/ ( * TME ,i ) . These weights are ordinally accurate but
suboptimal because they understate the true differences across students in the quality of exam information. Appendix Table A.1. Correlations between Teacher Effect Estimates and Actual Values from Weighted Models with Imprecise Weights. Random Assignment of Students to Teachers. Class Size Average Correlation Correlation Standard Dev 20
Unweighted
0.68
0.052
20 20 20 20
1.00 0.75 0.50 0.25
0.77 0.75 0.73 0.70
0.041 0.042 0.047 0.050
Note: indicates the degree of imprecision in the weights. Higher values indicate more precision, with =1 representing the case with precise weights shown in Table 1. The simulations are performed 1,000 times. Average correlations across simulations are reported along with the variance in the correlation estimates.
42


![[PDF] Measurement Error: Models, Methods, and ... - Google Sites](https://m.moam.info/img/260x300/pdf-measurement-error-models-methods-and-google-si_64777fe9097c474d228c1bdc.jpg)