Dental age estimation of juvenile skeletal remains has utilized the methods of Moorrees,. Fanning and Hunt (1963) [MFH] and Demirjian,. Goldstein and Tanner ...
20
TESTING STANDARD METHODS OF DENTAL AGE ESTIMATION BY MOORREES, FANNING AND HUNT AND DEMIRJIAN, GOLDSTEIN AND TANNER ON THREE SOUTH AFRICAN CHILDREN SAMPLES 1
2
VM Phillips , TJ van Wyk Kotze 1
Department of Oral and Maxillo-facial Pathology, University of the Western Cape, South Africa Oral and Dental Research Institute, University of the Western Cape, South Africa
2
ABSTRACT Dental age estimation of juvenile skeletal remains has utilized the methods of Moorrees, Fanning and Hunt (1963) [MFH] and Demirjian, Goldstein and Tanner (1973) [DGT] for many years with various results. The Demirjian et al method has been tested by several authors on their population groups with varying results. The use of these methods to age the skeletal remains of South African children by the author has not been successful. The aim of this study was to test the accuracy of the dental age estimation methods of MFH and DGT on samples of children of different ethnic groups. The study showed that the MFH method consistently under-estimates the age and the method of Demirjian et al over-estimates the ages. (J Forensic Odontostomatol 2009;27:2:2028) Keywords: age estimation, juvenile, forensic dentistry
INTRODUCTION Charts prepared from population surveys have been used to determine the age of individuals for orthodontic and forensic purposes for many years and have been regarded as sufficiently accurate to estimate chronological age of a juvenile. Standard charts show the bone age, dental age, height and weight, sexual development and secondary growth patterns of children and juveniles. These charts have become the standard references for age assessment used 1 throughout the world. Subsequent studies have used radiographs of the jaws to determine the state of development of the entire mandibular dentition; the maxillary teeth are not easily seen on
pantomographic radiographs and little data is available for these teeth. These charts are based on dental surveys of cross sections of various populations and show the progressive states of dental 2 development for each year of age. Tanner (1962) suggested that the rate of skeletal growth had increased over the first half of th the 20 century therefore creating the difference between the earlier age 5 estimation charts and the recent ones. 3
Moorrees, Fanning and Hunt (1963) published charts based on a radiographic survey of the development of both the deciduous and permanent dentition. These charts indicate the average age and two standard deviations for the various developmental stages of the teeth. The range between ± two standard deviations represents an age range in which 95% of the population would be expected to reach the appropriate developmental landmark. These charts have proved useful for the assessment of a child’s dental development with regard to the skeletal developmental stage and for planning orthodontic treatment. They have also been used for age estimation of skeletal remains. A study of dental maturity by Demirjian, 4 Goldstein and Tanner (1973) using the pantomographic radiographs of 2928 boys and girls of French-Canadian ancestry between the ages of two and 20 was undertaken. The progressive developmental stages of the seven left mandibular teeth were allocated labels A to H. The various stages of dental development were recorded for each of the age groups. Maturity scores, based on
21 the work of Tanner, Whitehouse and Healy 5 (1962) were developed and allotted to each tooth during its developmental stages. The total of the maturity scores of the seven teeth was then converted to tables for both boys and girls to obtain an estimated chronological age. Several authors have tested the Demirjian et al method against their child population 6-11 groups with varying success. The aim of this study was to test the accuracy of the dental age estimation methods of Moorrees, Fanning and Hunt [MFH] (1963) and Demirjian, Goldstein and Tanner [DGT] (1973) against population samples of children of known chronological age from the Western Cape (Tygerberg sample), Black (Zulu) and Indian from Kwa-Zulu Natal.
MATERIALS AND METHODS The data used for this study consisted of 914 pantomographic radiographs of children between the ages of three years to 16 years that had routine dental treatment at the Dental Faculty at Tygerberg. These were recorded as the Tygerberg sample and consisted of 472 males and 442 females of White and Coloured* origin. The pantomographic radiographs of 91 Black (Zulu) children (44 females and 47 males) with an age range of between seven and 15 years were obtained from an orthodontic practice in Durban. A sample of 153 Indian children (82 females and 71 males) with an age range of six to 16 years was obtained from two orthodontic practices in Durban. Only radiographs showing normal development and no pathological lesions were used. Each radiograph was numbered for further reference together with the name, sex, date of birth and the date on which the radiograph was taken. The chronological age of each individual was calculated by subtracting the date of birth from the date when the radiograph was taken. Each radiograph was then examined and the stages of development of each of the permanent mandibular teeth in the left mandibular quadrant were recorded. The age of each child was estimated firstly using the method of MFH (1963) and then that of DGT (1973). The estimated ages of the Tygerberg sample were then compared to their chronological ages. The data from the Indian and Zulu samples were analyzed in a similar manner. The
data from each of the sample groups was used to analyze the error between the chronological age (real age) of each child with the age estimations of MFH and DGT methods respectively. One examiner observations.
undertook
all
the
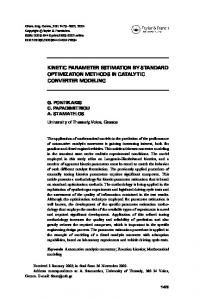
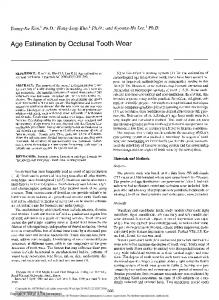
RESULTS The data from the Tygerberg sample was used to compare the real age (chronological age) to the estimated age by both MFH (1963) and DGT (1973) methods. Graph 1 shows a scatter diagram of the estimated ages using MFH method and compared to the real age; it was found that in the Tygerberg sample, this method under-estimated the ages in 89.2% of the sample on average by 0.91 years; the DGT method over-estimated the ages of these children on average by 0.89 years in 85.7% of the sample (Graph 2). The data for each of the three sample groups i.e. Tygerberg, Indian and Zulu, were used to test the degree of error between the estimated age and the chronological age. The estimation error [EE] was represented graphically by comparing the real age [RA] to the difference between the estimated age [EA] minus the real age [RA] for both MFH and DGT methods (Graphs 3, 4, 6, 7, 8 & 9). Graph 3 shows the estimation error compared to the chronological age of the Tygerberg sample of children by the MFH method. This graph shows that 96% of the sample lies below the chronological age. The error increases with age from 13 to 16 years. Graph 4 shows the estimation error compared to the chronological age of the Tygerberg sample by the DGT method. This graph shows that 86.3% of the sample lies above the chronological age. Graph 5 shows the degree of underestimation of the ages of the Tygerberg *Coloured people of South Africa. The Coloured people were descended largely from Cape slaves, the indigenous Khoisan population, and other black people who had been assimilated to Cape colonial society by the late nineteenth century. Since they are also partly descended from European settlers, Coloureds are popularly regarded as being of “mixed race” although the amount of admixture from the parental populations is highly variable (Adhikari, 2006).12
sample by the MFH and DGT methods in age intervals. This graph indicates that the MFH method under-estimates 81% of
22 individuals who are under 5 years of age; 94% between 5 and 7 years; 93% between 7 and 9 years; 97% between 9 and 11 years and 100% between 11 and 15 years. The DGT method therefore overestimates 62% of individuals under the age of 5 years; 83% between 5 and 7 years; 86% between 7 and 9 years; 81% between 9 and 11 years; 94% between 11 and 13 years and 91% between 13 and 15 years (Table 2). Graph 6 shows the under-estimation of the ages of the Indian children by the MFH method; 93.7% of the sample lies below the chronological age. Graph 7 shows the over-estimation of the ages of 79.2% of the Indian children by the DGT method. Graph 8 shows the underestimation of the ages of 96.7% of the Zulu children by the MFH method. Graph 9 shows the over-estimation of the ages of 90% of the Zulu children by the DGT method. Table 1 shows that the average age under-estimation of the Tygerberg sample
by the MFH method was 0.91 years in 89.2% of the sample; the average age over-estimation by the DGT method of this sample was 0.89 years in 85.7% of the sample. Table 2 shows the percentage of the Tygerberg sample in which the ages have been under-estimated by the Moorrees et al method and the percentage that have been over-estimated by the Demirjian et al method in age intervals. Table 3 shows the percentage of the 3 samples in which there was underestimation and over-estimation of the chronological ages by the methods of MFH and DGT respectively. The method of MFH under-estimated the ages of 96% of the Tygerberg sample, 93.7% of the Indian sample and 96.7% of the Zulu sample. The DGT method over-estimated the ages of 86.3% of the Tygerberg sample, 79.2% of the Indian sample and 90% of the Zulu sample.
Table 1: Average age estimation of the Tygerberg sample in years Moorrees et al
Demirjian et al
-0.91 (in 89.2%)
0.89 (in 85.7%)
Table 1 shows that in the Tygerberg sample the Moorrees et al method under-estimated the chronological age of 89.2% of the sample by 0.91 years. The Demirjian et al method over-estimated the chronological age of 85.7% of the sample by 0.89 years.
Table 2: The percentage under-estimation of the ages of the Tygerberg sample in age intervals by Moorrees et al and over-estimation by Demirjian et al methods Demirjian Age Interval