Jun 9, 2003 - Paid $50 to participate. â Surveyed on WTP for COOL Hamburger and Steak. â Experimental Process. ⢠Random nth Price Auction. â Bid on ...
The Characteristics Affecting Consumers’ Perceptions and Preferences for U.S. versus Imported Beef Wendy Umberger Colorado State University
Dillon Feuz, Chris Calkins, & Bethany Sitz University of Nebraska-Lincoln WCC-72 Annual Meetings Las Vegas, NV June 9, 2003
Country-of-Origin Labeling z
Country-of-Origin is a Credence Attribute (Caswell, 1998; Loureiro & McCluskey, 2000)
z
Mandatory COOL may be an appropriate policy tool if: – Asymmetric information exists – COOL increases demand for product – Disclosure of possible negative quality attributes does not exceed the benefits (Golan et al, 2000)
z
Some Consumer, Meat Processors, Wholesalers, Retailers and Restaurants prefer COOL (Schupp & Gillespie, 2001)
“Estimating Consumer Willingness-to-Pay for Country-of-Origin Labeling.” Loureiro and Umberger JARE, 2003 z
z
A Select Group of 243 Colorado Consumers along the front range of Colorado in A Survey Conducted In Grocery Stores Would: – Pay $183.77 Per Year For Mandatory COOL – Pay $1.53/lb. More for Steak • 38% Premium for Steak
– $0.70/lb. More for Hamburger • 58% Premium for Hamburger
What is Mandatory COOL? z
z
Title X of the 2002 Farm Bill Amends the Agricultural Marketing Act of 1946 “…a Retailer of a Covered Commodity Shall Inform Consumers, at the Final Point of Sale of the Covered Commodity to Consumers of the Country Of Origin Of the Covered Commodity”
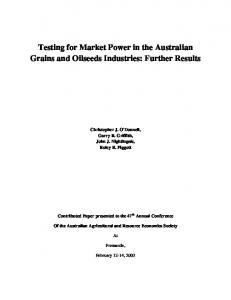
2002 Supply of Roasts and Steaks for U.S. Consumption (source: Plains and Grimes, 2003) Canadian born, raised and slaughtered beef 4.7%
U.S. born, rasied and slaughtered beef 88.7%
Canadian born and raised and U.S. slaughtered beef 2.7%
Canadian born and U.S. raised and slaughtered beef 1.8%
Mexican born and U.S. raised and slaughtered beef 2.2%
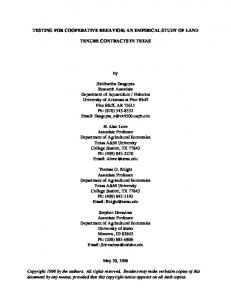
2002 Supply of Beef Trimmings for U.S. Consumption (source: Plains and Grimes, 2003)
Australian Beef 8.5%
U.S. born, rasied and slaughtered beef 76.6%
New Zealand Beef 4.5%
Canadian born and U.S. raised and slaughtered beef 1.5%
Canadian Beef 3.3% Canadian born, raised and U.S. slaughtered beef 2.3%
Brazilian Beef 1.5%
Mexican born and U.S. raised and slaughtered beef 1.9%
Current Objectives z
To Determine – Consumers’ preferences and WTP for COOL and U.S.A. Guaranteed Label – Attributes important to consumers’ purchase decisions – Consumers’ preferences and WTP for steak after tasting • Canadian vs. US • Australia vs. US
– Segment of consumers WTP premium for preference
Methods z
273 Consumers in Denver and Chicago – Paid $50 to participate – Surveyed on WTP for COOL Hamburger and Steak – Experimental Process • Random nth Price Auction – Bid on “USA Guaranteed: Born and Raised in the U.S.” Labeled & Unlabeled Steak – Tasted, Rated and Bid on pairs of steak with tenderness and marbling held constant within a pair • Canadian vs. US • Australia vs. US
Consumer Demographics z z z z z z z z z
87% Caucasian 73% Female ~ 40 yrs old Married 63% Children < 18 at home Income $50-$60 K Employed Average Education of Some College 70 % Prefer to Consume Beef
Important Food Characteristics Loureiro and Umberger Extremely to Very Desirable 1. Fresh 2. Food Safety Inspection 3. High Quality 4. Lean 5. Visual Presentation Very to Somewhat Desirable 7. Source Assurance 9. Beef Raised in your region of the country
Umberger, Feuz, Calkins & Sitz Extremely to Very Desirable 1. Fresh 2. Food Safety Inspection 3. Color 4. Price 5. Leanness Very to Somewhat Desirable 9. COOL 11. Source Assurance 13. Beef Raised in your region of the country
Consumers’ Rationale for Preferring COOL (75 % Preferred Labeled, 22% Indifferent) z
Safety and Health of Meat, 45% – U.S. better regulations and standards – Mad Cow Disease
z
z z
z z
More Information (Awareness of conditions, Identify meat if Outbreak Occurs), 31.8% Support Producers (U.S.), 21% Location (Prefer from certain countries, Learn about countries), 12.5% Quality of Meat Higher in U.S., 11% Freshness of Meat Closer to Home, 4.5%
Survey WTP Results: Umberger, Feuz, Calkins, Sitz z
“COOL Steak” – 73% Consumers were WTP Premium – $0.42 over $4.00/lb – 11% Premium for label
z
“COOL Hamburger” – – – –
z
72% Consumers were WTP Premium $0.36/lb over $1.50/lb 24% Premium for label Higher than for Steak
Overall Premiums Smaller than Loureiro and Umberger
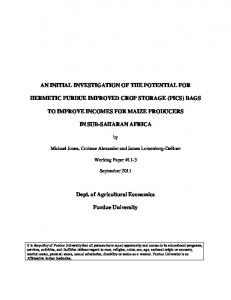
Visual Auction WTP Results: “U.S. Guaranteed Steak” versus Unlabeled Steak z
Chicago – $1.03/lb more for “U.S. Guaranteed Steak” (base = $4.53/lb) – 23% Premium for labeled steak
z
Denver – $0.57/lb more for “U.S. Guaranteed Steak” (base = $4.12/lb) – 14% Premium for labeled steak
z
Overall – $0.81/lb more for “U.S. Guaranteed Steak” (base = $4.33/lb) – 19% Premium for labeled steak
z
Chicago Premiums were Larger than Denver
31% WTP NO 30% Premium 25% 20% 15%
11% WTP 20-25% 12% WTP 10-15%
9% WTP >100%
10% 5%
Premiumfor U.S.A. Labeled Steak (%over Unlabeled)
% 95
% 85
% 75
% 65
% 55
% 45
% 35
% 25
% 15
5%
0%
0%
% of Participants WTP Premium
35%
Who’s WTP for COOL?: Logit Model
z
z z z z z
Consumers concerned about Food Safety and Source Assurance Females with children Lower Income Higher Educated Beef eaters Consumers purchasing beef at alternative locations
Rating (1= unacceptable, 8 = extremelly acceptable)
Can Consumers Perceive a Difference in Flavor? : Australian vs. Domestic 6.00
5.67 5.19
5.00
4.57
5.37
5.16 4.49
4.37
Domestic Australian
4.32
4.00 3.00 2.00 1.00 0.00 Flavor
Juiciness
Tenderness
Overall Acceptability
Rating (1= unacceptable, 8 = extremelly acceptable)
Can Consumers Perceive a Difference in Flavor? : Canadian vs. Domestic 7.00 6.00
5.93
5.64
5.51 5.36
5.64
Domestic Canadian
5.35
5.78
5.47
5.00 4.00 3.00 2.00 1.00 0.00 Flavor
Juiciness
Tenderness
Overall Acceptability
Average Willingness-to-Pay: Australian vs. US Average Bids: Australian vs. US $4.50
$ per Pound
$4.00 $3.50 $3.00
$3.61
38% Premium $2.75
$1.00 $0.50
45% Premium
$2.56
$2.50 $2.00 $1.50
$3.90
$1.34 $1.04
$3.75
Domestic Australian Difference
46% $2.57 Premium
$1.19
$Denver
Chicago
Overall
Average Willingness-to-Pay: Canadian vs. US Domestic Canadian Difference
$ per Pound
Average Bids: Canadian vs. US $5.00 $4.50 $4.00 $3.50 $3.00 $2.50 $2.00 $1.50 $1.00 $0.50 $-
$3.73 $3.48
7% Premium
$4.29 $3.76
$4.00 $3.62
14% Premium
$0.53 $0.25 Denver
Chicago
11% Premium
$0.39 Overall
Are Consumers Willing-to-Pay for their Taste Preference?: Australian vs. US $6.00 $5.04
Average Bid ($/lb)
$5.00 $4.00 $3.00
$4.82
Domestic Bid Australian Bid Difference
N = 139 60%
$2.45
$2.59
$2.74
N = 40 17% $2.08
$2.00
N = 54 23% $1.18 $1.18
$1.00 $0.00
$0.00 Domestic Preferring
Australian Preferring
Indifferent
Are Consumers Willing-to-Pay for their Taste Preference?: Canadian vs. US $6.00 $5.20
$5.20
Average Bid ($/lb)
$5.00
N = 106 45%
$4.00 $3.17
$3.00
$3.59
Domestic Bid Canadian Bid Difference
N = 78 34%
$2.07 $2.07
$2.03
$2.00
N = 49 21%
$1.61
$1.00 $0.00
$0.00 Domestic Preferring
Canadian Preferring
Indifferent
Predicting Flavor Preferences TASTE PREF i = β 0 + β 1 Location i + β 2 Gender i + β 3 Ethnic i + β 4 Pr iceDrive + β 5 Income 2 i + β 6 BeefEat i + β 7 MarryKids i + β 8 Age 2 i + β 9 GradeDK i + β 10 Educate 2 i + β 11 NoEmploy i + ε i . z z
Multinomial Logit Model Australian vs. US – Domestic Preferring: Chicago, Higher Income, Married with Kids, Older – Australian Preferring: non Chicago, Lower Income
z
Canadian vs. U.S. – Domestic Preferring: Caucasian, Married with Kids, Older – Canadian Preferring: Non Caucasian
i
Summary z
z
z z z z
Consumers WTP significant Premium for COOL Premium appears to be higher when the label states “U.S. Certified” or “U.S. Guaranteed” 11% Premium for COOL Steak 24% Premium for COOL Hamburger 19% Premium for U.S. labeled WTP is significantly Higher for Hamburger
Who’s WTP for COOL? z
z z z z z
Consumers concerned about Food Safety and Source Assurance Females with children Lower Income Higher Educated Beef eaters Consumers who purchase beef at alternative locations
U.S. vs Imported Taste Summary z
z
z
z
29% of consumers consistently preferred the taste of domestic to imported steak Likely due to similarities in US and Canadian Production Processes Niche for Australian or Imported GrassFed Product Canada could compete with US if same quality
COOL Implications z z
z
Will COOL increase beef demand? Appears consumers don’t understand that it’s not food safety Placement of label and other meat attributes – (food safety concerns important)
z z z
What about other meat products? U.S. versus major importers? Do premiums cover costs?
Questions?