TEXT GRAPHS: ACCURATE CONCEPT MAPPING WITH WELL-DEFINED MEANING
Esko Nuutila and Seppo Törmä, Helsinki University of Technology, Finland Email:
[email protected] or
[email protected] (http://tge.cs.hut.fi/) Abstract. Text graphs are special kind of concept maps that can be used in domains where accuracy and well-defined meaning are important. This sort of accuracy is often needed in technical domains like computer science, or whenever a detailed understanding of some complex structural constructions or causal interactions is required. Like traditional concept maps, text graphs are based on few primitive constructs and are thus easy to learn. Unlike traditional concept maps, text graphs allow accurate representation of non-binary relations and relational concepts as well as general propositional information. A text graph can be automatically translated to a set of natural language sentences that people can naturally attach a meaning. The set of sentences is called the text expansion of the graph. The propositional meaning of a text graph – i.e., what the graph asserts about the relationships of concepts - is the same as the meaning of its text expansion. To make text graphs a practical and usable notation, we have developed a text graph editing tool TGE. Category: Full Paper
1
Introduction
Text documents are external representations of the internal conceptual and propositional structures in the author’s cognition. When we are reading or producing text, one way to improve the understanding of its content is to use additional externalizations, possibly in some suitable diagrammatic notation, that help us to organize, elaborate, and evaluate the underlying conceptual and propositional structures. Externalized diagrammatic representations provide the benefits of distributed cognition (Hutchins, 1995; Clark, 1997; Norman, 1993): the potentially complex structures need not be kept in the short-term memory but are stored in an external media for later retrieval and modification. In addition, the structures become open to reflection and can be analyzed at a meta-level to reveal the overall structure of the document, the nature of connections, the borders of the topic, and potential gaps in the understanding. As a consequence of such reflection, the understanding of the subject matter hopefully improves and the externalized representation can be reorganized to better suit to the new understanding.
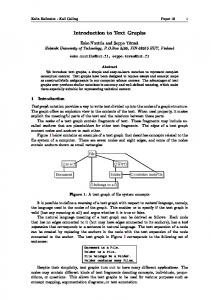
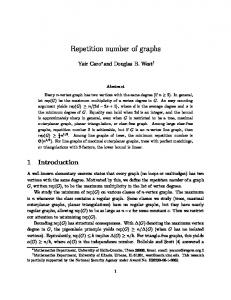
Tide means the periodic change of the level of the surface of the oceans. Tides are created by the rotation of the Earth, the gravitational attraction of the Sun and the gravitational attraction of the Moon on the surface of the oceans. The highest tide occurs when the Earth, the Sun and the Moon and aligned. The lowest tide occurs when the Sun and the Moon are at right angle with one another. Figure 1: A text graph of astronomical tide together with its textual meaning
Bullet lists, mind maps (Buzan, 1974), and concept maps (Novak and Gowin, 1984; Novak, 1998) are examples of widely used representations to support the understanding and production of text. These notations have different properties and consequently are best applicable to different kinds of domains and different stages of processing. Bullet lists and mind maps are more useful in less organized domains and in early stages of processing, such as in note taking or initial sketching of a document. The advantages of
concept maps, on the other hand, come in more organized domains and at the later stages of text understanding or production when a more detailed and organized picture needs to be created. In this paper we describe a variation of concept maps called text graphs. Text graphs are best suited for accurate description and definition of complex conceptual and propositional content. Basically, text graphs provide a simple way to split text into fragments and relate these fragments to each other with inclusion relations. Figure 1 contains an example of a text graph that describes concepts related to astronomical tides. Some of the nodes contain points of inclusion, so-called anchors, shown as small rectangles. The box below the figure shows a set of sentences that is the text expansion of the graph. It can be derived automatically from the graph and it helps in determining the meaning of the graph. In the remaining of the paper we first describe the problems that text graphs are intended to solve, then introduce the basic structures of text graphs, and present the method to derive their propositional meaning. We outline some advanced constructs and their transformations to simple text graphs. Finally we give an overview of a tool called TGE designed for editing and managing text graphs. Throughout the paper we illustrate the uses and properties of text graphs with examples developed using TGE. 2
Background
During the past several years we have successfully used concept maps in our introductory programming courses for first-year university students (Nuutila, Törmä, and Malmi, 2004). Computer programming is a technical area that contains a large number of abstract concepts and mechanisms that novice programmers are not familiar with. To be able to productively use the central mechanisms in computing — such as parameter passing, exceptions, iteration and recursion constructs — a student needs to understand them in a detailed and exact manner.
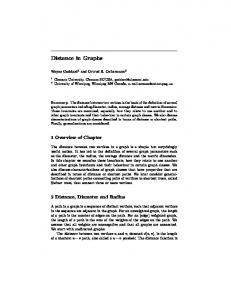
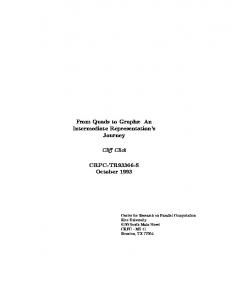
Figure 2: Typical ways of representing a relationship in a concept map
When we have instructed our students in the use of concept maps and studied the maps they produced, we have repeatedly encountered the following kinds of problems in the concept map notation: • Ambiguity. The relations seldom specify uniquely the intended reading. The readers must use their background knowledge and imagination to read a relationship. As a result, different people — and also the author of the map at different points of time — may produce different readings of the same relationship. • Binary-only relations. Fundamentally, concept maps are meant for representation of concepts and binary relations between them. In our experience, the attempt to represent other kinds of relations leads to cumbersome or unnatural maps. • Concept/relation separation. The relations can be used to make propositions about concepts, but it is not possible to specify relations that make propositions about other relations in a concept map. This separation between concepts and relations probably makes the use of concept maps easier in simple cases but reduces their applicability to other more advanced uses.
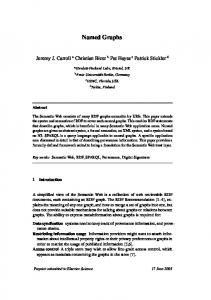
The three concept maps is Figure 2 illustrate these problems. Each map tries to describe a relationship as a concept and give some instances of the use of the relationship. As an example, we use the relationship ‘father-in-law’, i.e., the father of one’s husband or wife (Simpson and Weiner, 1989). In short, we define ‘father-in-law’ as ‘the father of one’s spouse’. The examples all illustrate the kinds of concept maps — and also the kinds of flaws — that students in our experience often make. In map (A), the concept of ‘father-in-law’ and its instances are neatly connected. However, the map is ambiguous. Without contextual knowledge, we cannot tell whether ‘Eugene O’Neill’ or ‘Robert Sargent Shriver, Jr.’ is the father-in-law of ‘Arnold Schwarzenegger’. Map (B) tries to solve this ambiguity by using ‘father-in-law’ as a link label. The price is that the concept of ‘father-in-law’ and the instances of ‘father-in-law’ relationships are now structurally disconnected. In addition, another ambiguity has emerged. Although the arrowheads give the direction of the ‘father-in-law’ relationships, there are two alternative readings with the opposite meanings: ‘X is father-in-law of Y’ or ‘X has father-in-law who is Y’. The intended meaning should be explicitly stated, but in our experience, the creator of a map if often blind to this kind of ambiguity. Moreover, in a good concept map, the links should present propositions about concepts. However, the ‘of’ links in maps (A) and (B) do not present any propositions; they are linguistic constructs. An alternative is to use three-sided links as in map (C). Here the problem is again ambiguity, but it is more severe than in maps (A) and (B): the ‘is of’ label cannot be replaced with any single label that produces a non-ambiguous reading. The inherent problem is that we try to present a non-binary relation with a fundamentally binary representation. To solve the problem, we would need a way to order the concepts that are linked and the words in the link label, for example, (1) ‘father-in-law’ (2) ‘is’ (3) ‘father’ (4) ‘of’ (5) ‘spouse’. This is exactly what has been done in the text graph formalism. Figure 3 presents the ‘father-in-law’ relationship as a text graph (with some additional information) and the resulting text expansion. Here the small boxes — called anchors — inside the larger boxes present the order of the connected concepts and text inside the boxes.
Father-in-law is the father of the spouse. Eugene O’Neill is the father-in-law of Charlie Chaplin. Robert Sargent Shriver, Jr. is the father-in-law of Arnold Schwarzenegger. Robert Sargent Shriver, Jr. is the founder of Peace Corps. Arnold Schwarzenegger is the Terminator. Figure 3: A text graph of father-in-law relationship and its text expansion
Åhlberg (2002) has presented improvements to concept mapping in the same spirit as text graphs. He stresses non-hierarchical nature of knowledge, the importance of accuracy in the labels of concepts and relations, and that each concept should appear only once in a map. One concrete technique is to draw concept nodes inside others that represent more complex concepts. Unfortunately, this is only a partial solution, since a node cannot be inside more than one other node. 3
Basic structures and their meaning
The basic structures of text graphs are described in Figure 4. The central concepts are shown in the bold face font. The box below the figure shows the text expansion of the graph. Figure 4 identifies two important roles in which the nodes can appear in a text graph: root concepts and root sentences. The root concepts are simple terms that do not contain anchors. The role of root sentences, on the other hand, is central in the definition of the meaning of a text graph. Root concepts could be thought of as most concept-like and least proposition-like nodes and root sentences as least concept-like and most proposition-like nodes. It should be noted that there can also be nodes that are neither root concepts nor root sentences, as the “set of” nodes in Figure 4. These nodes are more difficult to characterize. Usually they represent
structural concepts, non-independent sentences, or parts of other sentences. Note also that if text graph only contains text nodes without any anchors, they are all both root sentences and root concepts. A simple text graph is one where (1) every anchor is connected to exactly one node and (2) no node path in the graph is cyclic. Node path is a sequence of nodes where node n2 can follow node n1 in the path if and only if there is an anchor a in node n1 and edge e that connects a and n2. Node path contains a cycle if some node appears two times in the path. Simple text graphs are not as limited as they may initially appear. Text graphs in Figures 1, 3, 4, and 5 are all simple. Moreover, the first constraint of simple text graphs is lifted below when we describe how general text graphs containing multiply connected anchors can be translated into simple text graphs. The second constraint (no cyclical node paths) is more fundamental and cannot easily be removed. However, it only specifies that certain very rare types of cycles in text graphs are illegal, and does not prevent the description of recursive or inductive structures.
Text graph consists of a set of Text Nodes and a set of Edges. Text node contains a sequence of Character strings and Anchors. Text node is presented as a Box. Edge connects a Text node and an Anchor. Edge is presented as a Line. Anchor is presented as a tiny Box. Root concept is a Text node containing no Anchors. Root sentence is a Text node that is not connected to any Anchor. Figure 4: The basic structures of text graphs and the resulting text expansion
Now that the structures of text graphs have been presented, we are faced with the question of the meaning of text graphs. Unless we can give a characterization of their meaning, creating text graphs is little more than drawing pictures that different people can and will interpret in different ways. That would severely limit the usability of text graphs in communication between people. In the following we will deal separately with the propositional meaning (or sentence meaning) and non-propositional meanings of text graphs. Propositional meaning concerns what the graph asserts, that is, what propositions it makes. Each proposition has a truth value (true or false) that is the basis for arguing whether the graph makes true or false assertions. Non-propositional meanings deal with what the graph conveys without asserting it. In text graphs it includes the meaning of concepts and the structure of the system of concepts. The propositional meaning of a simple text graph is specified with respect to the language used in the nodes (note that we do not attempt to specify a formal semantics for text graphs). We define that the propositional meaning of a simple text graph is the propositional meaning of its text expansion. A text graph makes all the same assertions than its text expansion and no other assertions beside those. The text expansion is a string containing expressions in a natural language and its meaning is possibly affected by the interpretation of the people who read it. However, the following can be said: 1. The propositional meaning of two different text graphs is the same for an individual reader, if their text expansions have the same propositional meaning for that reader.
2.
The propositional meaning of one text graph is the same for two different readers, if its text expansion has the same propositional meaning for them. It should be noted that depending on the text fragments that the nodes of the graph contain, the text expansion can be syntactically malformed, and therefore without any propositional meaning. In addition, it is quite possible to use natural language in a contradictory or ambiguous manner. Since text graphs do not prevent these kinds of uses of language, it is only possible to say that text graphs have a clear propositional meaning when used in a sensible way. The text expansion of a simple text graph can be derived as specified in Figure 5. These rules rely on the properties of simple text graphs: there is exactly one node connected to each anchor and that graph does not contain cyclical node paths. The text expansion of a text graph is unique, if the order of the sentences produced is not considered relevant. There are some linguistic issues — such as inclinations, genders, and articles — in the forming of the text expansion, which are outside the scope of this paper. It can be shown that every simple text graph has a finite text expansion (Figure 5). To see this, note that there is a finite number of nodes in the graph and if the graph does not contain cyclical node paths, the text expansion is computed exactly once for each node. (It is interesting to note that Figure 5 is a specification of a recursive function as a text graph.)
The type of a Text expansion is a Character string. Text expansion of a Character string is the Character string itself. Text expansion of an Anchor is the Text expansion of the Node connected to the Anchor by an Edge. Text expansion of a Text node is the concatenation of the Text expansions of its elements. Text expansion of Text graph is the conjunction of the Text expansions of its Root sentences. Figure 5: A text graph describing the text expansion
As stated above, the text expansion helps to determine the propositional meaning of a text graph. But why would we want to construct a text graph instead of simply writing the intended text expansion directly? The reason is that there are important non-propositional meanings that we want to develop or express with a graph. The central ones concern the meanings of the different concepts in the graph. The graph structure helps us to see what is the context of each concept and how each concept is related to other concepts. These aspects work as constraints on the possible meanings of the concepts. When the right relations have been specified - a task in which the propositional meaning works as a sanity check the meaning of the concepts can be greatly clarified. There are also non-propositional meanings that concern the whole system of concepts expressed in the graph: is the graph connected or are there disconnected parts, what are the central concepts (by the number of connections), where the connections seem weak (suggesting poor understanding), and so on. This kind of meta-level analysis can lead into significant clarification of the original concepts and the relationships between concepts and propositions.
4
Advanced constructs and their transformations
This section describes some advanced constructs of text graphs and how they can be transformed back to simple text graphs. The transformations are needed to specify the meaning of these constructs; it is not suggested, that the author of the graph should carry out these transformations with the graphs he or she is producing. Quite the contrary, these advanced constructs are intended as shorthand notation that simplify the creation of graphs and make them easier to understand. 4.1
Multiply connected anchors
As shorthand it is possible to draw text graphs where anchors are connected to multiple edges. This kind of graphs can always be automatically converted to simple graphs as shown in 6. Therefore the text expansion rules shown above are sufficient to specifying also the meaning of these non-simple cases, as long as the graphs are acyclic. Figure 6 shows how a node containing two multiply connected anchors (at the left) is split into a set of nodes with singly connected anchors (at the right). The number of resulting singly connected nodes is the size of the Cartesian product of the connections of the anchors in the node.
Gravitational attraction of the Sun influences the level of Tide. Gravitational attraction of the Moon influences the level of Tide. Location of the Sun influences the level of Tide. Location of the Moon influences the level of Tide. Figure 6: An example of a multiply connected anchors and resulting simple text graph
When one node is transformed into multiple singly connected nodes (for instance, the “of the” node in the figure), it is possible that other nodes (in this case, the “influences ...” node) get multiply connected anchors as the result. Consequently they have to be multiplied. The transformation thus propagates in the text graph but only toward the root sentences. The root sentences may be multiplied but that does not result in any additional multiply connected anchors (as is the case in the figure). Therefore the propagation always terminates. 4.2
Subgraphs
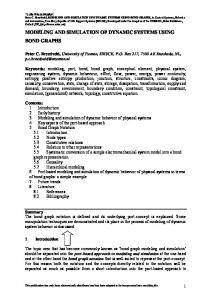
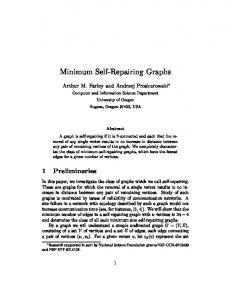
In addition to text nodes, a text graph can contain other text graphs as subgraphs. Figure 7 gives an example where the famous argument from John Locke’s Second Treatise of Government is presented inside a subgraph. (Note that the original wording of the argument is somewhat revised to eliminate synonymous phrases.) The content of the subgraph is attributed to John Locke, not the author of the text graph. The author may not want to present the argument in his or her own name since the argument is not logically valid (Fisher, 1988). The central concepts in the argument are presented outside of the subgraph since they are not Locke’s inventions. The subgraph is an ordinary text graph with nodes and anchors connected by edges. However, there are two additional issues. First, the nodes and anchors inside a subgraph can be connected to nodes or anchors outside the subgraph. Second, the subgraph itself can be connected to other nodes or anchors. The meaning of a subgraph is the text expansion of the conjunction of the root sentences of the subgraph. Consequently, a text graph containing a subgraph can be transformed into a simple text graph by replacing the subgraph with a node that represents a conjunction of the root sentences of the subgraph (“root sentence 1 AND root sentence 2 AND …”).
4.3
Edges between two nodes or two anchors
An edge between two nodes indicates that the meaning of these nodes is the same. Such an edge can be replaced by a new node “a1 EQUALS a2” that contains two anchors a1 and a2. First of the anchors is connected to the first node and second to the second node. An edge between two anchors means that they have the same but unknown meaning. Such an edge can be replaced with a node representing a variable (for example, X) and with two edges from the anchors to that new variable node.
Figure 7: The argument of John Locke presented in a subgraph
5
Text graph tool
Creating a graphical presentation like a text graph by paper and pencil is a tedious task. It is difficult to determine in advance the space requirements and the relative positions of the different parts of the presentation. This problem is greatly magnified when the understanding of the presented structure evolves over the time. The manual labor and the problems with the layout may take most of the capacity of the author. To enable the authors to pay most of their attention on the conceptual content of the subject matter, a suitable drawing program is a necessity. For concept mapping there is a freely available drawing tool called Cmap (Novak, 2001), which in our experience is indispensable when working with concept maps. However, it is not completely adequate for text graphs, which require support for fluent editing of mixed content of character strings and anchors, as well as flexible control over the routing of the edges. To make text graphs a practical and usable notation, we have implemented a text graph editor called TGE. The figures in this paper have been drawn with TGE. The basic capabilities of TGE include node creation and deletion, editing of mixed content of character strings and anchors in an Emacs-like manner, creation and deletion of edges, and moving the graph elements maintaining the topological relations. More advanced functionality of TGE includes: • Orthogonality constraints for the edge segments and automatic constraint propagation. This allows the creation and maintenance of edges that consist of orthogonal segments. • Node and edge styles. All graphical aspects of a nodes and edges can be controlled with styles, including background, line properties, roundings, margins, fonts, etc. In the figures in this paper we have used styles sparingly to focus the attention to the structural properties of text graphs. • Unlimited undo and redo functionality, and complete logging of the editing operations. In addition of helping the editing task, these capabilities make it easier to have different versions of the same text graph. • Programming interface that allows the graphs be created programmatically using the Scheme programming language. • Multiple simultaneous graphical layouts of the text graph. With this functionality, the user can experiment with different layouts for the same graph, while maintaining the topological structure and the textual content of the graph intact. TGE is implemented in Java. It stores the text graphs and editing logs into Scheme files, and uses Kawa, a free Java-based Scheme system (Bothner, 2003) for processing the Scheme expressions. TGE
uses the Qoca constraint solving library (Marriott et al., 1998) for propagation of changes through the graph. TGE is still in development. The preliminary version that we have is mostly satisfactory. When a sufficiently reliable version has been created, we will make it freely available. 6
Discussion
We have introduced text graphs, a simple notation to represent complex conceptual content. Their goal is to aid human cognitive processing, for instance, in educational settings. The main advantages of text graphs over previous notations with similar goals are accuracy and clear propositional meaning. These properties make text graphs especially suitable for technical domains like computer science. We have also implemented a text graph editor called TGE. Since a text graph is really just a set of text fragments extended with simple inclusion relations, they can be used for many purposes that ordinary text is used. The nodes can contain any text: concepts, references to individuals, propositions, or questions. When the relations are used in a proper manner, interesting structural information about the text can be made explicit. Text graphs also suit to different modes of use. There is a correspondence between a text graph and a set of natural language sentences. This correspondence can be used in both directions. On the one hand, an existing text document can be analyzed and a text graph produced to reveal conceptual or propositional structures in the document. On the other hand, a text graph can be produced first and then be used to derive the text that describes the essential structures of the domain. These operations can even be combined: an existing text can be analyzed and a text graph created; then a text expansion is produced as the basis for a text that contains the same information as the original text but is hopefully more explicit and clear. We intend to use text graph notation and TGE tool in our future computer science courses. We anticipate that this tool will also be used in other domains such as argumentation analysis (Fisher, 1988), knowledge management, development of ontologies, and definition of some diagram types used in computer science and software engineering. References Bothner, P., 2003. Kawa, the Java-based Scheme system. v. 1.7, http://www.gnu.org/software/kawa/. Buzan, T., 1974. Use Your Head. BBC, London. Clark, A., 1997. Being There: Putting Brain, Body, and the World Together Again. The MIT Press, MA. Fisher, A., 1988. The logic of real arguments. Cambridge University Press, Cambridge. Hutchins, E., 1995. Cognition in the Wild. The MIT Press, MA. Marriott, K., Chok, S. S., Finlay, A., 1998. A tableau based constraint solving toolkit for interactive graphical application. In: Maher, M. J., Puget, J.-F. (Eds.), 4th International Conference on Principles and Practice of Constraint Programming, Pisa, Italy, 26th-30th October, 1998. Lecture Notes In Computer Science. Springer-Verlag, London, UK, pp. 340–354. Norman, D. A., 1993. Things that make us smart: defending human attributes in the age of the machine. Addison-Wesley, Reading, MA. Novak, J. D., 1998. Learning, Creating, and Using Knowledge: Concept Maps As Facilitative Tools in Schools and Corporations. Lawrence Erlbaum Assoc., London. Novak, J. D., 2001. The theory underlying concept maps and how to construct them. Version 2.9.1, http://cmap.coginst.uwf.edu/info/. Novak, J. D., Gowin, D. B., 1984. Learning How to Learn. Cambridge University Press, Cambridge. Nuutila, E., Törmä, S., and Malmi, L., 2004. PBL in an introductory programming course — how to apply the Seven Steps Method. Submitted for publication. Simpson, J., Weiner, E. (Eds.), 1989. Oxford English Dictionary, 2nd Edition. Oxford University Press, http://dictionary.oed.com. Åhlberg, M., 2002. Concept maps and improved concept mapping. Postscript in the Finnish edition of Novak (1998), in Finnish, see also http://www.metodix.com.