The 3D Visualization of Brain Anatomy from Diffusion-Weighted Magnetic Resonance Imaging Data Burkhard C. W¨unsche∗ and Richard Lobb† Division for Biomedical Imaging and Visualization, Department of Computer Science University of Auckland, Auckland, New Zealand
Abstract
1999; Barnea-Goraly et al. 2003]. Visualizing the nerve fiber structure also represents a valuable teaching tool. Our approach starts with slice images familiar to the medical specialist and progressively expands the dimension and abstraction level of the representation in order to provide new insights into the data. In particular we present four innovative techniques for the visualization of DTI data. Barycentric color maps allow an integrated view of different types of diffusion anisotropy. Ellipsoid-based textures in combination with spherical or barycentric color maps indicate the nerve fiber direction and different anisotropy properties and tissue types. Anisotropy Modulated Line Integral Convolution (AMLIC) creates images segmented by tissue type and incorporating a texture representing the 3D orientation of nerve fibers. Finally streamtubes and hyperstreamlines visualize the complex 3D structure of nerve fiber tracts and their inherent diffusion properties. All images in this paper were created with a toolkit we developed specifically for visualizing biomedical data sets [Wu¨ nsche 2003b].
A common problem in biomedical sciences is the in vivo identification and analysis of anatomical structures. This paper introduces several novel techniques to identify and visualize nerve fiber tracts and different tissue types using diffusion-weighted magnetic resonance imaging data. Barycentric color maps allow an integrated view of different types of diffusion anisotropy. Ellipsoid-based textures and Anisotropy Modulated Line Integral Convolution create images segmented by tissue type and incorporating a texture representing the 3D orientation of nerve fibers. Finally streamtubes and hyperstreamlines represent the full 3D structure of nerve fiber tracts and their inherent diffusion properties. The effectiveness of the exploration approach and the new visualization techniques are demonstrated by identifying various anatomical structures and features from a diffusion tensor data set of a healthy brain. CR Categories: I.3.8 [Computer Graphics]: Applications; I.3.6 [Computer Graphics]: Methodology and Techniques—Graphics Data Structures and data types; J.3 [Computer Applications]: Life and Medical Sciences
2
Diffusion tensor imaging (DTI), also known as diffusion-weighted MRI imaging (DWI), is used to measure the intrinsic properties of water diffusion in the brain by an orientation invariant quantity, the diffusion tensor D [Basser et al. 1994; Basser 1995]. The eigenvalues and eigenvectors of the symmetric second-order tensor D define the principal axes of a diffusion ellipsoid which expresses the spatial distribution of water molecules originating at a point location after an infinitesimal time period. DTI almost completely suppresses effects due to water in the blood vessels [Basser 2000] and can be used to measure the diffusion of cerebral spinal fluid (CSF) and fluid inside of nerve cells. The results of the measurement are the six components of the symmetric diffusion tensor D and the T2 weighted signal intensity in the absence of diffusion sensitization. Images of water diffusion can provide pathophysiological information complementary to T1 and T2 weighted MRI images. The technique is sensitive to movements of the order of a few microns and is described in more detail in [Basser and Pierpaoli 1996; Pierpaoli et al. 1996; Aronen et al. 1999]. In the brain DTI can be used to differentiate three types of structures. Fluid filled compartments are characterized by a very high isotropic diffusion, i.e., the diffusion is similar in all directions. In contrast nerve fibers restrict the diffusion to one direction only due to the presence of cell membranes and myelin sheaths surrounding the axons. Fiber tracts, consisting of millions of parallel nerve fibers, are therefore identified as areas of a high anisotropic diffusion. The orientation of such fiber tracts is determined from the principal directions of the diffusion tensor. Finally gray matter is characterized by a low and nearly isotropic diffusion since the water diffusion is restricted in all directions due to cell membranes of intermingled cell bodies and their surrounding neuraglia. Consequently DTI can be used to gain in vivo information about the anatomy, microstructure and physiology of the brain.
Keywords: Biomedical Visualization, Tensor Field Visualization, Diffusion Tensor Imaging, Brain Anatomy, Nerve Fiber Tracking
1
Introduction
Medical imaging is an essential tool for improving the diagnoses, understanding and treatment of a large variety of diseases. This paper presents techniques for obtaining in vivo information of the brain anatomy by visualizing and systematically exploring Diffusion Tensor Imaging (DTI) data. The diffusion tensor describes the spatial distribution of water molecules originating at a common location. Since the diffusion of water depends on the micro-structure of the tissue, the diffusion tensor field can be used to visualize nerve fibers and other tissues in the brain. The resulting images of the brain anatomy can be used to advance research in surgical planning, cognitive sciences, and the diagnosis and treatment of various white and gray matter disorders [Pierpaoli et al. 1996; Lim et al. ∗ e-mail:
† e-mail:
Diffusion Tensor Imaging
[email protected] [email protected]
Copyright © 2004 by the Association for Computing Machinery, Inc. Permission to make digital or hard copies of part or all of this work for personal or classroom use is granted without fee provided that copies are not made or distributed for commercial advantage and that copies bear this notice and the full citation on the first page. Copyrights for components of this work owned by others than ACM must be honored. Abstracting with credit is permitted. To copy otherwise, to republish, to post on servers, or to redistribute to lists, requires prior specific permission and/or a fee. Request permissions from Permissions Dept, ACM Inc., fax +1 (212) 869-0481 or e-mail
[email protected]. © 2004 ACM 1-58113-883-0/04/0006 $5.00
74
2.1
of hereditary mental retardation [Barnea-Goraly et al. 2003]. DTI has also been used to investigate the development of white matter tracts in adolescents and adults [Li and Noseworthy 2002]. The above examples demonstrate the importance of diffusion tensor imaging for medical diagnosis and research. It is important to note that, since the resolution of DTI is limited, small fibers adjacent to each other and branching fibers cannot be distinguished. Recent research attempts to improve the standard diffusion tensor model by using high angular resolution diffusion weighted acquisition [Ozarsland et al. 2001].
Derived Quantities
The matrix representation of a second-order tensor depends on the coordinate system used (MRI coordinates). In order to describe intrinsic tissue properties variables independent of the patient’s position must be derived. Examples are the three tensor invariants. An important property of any 3-dimensional symmetric second-order tensor T is that there always exist 3 eigenvalues λi and 3 mutually perpendicular eigenvectors vi such that Tvi = λi vi i = 1, . . . , 3
(1)
The eigenvalues and eigenvectors of the diffusion tensor D define the principal axes of a diffusion ellipsoid. To facilitate the definition of new measures it is convenient to order the three eigenvalues of the diffusion tensor D by size with λ1 being the biggest and λ3 being the smallest [Pierpaoli et al. 1996]. The maximum diffusivity is then given by λmax = λ1 . The mean diffusivity is defined as the average eigenvalue of the diffusion tensor and is efficiently computed by using the first tensor invariant
λmean =
λ1 +λ2 +λ3 trace(D) D11 +D22 +D33 = = 3 3 3
3
Diffusion tensor fields in the medical field have been originally visualized in two dimensions by representing a derived scalar measure over a data slice with a color map or a gray scale map [Pierpaoli et al. 1996]. Subsequent research has examined the visualization of directional tensor information over 2D slices via color mapping [Jones et al. 1997; Pierpaoli 1997]. Peled et al. visualize a slice of a diffusion tensor data set by indicating the in-plane component of the principal diffusion with a blue line and the out-of-plane components by colors ranging from green through yellow to red [Peled et al. 1998]. An interesting visualization of DTI slice images has been developed by Laidlaw et al. who use concepts from oil painting [Laidlaw et al. 1998]. The projection of the principal diffusion direction onto the image plane is encoded by the stroke direction and the out-of-plane component by the saturation of the red color component. Diffusion anisotropy is represented by the length/width ratio and transparency of brush strokes and the magnitude of the diffusion rate by the stroke texture frequency. Additional information is given using the lightness of the under-painting and an underlying checkerboard spacing. More recently researchers have concentrated their efforts onto the 3D reconstruction and visualization of nerve fiber tracts. Xue et al. track nerve fibers by propagating a line from the center of a voxel along the direction of the maximum eigenvector until it exits the voxel [Xue et al. 1999]. Poupon et al. [Poupon et al. 1998] track white matter fibers using a Markovian model and the assumption that fiber tracts can not end in white matter. In a later paper the authors use knowledge of the low curvature of most fascicles and track them using a bending-energy minimizing scheme [Poupon et al. 2000]. In a previous paper we showed that fiber tracts can be visualized with streamtubes and hyperstreamlines [Wu¨ nsche and Lobb 2001]. Kindlmann et al. [Kindlmann and Weinstein 1999; Kindlmann et al. 2000] visualize the 3D geometry of the diffusion tensor field using a direct volume rendering technique with the color, lighting and opacity assignment governed by the underlying tensor field. Colors are determined by transforming a constant input vector with the tensor and by using the result to index a Hue-ball which is a 2D spherical color map. The hue of the resulting color reflects the principal diffusion direction and the saturation the diffusion anisotropy. Fiber tracts show up as regions of slowly varying saturated color.
(2)
Images of λmean show all brain tissue and fluid filled compartments. Note that the computation does not require the computation of the eigenvalues but involves merely averaging the diagonal elements of the tensor matrix. Another important measure is the anisotropy of the diffusion tensor. We define it as 2 λaniso = trace((D − λmean I)2 )/λmean
= ((D − λmean I)
T
(3)
2 (D − λmean I))/λmean
which was suggested to us by Peter Basser [Basser 2000]. Note that the computation is efficient and does not require the computation of the eigenvalues. The measure is used to identify regions where λ1 >> λ2 ≥ λ3 and can be used to detect nerve fiber tracts. Additional measures have been proposed by Westin et al. [Westin et al. 1997]. The authors define a linear isotropy cl , a planar isotropy c p , and an isotropy cs as cl =
cp =
cs =
λ1 − λ 2 λ1 + λ 2 + λ 3
2(λ2 − λ3 ) λ1 + λ 2 + λ 3
3λ3 λ1 + λ 2 + λ 3
(4)
(5)
(6)
The measures fall in the range [0, 1] and sum up to 1 and define therefore a barycentric space of anisotropies.
2.2
Previous Work
Medical Applications
DTI imaging has been successfully applied to diagnose various diseases. For stroke victims it has been shown that diffusion reduces in the demarcated ischemic region within minutes whereas changes in conventional T2 weighted MRI images become apparent only after about three hours [Warach et al. 1992]. Assaf et al. report that DTI images are also sensitive to the pathophysiological state of white matter in brains diagnosed with Multiple Sclerosis [Assaf et al. 2002]. Zhang et al. note that the white matter regions adjacent to the edema surrounding a metastasis are characterized by heterogeneity in the diffusion anisotropy [Zhang et al. 2002]. Barnea-Goraly et al. show that regionally specific alterations of white matter integrity occur in patients with Fragile X Syndrome, a common form
4 4.1
Visualizations Color Mapped Surfaces
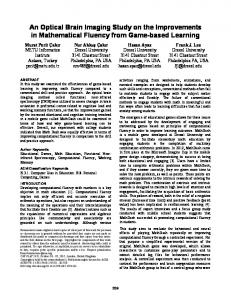
Traditionally MRI data is displayed as a set of slices parallel to one of the coordinate planes. The optimal presentation of MRI slice images for improved perception of information has been researched by [van der Heyden et al. 1998]. As a basic example for color mapping consider figure 1 which shows nine equidistant horizontal slices through the brain from top
75
Figure 2: Horizontal slice (number 20) with the mean diffusivity (a) and the diffusion anisotropy (b) visualized using cyclical color maps (right).
1 2 λs = 3 0
Figure 1: Horizontal slices (with numbers) color mapped with the diffusion anisotropy.
if λaniso ≥ 0.25 and 5∗10−6