estimates the number of computer users in businessesânot programmers, per seâand it ..... Do you do word processing or desktop publishing? 48,426 ... Textual programming languages, such as spreadsheet formula languages ... For example, one end-user might press a button on the good old VCR to record a movie; he.
The “55M End-User Programmers” Estimate Revisited Christopher Scaffidi, Mary Shaw, Brad Myers February 2005 CMU-ISRI-05-100 CMU-HCII-05-100
Institute for Software Research, International, Carnegie Mellon University Human-Computer Interaction Institute, Carnegie Mellon University School of Computer Science Carnegie Mellon University Pittsburgh, PA 15213-3890 Abstract In 1995, Boehm predicted that by 2005, there would be “55 million performers” of “end-user programming” in the United States. Examining the original context and method which generated this number reveals that it actually estimates the number of computer users in businesses—not programmers, per se—and it assumes constant computer usage rates. This paper extends Boehm’s estimate using fresh Bureau of Labor Statistics (BLS) data, including the latest BLS occupational projections (which are for 2012), and a richer estimation method. We estimate that in 2012, there will be 90 million end-users in American workplaces. Of these, we anticipate that over 55 million will use spreadsheets or databases (and therefore will be potential end-user programmers), while over 13 million will describe themselves as programmers. Thus, the potential pool of end-user programmers will probably substantially exceed the population who view themselves as programmers. Each of these estimates, in turn, substantially exceeds the latest BLS projections of fewer than 3 million professional programmers in 2012. Since not all end-users perform the same programming tasks, we surmise that the vast, heterogeneous pool of endusers likely will benefit from a diversity of tools to support their programming activities. Developing such tools efficiently requires a better characterization of what features are valued by each end-user sub-population. To that end, this paper concludes by outlining plans for future research, including creating an abstraction-focused categorization of end-users.
This work has been funded in part by the EUSES Consortium via the National Science Foundation (ITR-0325273), by the National Science Foundation under Grant CCF-0438929, by the Sloan Software Industry Center at Carnegie Mellon, and by the High Dependability Computing Program from NASA Ames cooperative agreement NCC-2-1298. Any opinions, findings, and conclusions or recommendations expressed in this material are those of the authors and do not necessarily reflect the views of the sponsors.
Keywords: end-user software engineering, end-user programming, software usage
1. Introduction 1.1 Overview As first reported in 1995 [5] and widely disseminated as part of the Construction Cost Model (COCOMO) version 2.0 [6], Boehm et al. estimate that the number of “end-user programming performers” will reach 55 million by 2005. This number originally functioned as an estimate of the number of people who would not benefit from COCOMO 2.0, thereby bounding the applicability of that proposed model. Since 1995, numerous researchers have cited this estimate when writing about programming by scientists, secretaries, engineers, salespersons, and other non-professional programmers (for example, [10] [16] [21] [23] [26] and [27]). Citing this number supports the argument that a vast reservoir of end-user needs and potentials exists and that researchers should not neglect the opportunity to serve this programmer community. Boehm’s estimation method depends on a 1989 survey by the US Bureau of Labor Statistics (BLS) that asked each respondent about personal computer usage at work. His estimate relies on the approximation that those usage rates would not change, and it makes the simplification that all end-users would eventually perform programming-like tasks. Based on these assumptions, Boehm’s estimation method multiplies these 1989 computer usage rates against BLS occupational growth projections for 2005, yielding the estimate of 55 million. Incorporating more recent BLS data allows us to relax some of Boehm’s simplifying assumptions and update the estimate. Empirically, BLS data shows the rate of computer usage significantly rose through the 1990’s [17]. Using this information, we now estimate that the end-user population at workplaces in the United States will number 90 million in 2012, compared to fewer than 3 million professional programmers. As the structure of this burgeoning population becomes clearer in this and future work, we anticipate that broad subpopulations will emerge, each with characteristic needs and capabilities. For example, while only 15% of end-users reported they “did programming” at work in 2001, 62% reported they used computers for spreadsheets or databases. Some, but not all, of these spreadsheet and database end-users utilized these tools for programming-like activities. Staking out the bounds of end-user programmer sub-populations will allow researchers to target further studies and tool-development efforts at large or interesting sub-populations, thereby helping to unlock their potential.
1.2 Paper outline Section 2 of this paper examines Boehm’s original context and estimation method more closely. Section 3 attempts to improve on the estimate by incorporating innovation diffusion theory [25] to take into account the rising rate of computer usage among American workers. Finally, section 4 outlines our proposed future work beginning with an abstraction-focused categorization of end-user programming and a survey of end-user programming practices. These initiatives will together allow the research community to speak more confidently and precisely about the nature of end-user programming currently taking place in American businesses. This better understanding should, in turn, help researchers identify opportunities that address problems specific to particular user communities.
-1-
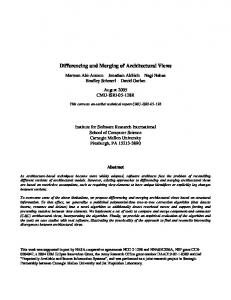
2. The “55 Million” estimate 2.1 Original context In 1995, Boehm et al. introduced COCOMO version 2.0, an extension and elaboration of the earlier COCOMO costestimation framework, in order to address various shortcomings in the earlier version [5]. Many of these shortcomings had arisen due to changes in the way professional programmers performed their trade (such as the increasing focus on producing reusable modules). To accommodate these changes, COCOMO 2.0 incorporated a variety of new variables representing cost drivers ranging from “team cohesion” to “process maturity” in an attempt to better capture the details of the professional programming environment. Many variables in each version of COCOMO do not apply to end-user programmers. These workers, who range from marketing specialists to business administrators, generally build small software. They often develop their software on their own rather than in organized teams (making the “team cohesion” variable less meaningful), and they make little attempt to apply a disciplined software development process (making the “process maturity” variable less meaningful). In the words of the original COCOMO 2.0 technical report, “The User Programming sector does not need a COCOMO 2.0 model. Its applications are typically developed in hours to days, so a simple activity-based estimate will generally be sufficient” [5]. Boehm not only recognized COCOMO 2.0’s limited applicability, but he also took pains to estimate how many future programmers would be end-users having little need for COCOMO 2.0. Through the method discussed below, he projected 55 million end-user programmers by 2005. This contrasted in his report with an estimate of fewer than 3 million professional programmers (who could make use of COCOMO 2.0) in 2005. This showed that while COCOMO 2.0 represented a great leap forward, it did not apply to a wide variety of situations, as summarized in Figure 1.
2.2 Original method This section reviews Boehm’s method in enough detail to support re-estimation with newer data. In the process, we note that that the estimate depends on the approximation that all end-users are programmers. Boehm’s original technical report [5] contains a footnote outlining the estimation method: These figures are judgement-based extensions of the Bureau of Labor Statistics moderate-growth labor distribution scenario for the year 2005 [CSTB 1993; Silvestri and Lukaseiwicz 1991]. The 55 million End-User programming figure was obtained by applying judgement based extrapolations of the 1989 Bureau of the Census data on computer usage fractions by occupation [Kominski 1991] to generate end-user programming fractions by occupation category. These were then applied to the 2005 occupation-category populations (e.g., 10% of the 25M people in “Service Occupations”; 40% of the 17M people in “Marketing and Sales Occupations)
Figure 1: The original 55 Million estimate for 2005 (taken from [5]), accompanied by estimates of four professional programmer populations
2
The starting point is Silvestri and Lukaseiwicz’s projection of the growth of the American worker population in each of nine occupational areas to 2005 [24]. They achieved this by combining a moderate-GDP-growth model of the economy (developed by BLS) with a variety of survey data (including BLS's Current Employment Statistics, Occupational Employment Statistics, and Current Population Survey). This allowed them to predict the number of people working in each occupational category in 2005 (see the second column in Table 1).
Occupational Category
Managerial and Professional
Projected Occupational Count in 2005 (in thousands) Silvestri [24] (economist) 36,773
Actual Percentage Using Computers at Work in 1989 CPS [17] (government) 56.2 %
Projected Computer Usage at Work in 2005 (in thousands) computed 20,666
Technical, Sales, Administration
48,078
55.1
26,491
Precision Production, Craft, Repair
15,909
15.3
2,434
Service
24,806
10.2
2,530
Operators, Laborers, Fabricators
17,961
9.5
1,706
3,665
4.4
161
Farming, Forestry, Fishing
Totals:
147,192
53,989
Table 1: To arrive at the “55 Million” estimate, multiply occupational projection by computer usage statistics. The next step is to estimate the rate of computer usage in the workplace. This comes from Kominski’s analysis of the 1989 Current Population Survey (CPS) of households (discussed in [17]). This survey, run by BLS, included items asking respondents whether they used a computer at work. As the survey also included items that facilitated occupational categorization, it was possible to determine what fraction of each occupation’s workers actually used a computer at work (as shown in the third column of Table 1). For example, roughly 10% of “Service Occupation” workers used a computer at work. The last step takes these 1989 usage fractions and multiplies them against the projected 2005 occupational population sizes, then adds up the results as shown in the fourth column of Table 1 below. The result thus estimates the number of end-users in 2005. In passing, we note that Figure 1 also includes four estimates concerning subcategories of professional programmers totaling a projected 2.75 million for 2005. As discussed later, this is broadly consistent with information from the government: BLS data indicate there were fewer than 3 million professional programmers in 2001, and BLS projections suggest this number will remain under 3 million in 2012.
2.3 Discussion In short, the estimation method multiplies economists’ occupational population projections for 2005 against computer usage fractions from 1989. This method depends on two approximations. The first approximation is that all end-users are practitioners of programming. Nardi defined “programming” as “behavior in which sequences of procedural instructions… are written in a language that is compiled or interpreted,” then broadened her definition to include any attempt “to create an application that serves some function” [19]. Blackwell has noted [2] that a wide variety of software and consumer products do indeed allow end-users to engage in programming-like activities, such as recording behavior or algorithms for playback later. Clearly, not all end-users perform programming activities to the same extent. For example, claiming that browsing or emailing constitutes programming requires a fairly abstract view of what programming entails. One argument
3
might be, “When you enter an email message, you are typing a series of commands and transmitting them to another machine, which then acts on those commands to decide what to display on the screen. When you browse the web, you are clicking the mouse in a way that enters commands into the computer, which faithfully executes those instructions like any Turing machine.” There is something inherently unsatisfying about this argument. Not all activities are equally programming-like. Lumping all end-users into one estimate misses an opportunity to add texture that could guide further research. This will be addressed further in Section 4. The method’s second approximation is that computer usage rates within each occupational category remain constant. Section 3 develops an improved approximation by extending the method to use data collected more recently than 1995.
3. Improving the estimate In this section, we relax Boehm’s approximation of constant computer usage rates by incorporating innovation diffusion concepts and fresh BLS data. This allows us to enhance and extend Boehm’s method forward to 2012. We compare the resulting projection with other estimates of the end-user sub-populations performing programming-like activities.
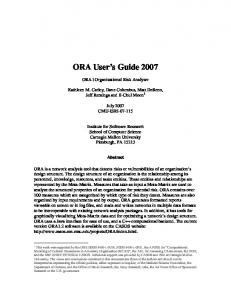
3.1 Empirically, the estimate is too low Boehm’s original estimate was derived from 1989 CPS data (plus other data). In fact, BLS worked with the Bureau of the Census to collect these same CPS computer usage items on surveys in 1984, 1989, 1993, and 1997.1 These have been tabulated to show computer usage trends for each occupational category [17], as shown in Figure 2. BLS’s data reveal that a larger fraction of workers use a computer now than in 1989. For example, technical-salesadministration-support occupational workers reported a usage rate of almost 70% in 1997, compared to only 55% in 1989. As a result, using computer usage rates from 1989 under-estimates the total number of computer users in 2005. In fact, the CPS showed that in 1997, there were already 64 million Americans who used the computer at work, substantially higher than the 55 million estimated for 2005. Computer Usage by Occupational Category 80% Managerial and Professional 70%
Technical, Sales, Administration Precision Production, Craft, Repair
60%
Operators, Laborers, Fabricators
Usage
50%
Service 40%
Farming, Forestry, Fishing
30% 20% 10% 0% 1984
1989
1993
1997
Figure 2: Computer usage grew significantly throughout the 1980’s and 1990’s.
Time
1
Unfortunately, BLS’s 2001 CPS data cannot be used to add another data point. The BLS changed the wording of the question from “Do you directly use a computer at work?” in 1997 and prior years to “Do you use a computer at your main job?” in 2001. For some occupations, the proportion of respondents reporting at-work usage appeared to increase sharply under the new question, while for others it actually appeared to decrease slightly [12]. It is unclear whether these odd effects can be attributed to wording, or to changes in the underlying phenomena. Hopefully future CPS questions will remain stable over the next few surveys so that the issue becomes clearer.
4
3.2 Extending the estimate The key to extending Boehm’s estimate method is to model the salient S-shaped curve of some occupations’ computer usage, which is particularly apparent for the lower four curves. (The top two curves resemble the right halves of S-curves, with the left halves occurring prior to the first survey in 1984.) This “logistic curve” typifies many diffusion phenomena—ranging from the propagation of a virus through a human population to the adoption of technological innovations [25]. In such situations, some phenomenon of interest (such as infection) starts out with a low level of incidence, affecting only a small fraction of the population. However, as those people interact with the population, they share the phenomenon, causing the incidence to increase until it affects virtually everybody. The rate of increase is flat to start with (since there are few people promulgating it) and is flat to end with (since the population is nearly saturated). Although there are only four CPS data points, it is interesting to fit each curve to the theoretical functional form of innovation diffusion phenomena in order to determine where the curves might be headed in the future. (More complex functions exist for certain contexts, but it makes sense to use one of the simpler but successful forms when only four data points are available. See [25] for a discussion of other possible functional forms.) The S-shaped logistic form is A(t) =
K _ (-m*t+b) 1+e
A(t) K m, b
= adoption (usage) at time t = maximum adoption = fitting parameters (related to rate of adoption, and the “zero-point” of t)
A least-squares fit of this equation for each occupation’s computer usage rates (see Appendix A for data) yields a function approximately describing how usage will develop in the future. As with Boehm’s original method, we can multiply these now-improved usage estimates against projected occupational head counts to estimate the total number of end-users in the future. Unfortunately, BLS only issues projections for one year per decade; hence, the only projection available is for the year 2012 [13]. We insert t=2012 into the fitted functions to estimate computer usage rates for 2012, and then multiply each rate against the corresponding projected head count. As shown in Table 2, this yields the estimate that approximately 90 million American workers will use a computer at work in 2012.
Occupational Category
Managerial and Professional
Projected Occupational Count in 2012 (in thousands) Hecker [13] (economist) 52,030
Projected Percentage Using Computer at Work in 2012 Fit to CPS [14] (govt data) 83.0
Projected Computer Usage at Work in 2012 (in thousands) computed 43,209
Technical, Sales, Administration
42,695
72.1
30,804
Precision Production, Craft, Repair
14,860
29.9
4,442
Service
31,905
19.1
6,098
Operators, Laborers, Fabricators
22,723
21.0
4,782
1,107
11.1
123
Farming, Forestry, Fishing
Totals:
165,320
89,459
Table 2: Applying an improved “55 Million” method to estimate the number of people who will use computers at work in 2012 yields an estimate of approximately 90 million
5
This estimate illustrates an enhanced method for use in generating estimates of end-user populations. It has removed the assumption that computer usage rates will remain constant; instead, this method assumes that computer usage rates can be modeled by a simple innovation diffusion curve. Such an assumption is somewhat suspect, in part because it presumes that the innovation under discussion (here, the computer) does not change substantively during the course of diffusion. This is, of course, not true: computers continually increase in power and utility. Hence, computer usage rates of the future are likely to exceed those indicated by the foregoing model. Therefore, 90 million should be viewed as a lower bound for the number of American end-users in workplaces in 2012, any of whom might be performing programming-like activities.
3.3 Comparison to other population estimates BLS’s 2001 CPS asked about workers' occupation and software application usage [7]. These data provide additional dimensions of insight about the degree to which workers are programming. The occupational data reveal that about 2.4 million people fell into the categories of “computer scientists and systems analysts”, “computer programmers”, or “computer software engineers” in 2001 [7]. BLS projects this number will remain under 3 million through 2012 [13]. Both of these numbers are consistent with Boehm’s projection of 2.75 professional programmers in 2005 [5]. BLS’s software usage data (summarized in Table 3) reveal that 11 million workers in general reportedly “did programming” [7], which was 15% of all end-users. Assuming that this percentage will not decline, we predict that over 13 million (15% of 90 million) American end-users will report that they program at work in 2012. Clearly, the number of people who perceive themselves as programmers substantially exceeds the number for whom programming forms their job (as determined by BLS occupational codes). Moreover, 45 million people “used spreadsheets or databases,” which was 62% of all end-users. Assuming that this percentage will not decline, we predict that over 55 million (62% of 90 million) American end-users will report that they use spreadsheets or databases at work in 2012. This dwarfs the number of professional programmers, though its significance is mitigated by the fact that not all endusers perform “programming-like” activities. For example, Hall’s study of spreadsheets created by well-educated Australian workers found that only 47% used the “if” function [12]. Also, Fisher and Rothermal’s survey of spreadsheets on the web revealed that only 44% contained any formulas at all [11]. In other words, although it is not entirely clear how well these two survey samples generalize to all spreadsheet and database end-users, perhaps around 45% of all spreadsheet and database users might be performing programming-like activities. Yet even this educated guess suggests that in 2012, around 25 million spreadsheet and database end-users could be performing programming. Question
Number of Users (thousands)
Do you use a computer at your main job?
Percent of Computer Users
72,277
(100%)
Do you connect to the Internet or use e-mail?
51,895
71.8%
Do you do word processing or desktop publishing?
48,426
67.0
Do you use spreadsheets or databases?
45,029
62.3
Do you use a calendar or do scheduling on the computer?
38,235
52.9
Do you do graphics and design?
20,816
28.8
Do you do programming?
10,986
15.2
Table 3: Summarizing CPS 2001 software application usage by workers [7]
6
To summarize, it is highly probable that the pool of end-users potentially performing programming-like practices is several times as large as both the population of professional programmers and the population of self-reported programmers. Further, projections strongly suggest that this situation will persist for the foreseeable future.
4. Studying the population’s structure The preceding discussion showed that 55 million underestimates of the number of end-users in American businesses, and the analysis extended the estimation method to suggest that they will number 90 million in 2012. It seems likely, based on the numerous citations of the “55 million” estimate, that researchers would value a set of more refined estimates of the number of end-users who engage in various forms of programming. This section lays the groundwork for developing a set of categories for programming-like activities and for estimating the number of people in each category.
4.1 Existing taxonomies of programming Over the past twenty years, authors have described programming and related concepts in various ways, for example: • •
•
•
• •
•
•
Programmers “utilize both command and procedural languages directly for their own personal information needs. They develop their own applications, some of which are used by other end-users” [22]. “Development is the performance of any or all tasks of the system development process, whether traditional systems development life cycle or prototyping. It consists of the specification of system requirements, system design, programming, and/or system implementation and conversion” [9]. “‘Program’ is defined as ‘a set of statements that can be submitted as a unit to some computer system and used to direct the behavior of that system’ [20]. While the ability to compute ‘everything’ is not required, the system must include the ability to handle conditionals and iteration, at least implicitly” [18]. “Writing high level, declarative, textual program specifications also constitutes programming, as does creating diagrammatic representations of system behavior. They demand the same basic activities and skills as conventional programming (even if the programmer is saved a considerable amount of time)… to create an application that serves some function” [19]. “Programming may be defined as a procedure specification task by means of a computer language” [15]. “End-user programming environments are quite diverse, including educational simulation builders, web authoring systems, multimedia authoring systems, e-mail filtering rules, CAD systems and… spreadsheets” [23], as well as other “special-purpose scripting languages” [27]. “Setting a video cassette recorder to tape an upcoming TV show is not programming…. Programming… is defined as the construction of a specification (sequence of instructions or program) for solving a problem by an agent other than the programmer” [8]. “In a simple programming activity such as programming a VCR, the user is defining some abstract behaviour which is not directly observable because it will take place in the future… All computer users may now be regarded as programmers” [3].
These descriptions are not entirely consistent. One possible reason is that it may be over-simplistic to label a user as a “programmer” or “non-programmer.” Instead, it may be more accurate to say that a certain activity evidences certain programming-like traits, and that therefore end-users fall along a multi-dimensional continuum of practice. One approach to identifying categories of end-users is to identify clusters of related activities. That way, researchers could simply refer to the type of end-user programming of interest in an analysis, and statistics could be developed to characterize each type.
7
Researchers have long taken steps in this direction. Nardi, for example, discusses various types of (somewhat overlapping) programming facilities [19]: • • • • •
Textual programming languages, such as spreadsheet formula languages Visual programming languages, such as LabView Forms-based systems, such as the document style editor in FrameMaker Programming by example, as in the Eager extensions to HyperCard Automatic programming from informal programming specification, as with WorldBuilder
One problem with this categorization and others like it (such as Cotterman and Kumar’s User Cube taxonomy [9]) is that it tends to focus on tools rather than concepts. For example, it classifies tools for entering spreadsheet formulas as “textual” rather than highlighting the data propagation characteristics particular to spreadsheet computations; in this respect, it glosses over potentially significant cognitive differences between the programming of spreadsheet formulas and the programming of script modules in, say, a browser environment. Moreover, categorization frameworks like Nardi’s offer little guidance for the design and enhancement of specific tools under development, such as a hypothetical end-user environment for entering textual SQL statements. For example, consider two example end-users. The first manually types SQL to design and create table structures, complete with fancy foreign key relationships and triggers. The other was emailed a SQL string by a co-worker so that he can copy and paste it into a query tool to retrieve the day’s sales statistics. Each of these uses of SQL relies on a “textual programming language” and would fit into Nardi’s first category. Yet the first person clearly utilizes more complex features of the language. The second person may not comprehend the relation aspect embodied in a table, and may not even realize that tables exist at all. It is conceivable that the first user does not understand these concepts, either, but that seems somewhat unlikely given such heavy usage of advanced programming-like features. In other words, end-users can be categorized, as Nardi does, solely on the basis of software usage. Categorizing further by feature usage reveals another layer of structure within the end-user population. Moreover, categorizing even further based on end-users’ understanding and intention reveals a third layer of structure within this population. Each of these layers provides additional insight into what programming-related features become widely used and why. This deeper understanding of end-users practices, in turn, may help to guide research aimed at improving enduser programming tools.
4.2 Seeking abstraction-focused categorization Blackwell suggests that a fruitful line of analysis would be to consider the abstractions that a hardware or software system allows its users to create [2] [3]. Here, “abstraction” involves separating one aspect from another so that each can vary independently. Programmers do it all the time. Only some end-users do it. And not all end-user programming environments support the use of all types of abstraction. Considering abstractions assists in making the term “programming” more precise, as demonstrated by the examples below. (Blackwell described the first example in [3], and we have added the other three.) •
•
The simplest level of abstraction involves simply recording actions so they can be replayed later in exactly the same way. For example, one end-user might press a button on the good old VCR to record a movie; he is implicitly doing two things: selecting something to record and initiating the recording. Another end-user might “program” the VCR to record at a point in the future. Blackwell refers to this as “abstraction over time” [3] because the user has separated the algorithm’s instructions (for recording) from the time that those instructions will be executed. Webmasters could copy-and-paste content (such as a navigation bar) from an old page into a new page. This requires little skill. In contrast, another webmaster might put the navigation bar into a separate file, and then use “server-side includes” to incorporate it into multiple pages. She has abstracted the navigation bar’s content itself from the references of that content.
8
•
•
If an end-user creates a spreadsheet, he can use the cells simply as boxes to store numbers. If he needs to do calculations, he can do them manually and then enter the results into other boxes. In contrast, another end-user might encode the calculations into formulas. She might then reuse the file with different inputs later on. In essence, she has abstracted the algorithm away from the data. One end-user might need to diagram the parts in his car. He could fire up Microsoft Visio and use lines to draw out boxes and other interesting polygons depicting various concepts such as “spark plug” and “belt.” He is engaging in a straightforward WYSIWYG mode of creating diagrams. Another user might make use of Visio’s extensibility and define new shapes (from primitives) to represent spark plugs and belts; she might even define custom property editors with slots for entering “spark plug voltage” (a floating point number) and constraints that control other attributes of these entities, such as the form factor of spark plugs. Drawing her diagram, and future similar diagrams, would involve instantiating these custom shapes and filling in the relevant property sheets. She has created a whole ontology, essentially abstracting the data structures (and their graphical depictions) from the actual data.
Blackwell has argued that from a cognitive standpoint, usage of abstractions like these is a hallmark trait of “programming” [2] [3]. That is, creating numerous and diverse abstractions is a sufficient condition for meriting the label “programmer.” This argument seems consistent with most of the aforementioned definitions of “programming,” which focus on representing a plan in code, since defining an abstraction (as in the examples above) appears to involve conceptualizing a generalized plan and then representing it in a form the computer comprehends. Therefore, one line of research may be to identify the types of abstraction that widely occur in software, and then to attempt organizing them into a semi-hierarchical categorization. For each type abstraction, it would be feasible to identify a list of software features which support the usage of that abstraction, then survey what percentage of people use each feature and abstraction. Note that these abstractions are supported differently in various environments. For example, abstracting a data structure (the fourth bullet above) involves defining a class in object-oriented programming, involves defining a table in SQL/database programming, and involves defining prototype objects in ActionScript/Flash. In all three cases, the programmer is using a feature of the language (classes, tables, or prototypes) to represent an abstraction over items that share the same data structure. The type of abstraction (data structure) is the same in each case, but the feature through which that abstraction is supported varies from environment to environment. In practice, a given environment may support the usage of some abstractions but not all. Likewise, an end user may be a “programmer” in some respects but not all. Insisting on a binary categorization of “end-user programmer” versus “end-user non-programmer” gets in the way of characterizing the population of end-user programmers. Instead, the research community could look to establish an estimate of the numbers of end-user programmers of certain types, and then delve into those types further to identify their needs.
4.3 Characterizing the sub-populations Our next step will be to field a survey inspired by the BLS’s CPS items, which indicated how many users used tools like browsers, word processors, spreadsheet software, and so forth. Enhancing this to account for feature usage (in addition to software usage) will facilitate segmenting the population into smaller subgroups, according to what abstractions they appear to be using. Of course, it may be complained that an abstraction user may not understand the abstraction itself, or even be aware of the nitty-gritty details deep beneath the feature’s surface. This would not be surprising, since even professional programmers exhibit varying levels of understanding about the deeper details of a computer’s operation as it executes code, and we anticipate a similar pattern among end-user programmers. Consequently, sub-categorizing end-user programmers not merely according to abstraction usage but also according to abstraction understanding may offer additional insight into the capabilities and needs of end-user programmers.
9
We have tentatively identified Bloom’s taxonomy [4] of levels of understanding as a potentially useful framework for classifying users of various abstractions.2 Hence, our succeeding step will be to interview some of the subgroups formed from the survey data in order to characterize the knowledge and objectives present within each subgroup. These targeted studies will examine how the end-users think about their problems (which could, conceivably, vary by occupational type), what computational strategies they employ to solve those problems, and how the tools could be enhanced to further those aims. It may turn out that although 90 million American workers will be using computers at work in 2012, only a fraction of them understand a certain abstraction and use it to program. The question would then become, are so few endusers doing this because it is too hard or because it is not useful for their work, or some other reason? Interviews, case studies, or contextual inquiries [1] will likely prove valuable in uncovering the answers and providing guidance for future development of tools and techniques to help end-users achieve their programming goals.
4.4 Closing This report has extended the “55 million” estimation method to account for rising computer usage rates. We estimate that 90 million American workers will use computers in 2012, significantly exceeding the 3 million anticipated professional programmers. We project that in 2012, over 13 million American workers will “do programming” in a self-reporting sense, but based on spreadsheet and database usage, it seems likely that the number of end-user programmers will be much higher. We have laid out the beginnings of a framework which we will use for conducting abstraction-focused studies to better characterize the end-user programmer population. Together, improved estimates and more precise characterizations of end-user practices will help researchers to target further work in developing tools to assist endusers in programming tasks.
5. Acknowledgements This work has been funded in part by the EUSES Consortium via the National Science Foundation (ITR-0325273), by the National Science Foundation under Grant CCF-0438929, by the Sloan Software Industry Center at Carnegie Mellon, and by the High Dependability Computing Program from NASA Ames cooperative agreement NCC-2-1298. Any opinions, findings, and conclusions or recommendations expressed in this material are those of the authors and do not necessarily reflect the views of the sponsors. We also gratefully acknowledge helpful critical input from Margaret Burnett and Sebastian Elbaum, as well as the software seminar group at Carnegie Mellon University.
2
Bloom and other educators produced this taxonomy to help teachers tailor curricula to their students’ needs [4]:
• • • • • •
Knowledge—“Knowledge as defined here includes those behaviors and test situations which emphasize the remembering, either by recognition or recall, of ideas, material, or phenomena.” Comprehension—“Here we are using the term “comprehension” to include those objectives, behaviors, or responses which represent an understanding of the literal message contained in a communication.” Application—“Given a problem new to the student, he will apply the appropriate abstraction without having to be prompted as to which abstraction is correct or without having to be shown how to use it in that situation.” Analysis—“Analysis emphasizes the breakdown of the material into its constituent parts and detection of the relationships of the parts and of the way they are organized.” Synthesis—“Synthesis is here defined as the putting together of elements and parts so as to form a whole.” Evaluation—“Evaluation is defined as the making of judgments about the value, for some purpose, of ideas, works, solutions, methods, material, etc.”
10
6. References [1]
H. Beyer and K. Holtzblatt. Contextual Design: Defining Customer-Centered Systems, Morgan Kaufmann Publishers Inc., 1998.
[2]
A. Blackwell, R. Hewson, and T. Green. Product Design To Support User Abstractions. Handbook of Cognitive Task Design (E. Hollnagel, ed), Lawrence Erlbaum Associates, 2003, pp. 525-545.
[3]
A. Blackwell. What is Programming? 14th Workshop of the Psychology of Programming Interest Group, Brunel University, June 2002, pp. 204-218.
[4]
Bloom, B., Mesia, B., and Krathwohl, D. Taxonomy of Educational Objectives. David McKay Publishers, New York, NY, 1964.
[5]
B. Boehm et al. Cost Models for Future Software Life Cycle Processes: COCOMO 2.0. Annals of Software Engineering Special Volume on Software Process and Product Measurement (J. Arthur and S Henry, eds), J.C. Baltzer AG, Science Publishers, Amsterdam, The Netherlands, 1995.
[6]
B. Boehm et al. Software Cost Estimation with COCOMO II, Prentice-Hall, 2000.
[7]
Bureau of Labor Statistics. Current Population Survey (CPS) Computer Ownership/Internet Usage Supplement, 2001. http://www.bls.census.gov/cps/computer/2001/sdata.htm
[8]
Computer Science and Telecommunications Board. Being Fluent with Information Technology, National Research Council, 1999.
[9]
W. Cotterman and K. Kumar. User Cube: A Taxonomy of End Users. Communications of ACM, Vol. 32, No. 11, 1989, pp. 1313-1320.
[10]
M. Erwig. Update your Program? Program Your Update! Technical Report TR02-60-01, Department of Computer Science, Oregon State University, 2002.
[11]
M. Fisher II and G. Rothermel. The EUSES Spreadsheet Corpus: A Shared Resource for Supporting Experimentation with Spreadsheet Dependability Mechanisms. Technical Report #04-12-03, University of Nebraska--Lincoln, December 2004. http://cse.unl.edu/~mfisher/corpus/
[12]
J. Hall. A Risk and Control-Oriented Study of the Practices of Spreadsheet Application Developers. Proceedings of the Twenty-Ninth Hawaii International Conference on System Sciences, IEEE, 1996, pp. 364-373.
[13]
D. Hecker. Occupational Employment Projections to 2012. Monthly Labor Review, Vol. 127, No. 2, 2004, pp. 80-105.
[14]
S. Hipple and K. Kosanovich. Computer and Internet Use at Work in 2001. Monthly Labor Review, Vol. 126, No. 2, February 2003, pp. 26-35.
[15]
J.-M. Hoc and A. Nguyen-Xuan. Language Semantics, Mental Models and Analogy. Psychology of Programming, Academic Press, 1990, pp. 139–156.
[16]
S. Jones, A. Blackwell, and M. Burnett. A User-Centred Approach To Functions in Excel. Proceedings of the Eighth ACM SIGPLAN International Conference on Functional Programming, ACM Press, 2003, pp. 165-176.
[17]
R. Kominski and E. Newburger, Population Division, U.S. Census Bureau. Access Denied: Changes in Computer Ownership and Use: 1984-1997. Presented At the Annual Meeting of the American Sociological Association, August 1999 http://www.census.gov/population/socdemo/computer/confpap99.pdf
[18]
B. Myers. Visual Programming, Programming By Example, and Program Visualization: A Taxonomy. CHI '86: Proceedings of the SIGCHI Conference on Human Factors in Computing Systems, ACM Press, 1986, pp. 59-66.
[19]
Nardi, B, A Small Matter of Programming, MIT Press, Cambridge, MA, 1993.
[20]
Dictionary of Computing. Oxford University Press, 1983.
[21]
F. Paternò. From Model-based to Natural Development. Proceedings HCI International 2003, Universal Access in HCI, pp.592-596.
[22]
J. Rockart and L. Flannery. The Management of End User Computing. Communications of ACM, Vol. 26, No. 10, 1983, pp. 776-784.
[23]
J. Ruthruff, E. Creswick, M. Burnett, C. Cook, S. Prabhakararao, M. Fisher II, and M. Main. Debugging and Finding Faults: End-User Software Visualizations for Fault Localization. Proceedings of the 2003 ACM Symposium on Software Visualization, June 2003.
[24]
G. Silvestri and J. Lukasiewicz. Occupational Employment Projections. Monthly Labor Review, Vol. 114, No. 11, November 1991. http://www.bls.gov/opub/mlr/1991/11/art5exc.htm
[25]
J. Teng, V. Grover, and W. Güttler. Information Technology Innovations: General Diffusion Patterns and Its
11
Relationships To Innovation Characteristics. Transactions on Engineering Management, Vol. 49, No. 1, February 2002, pp. 13-27. [26]
C. Wallace, C. Cook, J. Summet, and M. Burnett. Assertions in End-User Software Engineering: A Think-Aloud Study. Proceedings of the IEEE 2002 Symposia on Human Centric Computing Languages and Environments (HCC'02), IEEE Computer Society, 2002, pp. 63.
[27]
A. Wilson, M. Burnett, L. Beckwith, O. Granatir, L. Casburn, C. Cook, M. Durham, and G. Rothermel. Harnessing Curiosity To Increase Correctness in End-User Programming. Proceedings of the Conference on Human Factors in Computing Systems, ACM Press, 2003, pp. 305-312.
12
Appendix A This appendix summarizes the key data sources used in this technical report and addresses the categorization issues to be addressed when linking data sources with one another.
Data sources In 1991, the Bureau of Labor Statistics (BLS) published projections of occupational growth patterns to 2005. These were summarized in [24] using the table shown below.
In 1999, BLS presented a summary of computer usage to a conference. This summary covered CPS data collected in 1984, 1989, 1993, and 1997, as summarized in the following table taken from [17] (irrelevant portions have been excised). The proportion using computers clearly grew throughout the covered period.
13
Finally, in 2004, BLS published projections of occupational growth patterns to 2012. These were summarized in [13] using the tables shown below (irrelevant portions have been excised); the lower table represents a partial “drilldown” of occupations in the “Professional and related occupations” line within the upper table.
Additional CPS data may be downloaded from BLS servers via the free DataFerrett utility available at http://dataferrett.census.gov/TheDataWeb/index.html.
Linkage issues The main challenge involved in linking data sources is to establish a uniform categorization scheme for occupations. For example, the first table shown in this appendix (the one published in 1991) organizes occupations into 9 categories; the second table (published in 1999) organizes occupations into 6 categories; the third table (published in 2004) organizes occupations into 10 categories.
14
The key to understanding the relationship among these tables and other BLS data is the concept of a “standard occupation code” (SOC). Each worker is assigned a six-digit SOC to identify his main job. For example, 15-1031 represents “Computer software engineers, applications.” These SOCs are grouped into categories during analysis. It seems that the 6-category scheme is fairly common among BLS publications, though some of the categories may be broken down into pieces to highlight particular sub-categories of occupations. The main sources of help for putting the sub-category pieces back together into 6 top-level categories are http://www.bls.gov/soc/soc_majo.htm, http://factfinder.census.gov/metadoc/occupation.pdf, and http://www.psc.isr.umich.edu/census2000/faq.html. Coalescing the information from those documents yields the occupational categorization tree below, which served as a guide when we linked data sources. Rows with a gray background show the 6 top-level categories, while others show sub-categories. Note that not all codes are used (for example, there are no 14-#### codes). 2000 SOCs
Category Label
Also known as
11-0000 through 29-0000
Management, professional and related occupations
11-0000 and 13-0000
Management, business and financial operations occupations
Executive, administrative, and managerial
15-0000 through 29-0000
Professional and related occupations
Professional specialty
15-1021
Computer Programmers
15-1030
Computer Software Engineers
15-10XX
Computer Scientists and Systems Analysts
15-1011
Computer and information scientists, research
15-1051
Computer Systems Analysts
15-1099
All other computer specialists
Other 15-0000 through 29-0000
[This is an odd sub-category, where the government has expressly defined the symbol “15-10XX” to cover only the 3 SOCs shown .]
Other professional and related occupations
31-0000 through 39-0000
Service occupations
41-0000 and 43-0000
Sales and office occupations
Tech., Sales, Admin
41-0000
Sales and related occupations
Marketing and sales
43-0000
Office and administrative support occupations
[43-0000 appears to include Technicians and related support]
45-0000
Farming, fishing, and forestry occupations
Agricultural, forestry, fishing, and related occupations
47-0000 and 49-0000
Construction, extraction and maintenance occupations
Precision production, craft, and repair
47-0000
Construction and extraction occupations
49-0000
Installation, maintenance, and repair occupations
51-0000 and 53-0000
Production, transportation and material moving occupations
51-0000
Production occupations
53-0000
Transportation and material moving occupations
15
Operators, fabricators, and laborers