The ASDMCon project: The challenge of detecting defects on construction sites Kui Yue∗ Daniel Huber† Burcu Akinci‡ Ramesh Krishnamurti§ Carnegie Mellon University Pittsburgh, PA 15213
Abstract Techniques for three dimensional (3D) imaging and analysis of as-built conditions of buildings are gaining acceptance in the Architecture, Engineering, and Construction (AEC) community. Early detection of defects on construction sites is one domain where these techniques have the potential to revolutionize an industry, since construction defects can consume a significant portion of a project’s budget. The ASDMCon project is developing methods to aid site managers in detecting and managing construction defects using 3D imaging and other advanced sensor technologies. This paper presents an overview of the project, its 4D visualization environment, and the 3D segmentation and recognition strategies that are being employed to automate defect detection.
1
Introduction
Defects occurring during the construction process are costly and preventable mistakes. Research has shown that rework of defective components identified either late in the construction process or during building maintenance accounts for approximately 15% of the total construction costs [5, 20]. Detecting these defects in a timely manner has the potential for enormous cost and time savings for a construction project. Existing quality-control mechanisms for defect detection are inadequate. The requirements for building components are detailed and complex, and manually verifying every requirement for every component is not practical. Furthermore, inspections may occur too infrequently to identify a defective component immediately after it is constructed. The philosophy of the ASDMCon (Advanced Sensor-Based Defect Management at Construction Sites) project is to detect defects as they occur by performing frequent, complete, and accurate assessments of the actual (as-built) condition of a facility throughout the construction process. Advanced sensor technolo∗ kyue.andrew.cmu.edu,
Department of Architecture Robotics Institute ‡
[email protected], Department of Civil and Environmental Engineering §
[email protected], Department of Architecture †
[email protected],
Figure 1: The integrated project model and the cyclical processing pipeline used in the ASDMCon framework (reproduced from [1]).
gies, including 3D imagers (i.e., laser scanners) and embedded sensors are key to this assessment process. Laser scanners provide the capability to accurately model the geometric aspects of the facility, while embedded sensors monitor non-geometric aspects, such as concrete strength. This information is combined with the design model, an ontology of specifications, and the project schedule to create an integrated project model, which is dynamically updated throughout the construction period (Figure 1). One of the key challenges for this project is to provide an efficient and user-friendly interface for viewing and interacting with four dimensional data (3D spatial + time). The actual process of detecting and managing defects is a second challenge. In this paper, we present an overview of the ASDMCon project and its integrated project model framework, the 4D visualization environment that we have developed, and segmentation and object recognition strategies for detecting defects.
2
Related work
Over the past few years, a number of research teams have been using 3D scanners to improve traditional techniques used at construction sites. Some notable projects include creating scaled models of buildings by integrating scans with rapid prototyping in contrast to traditional manual survey techniques [11], construction progress monitoring by documenting a construction site and comparing the scanned images with the original construction schedule [21], realtime assessment and documentation of a construction process in terms of 3D as-built models [8], and ceiling plumbing system documentation for later review and building management [19]. Most of these works simply use the raw data from laser scanners and do not perform any high-level reasoning about the scanned data. In the 3D computer vision community, there is a large body of relevant literature, ranging from modeling-fromreality to object recognition. Campbell and Flynn’s survey offers a good overview or modeling and recognition methods [6]. In the modeling-from-reality arena, researchers have developed systems for constructing geometrically accurate 3D models of various objects, such as statues [17], heritage sites [18], and underground mines [13]. Allen and Stamos developed a system for modeling building exteriors [22, 2]. El-Hakim combined data from images, range sensors, CAD models, existing maps, survey data, and GPS to create geometrically correct and complete 3D models of complex environments [9]. An earlier system by the same group modeled indoor environments [10]. While there is much research on 3D object recognition in general, here we focus on methods for recognizing building components. Johnson and Hebert used spin-images to recognize objects, such as pipes and valves, in an industrial setting with clutter and occlusion[15, 14]. Vosselman et al. studied techniques to recognize structures for industry, urban planning, etc., using a combination of airborne and terrestrial laser scanners [25]. Cantzler et al. extracted planes from building models and recognized components such as walls, floors, and roofs using a knowledge-based architectural model [7].
3
ASDMCon project overview
The ASDMCon framework envisions a continuous cycle of activities that utilize and build upon a shared representation of the full lifetime of a construction project, the integrated project model (Figure 1). The process can be divided into four broad tasks: 1) Acquiring and updating the design and schedule information; 2) Inspection planning; 3) Collecting as-built information; and 4) Identifying and managing defects. The cycle begins with a model of the build-
ing’s design (design model), which is typically in a CAD format, and a schedule of construction tasks. The design model must be transformed and integrated with the schedule to match each building component with the activity on the schedule during which that component will be built or installed. Next, inspection goals are identified based on the current point in the project schedule, the components that have been built since the last inspection, and an ontology of construction specifications. Given a set of inspection goals, planning algorithms determine the type of sensor (3D or embedded) to use and the placement of the sensors. For the 3D sensors, the goal is to determine the optimal locations to place the laser scanner in order to collect the required data at the right level of detail and correspondingly visualize the components to be inspected at the appropriate resolution, taking into account sensor-dependent issues, such as field of view, angular resolution, and noise characteristics. For embedded sensors, the goal is to optimize the location of the sensors and minimize the number of sensors required, while ensuring that quality monitoring requirements are met. The third step is to analyze the as-built data, which involves registering the scans with one another and with the design model, segmenting the as-built model into components and associating them with their corresponding components in the design model, and identifying deviations between the as-built and design models. Finally, the deviations are compared against the construction specifications to determine whether they are, in fact, defects. Each of these tasks presents significant research challenges individually. This paper focuses on the visualization environment that we use to interact with the overall framework and on the third task – analyzing and processing the as-built data. Details of the other tasks can be found in [1].
4
Four dimensional visualization
The visualization environment allows user interaction and analysis of the integrated project model. It incorporates functionalities for viewing the major components of the project model (as-built model, as-designed-model, etc.), for manual analysis of potential defects (e.g., deviation measurement), and for defect management. Furthermore, the visualization environment provides a central interface for accessing and controlling the different tasks in the processing cycle. In this section, we enumerate some of the limitations of commercial software for the purpose of construction site inspection, and we describe our visualization software and the challenges involved.
4.1
Commercial modeling software
Existing commercial software supports many of the functionalities needed for defect detection. For example Poly-
and analyze data at any point along the time-line specified by the construction schedule. Finally, it provides an interface to control and communicate with other modules of the ASDMCon framework, namely the defect specification system, the deviation detection algorithms, the defect verification system, and the construction schedule. The Viz software uses four primary types of time-dependent data: the design model, the as-built models, the embedded sensors, and the detected defects. Figure 2 shows the software’s main interface window. It consists of a 3D viewer for displaying and interacting with the 4D models, and a set of timeline sliders, one for each class of data, by which the user can control the point in time that is visualized. The sliders can be synchronized to display the status of the site at a particular moment in time. However, it frequently occurs that some components are installed earlier or later than specified in the schedule. To accommodate this situation, it is possible to adjust the sliders independently as well. Figure 2: The main window of the Viz software shows the 3D viewing and analysis window and the timeline sliders used for shuttling back and forth through time.
works [28] has modules for creating as-built models and for comparing those models to a design model. However, several challenges make the existing software packages unsuitable for the task of defect detection in the ASDMCon framework. First, most commercial software is specialized for modeling manufactured parts. The 3D navigation interfaces do not support, for example, flying inside a multistory building to inspect a column on the first level. The sheer quantity of data presents another problem. While some software packages are capable of handling millions of data points produced by today’s laser scanners, they frequently cannot handle dozens of scans needed to inspect a construction site and none can handle hundreds or thousands of scans that will be acquired over the lifetime of the construction project. Perhaps the most important limitation of commercial software is the lack of support for the dimension of time, which is central to the ASDMCon framework. Further details can be found in [12].
4.2
The 4D visualization environment
Given the limitations of commercial software to meet the ASDMCon requirements, we developed a custom visualization environment, which we call Viz, using OpenGL (Figure 2). The Viz software serves as the primary representation of the integrated project model and maintains representations of the design model, the as-built models, embedded sensors, and potential defects that have been identified. Second, it acts as a browser for users to retrieve, view,
4.3
The design model
The design model consists of a set of building components, such as walls, columns, etc., each of which contains a description of the component’s 3D geometry, object identification and classification attributes, and time stamps indicating when that component will be constructed or installed (and, optionally, when it will be removed if it is a temporary structure, such as formwork). Adjusting the timeline slider for the design model controls which components are displayed and how they are displayed. Only those components that are constructed on or before the listed time will be shown, and those that are currently under construction will be highlighted. The 3D geometry and other attributes are provided by a CAD building modeling system (e.g., Archicad [27]. The construction industry is gradually embracing the idea of designing buildings using such software rather than the traditional method of using blueprints. The seemingly simple task of translating the design model from the CAD environment into the Viz software is surprisingly challenging. The primary cause of the difficulty is the high complexity of the building environment and of the corresponding object oriented building component standard, known as IFC (Industry Foundation Classes). Currently, the IFC implementation of the different software companies is limited, leading to reliability issues in the data created from CAD models. Our interim solution is to use a combination of IFC format (for the non-geometric attributes) and VRML for 3D geometry. The corresponding components from each source must be manually associated due to further limitations of the existing commercial software. Fortunately, this task can be semi-automated through the use of boundingbox constraints, and it only needs to be performed once for each component in the design model. If the design model
Figure 3: The design model editor window, showing how components are associated with construction activities. is modified during the construction project, due to acceptable defect, for example, only the new or modified components need to be re-associated. A component’s time stamp information is provided by the construction schedule. This information controls when and how to display the associated component at different points along the timeline. Since there is no existing standard to specify which components in a design model are associated with which activity, we use a similar association technique to assign components to activities. The user simply selects the components in a 3D window to make the assignment (Figure 3). We anticipate that these types of limitations will be eliminated once the integrated project model concept gains sufficient acceptance in the AEC industry.
4.4
The as-built models
The as-built data is provided by laser scanners. In our case studies, we have used a Z+F LARA 25200 [30], and a custom-built scanner consisting of two SICK laser line scanners mounted on pan/tilt mechanisms. Based on the measurement objectives, planning software indicates the position from which the scans should be obtained. Depending on the complexity of the site, we either use in-house automatic registration software or commercial software (e.g., Polyworks [28], Geomagic [26]) to register the scans with one another and with the design model (Figure 4). Our eventual goal is to fully automate this process, but current techniques are not able to handle the challenges of a multiroom building. This problem is the subject of ongoing research in our group. Typically, a scanning session consists of 30 or fewer scans of a facility obtained over the course of a couple of hours. Since scanning is performed after con-
Figure 4: Top: As-built model for one case study color coded by elevation; bottom: The co-registered design and as-built models. struction activity stops for the day, modeling changing conditions within a single scanning session is not necessary. A site will be scanned at strategic points in time in order to maximize the number of components that can be inspected with the minimal intrusion into the normal construction activities. In the Viz software, adjusting the timeline slider for the as-built model will switch between different scanning sessions Although the data for our current case studies has been sufficiently small that the as-built models can be loaded into memory, it is clear that new strategies, such as varying levels of detail, caching, and predictive pre-fetching of data are needed to handle very large 3D data sets.
4.5
Embedded sensors
Sensors are embedded in the built environment to monitor the performance of components and materials. The data produced by these sensors can be compared against specifications to detect defects. For example, thermal sensors embedded in concrete can be used to identify structural weak-
ness through the analysis of the temperature profile. The Viz software provides a visual interface for monitoring and analyzing these embedded sensors. The location of each sensor on the design model is indicated by a small sphere. The data collected by a sensor, as well as any analysis of the data, can be accessed by selecting the sensor in the 3D window or through a list of active sensors. Adjusting the timeline slider for sensors controls which sensors are displayed – a sensor will only appear after it and the component that it is embedded within have been installed.
4.6
Deviation analysis
We have developed several tools to aid in analysis of the design and as-built models for geometric deviations that are potential defects, including special-purpose display controls, a tool for measuring distances and angles between various design and as-built components, and a tool for colorcoding the as-built model based on the level of deviation from the design model. As previously noted, commercial software is not well-suited for navigating within the enclosed confines of a multi-story construction site. We use several techniques to address this problem. First, the design model can be viewed in wire-frame mode, which allows the as-built point clouds and embedded sensors to be seen more easily. Second, the near and far clipping planes of the virtual camera can be dynamically adjusted by the user. This allows the user to see through the walls, effectively clipping away the obscuring components of the design model. A third technique that we use is an interest region selection tool. A user can specify a 3D region of the site and view only the as-built data, design components, and other structures that fall within that region. This capability allows the user to focus in on a specific structure for detailed analysis. The measurement tool allows a user to measure distances and angles between design components, points on the asbuilt model, or any combination of the two. Depending on the measurement goal, different types of measurements are needed. For example, to measure the plumbness of a column, the angle between two planes must be computed. The measurement tool supports this and a number of other categories of measurement, including point-to-point distance, point-to-plane distance, and line-to-plane angle. Finally, the deviation coloring tool color-codes points in the as-built model according to their distance to the design model components. This enables quick location of potential deviations over a large area (Figure 5).
4.7
Defect management
Once a deviation is identified, a separate sub-system brings up the relevant construction specifications for the given measurement goal [4]. If the deviation is outside of the al-
Figure 5: Illustration of the deviation coloring tool and analysis of a pillar.
Figure 6: Defect management and editing. lowable tolerance, then it is flagged as a defect. Defects constitute the fourth type of data represented by the Viz software. The defect management system tracks the status of each defect and marks the location of the defect and its associated building components in the 3D window (Figure 6). Once a defect has been identified, an operator has several choices as to how to handle it. The defect can require rework to correct the problem, it can lead to a modification of the design model to incorporate the deviation, or it can be determined to be benign, in which case it can be ignored in future scanning sessions.
5
Automating defect detection
The long-term goal of the ASDMCon project is to enable fully automatic quality assurance inspections of construction sites. This goal requires high-level understanding of the as-built models to support automated detection of defects. An obvious approach is to use 3D object recogni-
tion algorithms to identify building components (e.g., [15]). Object recognition is challenging in a construction environment for several reasons. Most 3D object recognition algorithms can only handle rigid 3D objects for which a precise 3D model is already known. Objects on construction sites are highly variable in shape and size, and for many components, 3D models are unknown or are only an approximation of the true shape. Further complicating matters is the unusually high amount of clutter that is present in active construction sites, which includes scaffolding, material storage, formwork, and other temporary structures. Our approach takes advantage of the availability of a co-registered design model. In order to automatically detect defects in as-built data, we need to determine which data points in the as-built model correspond to a given component in the design model, verify that the correct as-built points have been identified, and then determine the type measurement to be made and the location where the measurement should be taken. For example, to check the plumbness of a column, we must first identify the as-built data that corresponds to that column, verify that the data is in fact the target column, and then measure the angle between the column’s side and the floor or the horizontal reference plane for the site. This process can be implemented in three steps: segmentation, verification, and measurement.
5.1
As-built segmentation
Given a co-registered design model, segmenting the as-built data is straightforward. Points in the as-built model are associated with the closest component from the design model. Outlier points further than a given threshold from any design model component are considered to be clutter. This approach assumes that the deviations are not too large. Such small deviations are the most common case in construction projects, so it is reasonable to focus on this situation first. Larger deviations can be handled manually or as a secondary processing step, which would be more challenging. Tests conducted on data from our case studies suggest that this approach works well. Figure 7 shows a typical example. The points corresponding to the building components are successfully isolated from clutter objects, such as ladders, scaffolding, and building materials.
5.2
Object verification
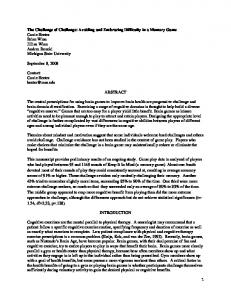
Once a set of points from the as-built model is associated with a component from the design model, we must verify that the points have roughly the same shape as the designed component and eliminate any residual clutter points that could corrupt the measurement. We use two methods for object verification: object recognition and reverse engineering. The object recognition method works well when
Figure 7: Example of as-built segmentation. Top: registered as-built data; center: a segmented wall component; bottom: points identified as clutter.
a precise model of the design component is available. We use a modified version of the MeshToolbox, which is publicly available object recognition software [29], to find the relative pose between the design model component and the associated as-built data. Figure 8 shows an example recognition result for a building column. The reverse engineering approach is appropriate for objects with simple geometries, such as walls, rectangular columns, and pillars. The pose of these components can be determined by fitting parametric geometric primitives (e.g., planes, boxes, and cylinders) to the associated as-built data. In our current implementation, we use commercial software [28] for this task, but algorithms for automated parametric fitting are available [3].
Figure 8: Example of recognition of a column. Left: column design model; center: segmented as-built data; right: registered design model and as-built data.
5.3
Deviation measurement
Once the relative pose between a design component and the corresponding as-built component is known, then deviation measurements are straightforward. In many cases, the appropriate measurement can be extracted directly from the pose information. For example, to determine whether a column is offset from its intended position, the translation component of the relative pose can be examined.
6
Future work
Our focus going forward is on expanding and improving the algorithms for defect detection automation. Specifically, we are working on two problems: exploiting domain knowledge using shape rules and modeling uncertainty and sensor artifacts. The large amount of clutter on construction sites often prevents full visualization of the components that need to be inspected. Yet it is impractical to remove all these objects during scanning. One approach is to use domain knowledge to make inferences about the obscured data. For example, if the bottom of a column is occluded by construction material, we can then simply extend the upper geometry to the ground, since columns sit on slabs (Figure 9). Similarly, if one side of a door is covered, we can use the geometry on the other side, since doors are generally symmetric. Domain-specific knowledge can be concisely described by shape rules [23], which define the relationship between spatial entities, in our case, construction components. Algorithms for manipulating shapes and shape rules are given in [16, 24].
Figure 9: Examples of domain specific shape rules. As-built model accuracy is another issue that we are studying. Current modeling-from-reality methods (commercial or research systems) do not support a consistent or complete framework for determining model uncertainties. This limitation presents a problem, since without an estimate of the accuracy of the as-built model, it is not clear whether a deviation is a true defect or just an error in the registration of the as-built data. Additionally, various data artifacts, such as the mixed-pixel effect, specular reflections, and color-dependent biases can further reduce as-built accuracy. We are developing methods to model these effects and incorporate them into our modeling-from-reality pipeline.
Acknowledgments This research was supported by NSF grant CMS-0121549. The authors wish to thank several people who have contributed to this research, including Chris Gordon, Frank Boukamp, Kuhn Park, Giancarlo Dozzi, Michael Ho, SungJoo Lim, and Alexander Mordkovich.
References [1] B. Akinci, F. Boukamp, C. Gordon, D. Huber, C. Lyons, and K. Park. A formalism for utilization of sensor systems
[2]
[3]
[4]
[5]
[6]
[7]
[8]
[9]
[10]
[11]
[12]
[13]
[14]
[15]
[16]
[17]
and integrated project models for active construction quality control. Automation in Construction, 15(2):124–138, Feb. 2006. P. K. Allen, I. Stamos, A. Troccoli, B. Smith, M. Leordeanu, and S. Murray. New methods for digital modeling of historic sites. IEEE Computer Graphics and Applications (CG&A), 23(6):32–41, Nov/Dec 2003. P. Benko, R. R. Martin, , and T. Varady. Algorithms for reverse engineering boundary representation models. Computer Aided Design, 33(11):839–851, 2001. F. Boukamp and B. Akinci. Automated reasoning about construction specifications to support inspection and quality control. Automation in Construction. to appear. J. L. J. Burati and J. J. Farrington. Cost of quality deviations in design and construction. In Source Document 29. The Construction Industry Institute, The University of Texas at Austin, Austin, Texas, 1987. R. Campbell and P. Flynn. A survey of free-form object representation and recognition techniques. Computer Vision and Image Understanding (CVIU), 81(2):166–210, 2001. H. Cantzler, R. B. Fisher, and M. Devy. Improving architectural 3d reconstruction by plane and edge constraining. In Proceedings of the British Machine Vision Conference, pages 663–72, 2002. G. Cheok, W. Stone, R. Lipman, , and C. Witzgall. Ladars for construction assessment and update. Automation in Construction, 9(5-6):463–477, 2000. S. El-Hakim. Three-dimensional modeling of complex environments. In Videometrics and Optical Methods for 3D Shape Measurement (SPIE vol. 4309), 2001. S. F. El-Hakim, P. Boulanger, F. Blais, and J.-A. Beraldin. A system for indoor 3D mapping and virtual environments. In Proceedings of Videometrics V (SPIE vol. 3174), pages 21–35, July 1997. J. Goedert, J. Bonsell, and F. Samura. Integrating laser scanning and rapid prototyping to enhance construction modeling. Journal of Computing in Civil Engineering, 11(2):71– 74, 2005. C. Gordon, B. Akinci, F. Boukamp, and D. Huber. Assessment of visualization software for support of construction site inspection tasks using data collected from reality capture technologies. In Proceedings of the International Conference on Computing in Civil Engineering, July 2005. D. Huber and N. Vandapel. Automatic three-dimensional underground mine mapping. International Journal of Robotics Research, 25(1):7–17, Jan. 2006. A. Johnson and M. Hebert. Using spin images for efficient object recognition in cluttered 3D scenes. IEEE Transactions on Pattern Analysis and Machine Intelligence (PAMI), 21(5):433–49, May 1999. A. Johnson, R. Hoffman, J. Osborn, , and M. Hebert. A system for semi-automatic modeling of complex environments. In Proceedings of the International Conference on 3D Digital Imaging and Modeling (3DIM), pages 213–220, 1997. R. Krishnamurti and R. Stouffs. The boundary of a shape and its classification. Journal of Design Research, 4(1), 2004. M. Levoy et al. The Digital Michelangelo Project: 3D scanning of large statues. In Proceedings of ACM SIGGRAPH, pages 131–144, 2000.
[18] D. Miyazaki, T. Ooishi, T. Nishikawa, R. Sagawa, K. Nishino, T. Tomomatsu, Y. Takase, and K. Ikeuchi. The great buddha project: modelling cultural heritage through observation. In Proceedings of the 6th International Conference on Virtual Systems and MultiMedia, pages 138–45, Oct 2000. [19] S. Naai-Jung and W. Pin-Hung. As-built point cloud review of a ceiling plumbing system. In 21st International Symposium on Automation and Robotics in Construction, 1993. [20] L. Patterson and W. Ledbetter. The cost of quality: A management tool, excellence in the constructed project. In Proceedings of Construction Congress I. ASCE, 1989. [21] W. Ping-Hung and S. Naai-Jung. Point-cloud-based comparison between construction schedule and as-built progress: long-range three-dimensional laser scanner’s approach. Journal of Computing in Civil Engineering, 10(3):98–102, 2004. [22] I. Stamos and P. K. Allen. Geometry and texture recovery of scenes of large scale. Computer Vision and Image Understanding (CVIU), 88(2):94–118, Nov. 2002. [23] G. Stiny. Shape: Talking about Seeing and Doing. MIT Press, 2006. [24] R. Stouffs and R. Krishnamurti. Algorithms for the classification and construction of the boundary of a shapes. Journal of Design Research, 6, 2006. to appear. [25] G. Vosselman, B. Gorte, G. Sithole, and T. Rabbani. Recognising structure in laser scanner point clouds. In International Archives of Photogrammetry, Remote Sensing and Spatial Information Sciences, volume 46, part 8/W2, pages 33–38. 2004. [26] Geomagic, inc – www.geomagic.com. [27] Graphisoft – www.graphisoft.com. [28] Innovmetric software, inc. – www.innovmetric.com. [29] Meshtoolbox – www.cs.cmu.edu/ vmr/software. [30] Zoller and frolich – www.zf-laser.com.