Journal of Experimental Psychology: Human Perception and Performance 2009, Vol. 35, No. 4, 1140 –1160
© 2009 American Psychological Association 0096-1523/09/$12.00 DOI: 10.1037/a0015019
The Comparison of Visual Working Memory Representations With Perceptual Inputs Joo-seok Hyun
Geoffrey F. Woodman
Chung-Ang University
Vanderbilt University
Edward K. Vogel
Andrew Hollingworth
University of Oregon
University of Iowa
Steven J. Luck University of California, Davis The human visual system can notice differences between memories of previous visual inputs and perceptions of new visual inputs, but the comparison process that detects these differences has not been well characterized. In this study, the authors tested the hypothesis that differences between the memory of a stimulus array and the perception of a new array are detected in a manner that is analogous to the detection of simple features in visual search tasks. That is, just as the presence of a task-relevant feature in visual search can be detected in parallel, triggering a rapid shift of attention to the object containing the feature, the presence of a memory–percept difference along a task-relevant dimension can be detected in parallel, triggering a rapid shift of attention to the changed object. Supporting evidence was obtained in a series of experiments in which manual reaction times, saccadic reaction times, and event-related potential latencies were examined. However, these experiments also showed that a slow, limited-capacity process must occur before the observer can make a manual change detection response. Keywords: Visual working memory, visual short-term memory, visual search, comparison
build up a representation of the environment over a sequence of fixations, one must determine which objects in the current visual input correspond with which objects in the previous visual input. This is presumably achieved by comparing the features of the objects in the current visual input with the features of the objects stored in VWM from the previous fixation (Currie, McConkie, Carlson-Radvansky, & Irwin, 2000; Henderson & Hollingworth, 1999). Moreover, saccades often fail to land on the intended object, and a representation of the saccade target may be stored in VWM so that this target can be found again if the initial saccade does not land on it (Hollingworth, Richard, & Luck, 2008). At a higher level, the comparison of VWM representations with sensory inputs may be important for learning about similarities and differences between simultaneously visible objects that cannot be foveated at the same time. This sort of comparison is used frequently in mundane tasks such as determining which of several pieces of fruit to choose for a snack. In this task, one apple from
The input to the human visual system consists primarily of a series of static snapshots—most lasting only a few hundred milliseconds—separated by blinks and saccades. It is often useful to compare information that was obtained from a previous snapshot and stored in visual working memory (VWM)1 with the information that is available in the current snapshot. The purpose of the present study was to characterize the processes involved in this comparison. The comparison of VWM representations with sensory inputs is likely to be important for both low-level and high-level aspects of vision (for a detailed discussion, see Luck, 2008). At a low level, comparison may play a role in establishing the correspondence between a presaccade visual input and a postsaccade visual input. To maintain a stable representation of the visual environment and
Joo-seok Hyun, Department of Psychology, Chung-Ang University, Seoul, Korea; Geoffrey F. Woodman, Department of Psychology, Vanderbilt University; Edward K. Vogel, Department of Psychology, University of Oregon; Andrew Hollingworth, Department of Psychology, University of Iowa; Steven J. Luck, Department of Psychology and Center for Mind & Brain, University of California, Davis. The experiments reported in this article formed a portion of the doctoral dissertation of Joo-seok Hyun. This study was made possible by Grants MH63001 and MH076226 from the National Institute of Mental Health. Correspondence concerning this article should be addressed to Steven J. Luck, UC–Davis Center for Mind & Brain, 267 Cousteau Place, Davis, CA 95618. E-mail:
[email protected]
1 The phrase working memory has a variety of connotations. Here we use this phrase to describe a memory system that holds information temporarily so that it can be used in the service of some task. The specific task being served by this memory system in the present study is the task of comparing sensory inputs that are separated by a gap. As the following text will illustrate, this is not just a contrived laboratory task but instead reflects an important part of natural visually guided behavior. We assume that the memory system being studied here is identical to the system that is often called visual short-term memory.
1140
VISUAL WORKING MEMORY COMPARISON
The Change Detection Task The process of comparing a VWM representation with a sensory input is a key component of the change detection task that is commonly used to study the nature of the VWM representations (see reviews by Luck, 2008; Rensink, 2002; Simons & Rensink, 2005). In the one-shot version of the change detection task, observers view a sample array containing several objects, followed by a brief retention interval and then a test array. The test array is either identical to the sample array or contains an object that somehow differs from the corresponding object in the sample array, and the observer makes an unspeeded two-alternative forced choice response to indicate whether a change was detected. This task involves a sequence or cascade of several processes. First, observers must form a perceptual representation of the sample array. Second, this perceptual representation must be transformed into a stable working memory representation that can persist after the sample array has been removed (see Jolicoeur & Dell’Acqua, 1998; Vogel, Woodman, & Luck, 2006). If the sample array contains more information than can be held in VWM, only a subset of the items may be stored in VWM (see Alvarez & Cavanagh, 2004; Luck, 2008; Vogel, McCollough, & Machizawa, 2005). Third, this working memory representation must be accurately maintained across the retention interval (see Gold & Green, 2005; Spencer & Hund, 2002). Fourth, the VWM representation of the sample array must be compared with the sensory input arising from the test array (see Mitroff, Simons, & Levin, 2004). Finally, a decision rule must be applied to generate a single two-alternative response from the results of the comparison process (see Wilken & Ma, 2004). The speed and accuracy of change detection depend on the operation of each of these processes.
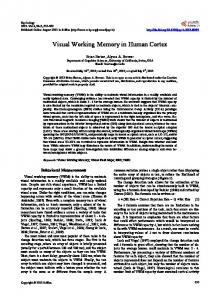
then discuss its relevance for the comparison of VWM representations with sensory inputs in the change detection task. In the seminal study of Egeth (1966), observers were presented with two simultaneous objects and made a speeded response to indicate whether they were the same or different. Although this task is quite different from the contemporary change detection task, some variations of the Egeth paradigm were much more similar (but yielded the same pattern of results). As illustrated in Figure 1A, for example, Taylor (1976) presented observers with two side-by-side arrays, each containing four letters. In one condition—which we call the any-difference task—the observers pressed one button if any of the items in one array differed from the corresponding items in the other array (i.e., if there was any difference), and they pressed a different button if all the items were identical. In other words, the number of differences ranged from zero to four, and the observers were required to make one response for zero differences and a different response for between one and four differences. We refer to a difference between two corresponding items as a critical feature because this is the feature that distinguishes between the two response alternatives. This condition of the Taylor study closely resembles the contemporary change detection task except that (a) responses were speeded and reaction time (RT) was the primary dependent variable; (b) the number of differences between the two arrays was varied rather than the number of items in each array; and (c) the two arrays were presented simultaneously rather than sequentially. Although the simultaneous presentation of the two arrays might
(A) Critical feature
Any-difference
Any-sameness
Present
C DFH
C SFH
C DFH
S ZFR
Absent
C DFH
C DFH
C DFH
S ZKR
(B) 800
Any-sameness (CDFH vs SDKR)
700
RT (ms)
a bowl may be stored in VWM and then compared with other apples until a more attractive apple is found, at which point this new apple will replace the original apple in VWM before the search continues. Comparison may also be important for the acquisition of knowledge about categories of objects. For example, an infant who sees two dogs and a cat may be able to learn about the similarities and differences between these categories by fixating one of the animals, storing its features in VWM, fixating another of the animals, and comparing the VWM representation of the first animal with the sensory input arising from the second animal (see Gentner & Namy, 1999). The same sort of process may occur in adulthood as individuals learn to categorize and recognize new types of visual information, such as the latest mobile phone models, slightly different varieties of birds, or eventrelated potential (ERP) waveforms.
1141
600 500
Any-difference 400 C DFH C DFH
0
1
2
3
4
C DFH C DFR CZFR SZFR SZK R Any Difference SZK R SZFR CZFR C DFR C DFH Any Sameness
Prior Research on Perceptual Comparison
Number of Critical Features
The contemporary literature on VWM and change detection has largely ignored the process by which the VWM representation of the sample array is compared with the sensory input from the test array (for exceptions, see Hollingworth, 2003; Mitroffet al., 2004; Simons, Chabris, & Schnur, 2002). However, an old and rarely cited literature on the process of perceptual comparison is quite relevant (see Farell, 1985, for an insightful and exhaustive review of this literature). We will briefly review this literature here and
Figure 1. Stimuli (Panel A) and reconstructed results (Panel B) from the perceptual comparison study of Taylor (1976). The critical feature is the feature that defines the difference between the two response categories. In the any-difference task, one response is made if one or more differences are present, and the other response is made if no differences are present; a difference is therefore the critical feature. In the any-sameness task, one response is made if one or more items are the same between the arrays, and the other response is made if no items are the same; a sameness is therefore the critical feature. RT ⫽ reaction time.
1142
HYUN, WOODMAN, VOGEL, HOLLINGWORTH, AND LUCK
seem to eliminate the need to use memory in this paradigm, it is plausible that the observers foveated one array, stored it in memory, and then foveated the other array, comparing a VWM representation of one array with the sensory input from the other array. Indeed, Scott-Brown, Baker, and Orbach (2000) have argued that VWM is used to detect differences between stimulus arrays whether they are presented sequentially or simultaneously. As illustrated in Figure 1B, responses in the any-difference condition were quite fast, and they became faster as the number of critical features (differences) increased from one to four, presumably because increasing the number of critical features increases the probability that one of them will be detected rapidly. However, RTs were faster when there were no differences than when there were only one or two differences. This fast-same effect is difficult to explain, because determining that no changes are present should require an exhaustive search of all of the items. However, this effect has been observed in many experiments, including the change detection experiments that we will report later. Farell (1985) provided a comprehensive overview of this curious finding, which we will not consider further here. The Taylor (1976) study also included an any-sameness condition— originated by Sekuler and Abrams (1968)—in which the observer made one response if the two arrays were completely different and another response if one or more items were identical between the two arrays (see Figure 1A). In this task, the critical feature is a sameness between two corresponding items in the two arrays. Although this task is just the obverse of the any-difference task, the pattern of results was quite different (see Figure 1B). First, although RTs increased as the number of critical features decreased in both tasks, this effect was much larger in the anysameness task than in the any-difference task. Second, RTs did not become faster when the number of critical features was zero in the any-sameness task (which would be the analog of the fast-same effect in the any-difference task). Thus, the detection of sameness appears to be substantially more difficult than the detection of difference (unless sequential arrays are presented with a very short delay, as in the study of Theeuwes, 2004). We have conducted a color change detection experiment with the any-sameness and any-difference conditions using sequentially presented arrays and speeded responses (Hyun & Luck, 2009), and the results were virtually identical to those of Taylor (1976). Thus, the contemporary change detection paradigm appears to involve the same comparison processes that were studied in the classic literature on the comparison of simultaneous patterns.2
A Theoretical Framework for Understanding Comparison in Change Detection In this section, we describe a theoretical framework for understanding the nature of the comparison process in change detection. This framework is based on the idea that the change detection task can be considered a type of visual search task, in which the observer searches for a target item in the test array that is defined by its relation to the sample array. In the typical any-difference version of change detection, the target is an item that differs from the corresponding item in the sample array. In an any-sameness task, the target would be an item that is the same as the corresponding item in the sample array. Indeed, the target for a given trial in some visual search experiments is indicated by a sample
stimulus at the beginning of the trial, and observers search for an item that matches this sample in the search array (see, e.g., Chelazzi, Duncan, Miller, & Desimone, 1998; Vickery, King, & Jiang, 2005; Wolfe & Horowitz, 2004). Thus, the sophisticated theories and methods that have been developed in the context of visual search can be applied to change detection (for an example of the application of visual search concepts to the flicker version of the change detection paradigm, see Rensink, 2000). In the present study, we identify three issues that have been extensively studied in the visual search literature and address them in the context of change detection. First, research on visual search has asked whether search targets are detected by means of a limited- or an unlimited-capacity perceptual process (e.g., Palmer, Ames, & Lindsey, 1993; Treisman & Gelade, 1980; Wolfe, 1994), and we ask whether changes are detected by means of a limited- or an unlimited-capacity comparison process. Second, research on visual search has made a distinction between targets defined by the presence of a feature and targets defined by the absence of a feature (e.g., Treisman, 1988; Treisman & Souther, 1985), and we explore whether the presence of a change (i.e., in the anydifference task) is detected in a fundamentally different manner from the absence of a change (i.e., in the any-sameness task). Third, research on visual search has examined whether attention is voluntarily or involuntarily attracted by the presence of a distinctive feature within an otherwise homogeneous array (e.g., Folk, Remington, & Johnston, 1992; Jonides & Yantis, 1988; Theeuwes, 1994), and we ask whether attention is voluntarily or involuntarily attracted by a single changed item within an array of unchanged items. In the context of these three broad issues, we address a specific hypothesis about the comparison process. Specifically, we propose that a target defined by a difference between the sample and test arrays in a comparison task is analogous to a target defined by the presence of a simple feature in a conventional visual search task. This proposal can be divided into three subhypotheses corresponding to the three broad issues described in the preceding paragraph. First, we propose that the presence of a difference between a VWM representation of a sample array and the sensory input arising from a test array can be detected by means of an unlimitedcapacity comparison process. Second, we propose that there is a comparison asymmetry, in which the presence of a change can be detected by means of an unlimited-capacity process, whereas the absence of a change can be detected only by means of a limitedcapacity process. This is analogous to the search asymmetry effect, in which a visual search target defined by the presence of a simple feature can be detected by an unlimited-capacity perceptual process, but a target defined by the absence of a simple feature can be detected only by means of a limited-capacity process (e.g., Treisman, 1988; Treisman & Souther, 1985). Third, we propose that the unlimited-capacity change detection process leads to a shift of attention to the changed item, and we further propose that this shift of attention is voluntary, just as shifts of attention to a feature 2 It should also be noted that memory comparison processes have also been studied extensively in the Sternberg memory-scanning paradigm (Sternberg, 1966, 1969). However, this paradigm likely involves verbal encoding of the stimuli, and the results are very different from those obtained in perceptual comparison and change detection tasks.
VISUAL WORKING MEMORY COMPARISON
target in visual search are voluntary under many conditions (Luck & Ford, 1998; Luck & Hillyard, 1994b), although not under all conditions (see, e.g., Folk et al., 1992; Theeuwes, 1993). In addition to these three parallels between the detection of changes in comparison tasks and the detection of feature targets in visual search, we also propose that there is a key difference between these situations. In visual search, shifting attention to a feature-based target brings the actual target information into the focus of attention, making it possible to verify that the attended object is indeed the target.3 In change detection, in contrast, shifting attention to the changed item does not bring the change itself into the focus of attention. That is, although attention shifts to the changed item, this does make the change itself visible, and high-level decision and response systems may not consider the shift of attention to be strong evidence that the now-attended item has actually changed (see Woodman & Luck, 2003a, for evidence that shifts of attention can be dissociated from awareness of the shift-inducing event in the context of object-substitution masking). In the context of change detection, therefore, some sort of verification of the change may be necessary to produce awareness of the change and to trigger the appropriate behavioral response. Verifying that the now-attended item is actually a changed item may require the now-attended item to be compared once again with the representation of the sample array in VWM. The experiments we will present provide evidence that this second comparison process may lead to a substantial slowing of manual button-press responses in change detection tasks., although it does not slow highly automatized responses such as eye movements toward the changed item. The hypothesis that the initial comparison process is unlimited in capacity must be stated with some additional precision and qualified in two important ways. Specifically, this hypothesis states that the process of comparing a given VWM representation to a corresponding sensory input can occur in parallel for each VWM representation, with no reduction in the speed or accuracy of one comparison operation when other comparisons are also being made. This specific way of stating the hypothesis has two important implications. First, unlimited-capacity comparisons are possible only for the relatively small number of items that are currently stored in VWM. That is, we are not proposing that all of the items from the sample array can be compared with all the items from the test array; rather, we propose that the items from the sample array that were actually stored in VWM can be compared with the corresponding items in the test array without capacity limits. Second, unlimited-capacity comparisons may be possible only when the visual system can easily determine which items from the test array should be compared with each item being held in VWM. When the visual system cannot determine the correspondence between the VWM representations and the test-array items (e.g., owing to a change in the relative positions of the items between the sample and test arrays), unlimited-capacity comparisons may not be possible. This would not reflect a limitation in the comparison process but rather a limitation in an alignment or selection processes that feeds the appropriate sensory inputs into the comparison process.
Overview of the Present Study Experiment 1 of this study provides links among the classic literature on perceptual comparisons, the contemporary literature on change detection, and the literature on visual search, showing that RT increases much more steeply as a function of set size in the
1143
any-sameness task (in which observers search for the absence of a change) than in the any-difference task (in which they search for the presence of a change). This parallels the visual search finding that RT slopes are steeper when the target is defined by the absence of a feature than when the target is defined by the presence of a feature (Treisman, 1988; Treisman & Souther, 1985). Experiments 2 and 3 show that the presence of a changed item in the test array in the any-difference task leads to a shift of attention to the location of this item. These experiments further demonstrate that the timing of this shift of attention remains relatively constant as the set size increases, supporting the proposal that changes can be detected by means of an unlimited-capacity comparison process (just as simple features can be detected by means of an unlimited-capacity perceptual process in visual search). In Experiment 2, shifts of covert attention are measured by means of the N2pc (N2–posterior– contralateral) component of the ERP waveform, a well-validated index of visual attention (Luck, Girelli, McDermott, & Ford, 1997; Luck & Hillyard, 1994a, 1994b). In Experiment 3, observers were required to make an eye movement to the location of the changed item, making it possible to measure the time at which overt attention was shifted. Experiments 4a and 4b provide evidence that a limited-capacity process is interposed between the shift of attention and the observer’s button-press response, perhaps reflecting the need to verify that the now-attended item actually differs from the corresponding item from the sample array that is being represented in VWM. In Experiment 5, the N2pc component is used to show that the shift of attention to a changed item is under voluntary control. In particular, when changes can occur in either of two dimensions and observers are instructed to detect changes in only one of these dimensions, attention shifts only to changes in the relevant dimension. This parallels the finding from visual search experiments that observers will, under some conditions, shift attention to feature singletons in a task-relevant dimension but avoid shifting attention to feature singletons in task-irrelevant dimensions (Bacon & Egeth, 1994; Folk et al., 1992; Folk, Remington, & Johnston, 1993; Folk, Remington, & Wright, 1994; Luck & Hillyard, 1994a).
Experiment 1: Relating Change Detection to Perceptual Comparison Experiment 1 examined the relationship between the contemporary change detection paradigm and the classic perceptual comparison literature, testing the hypothesis that set size would influence RT more strongly in the any-sameness version of the task than in the any-difference version. Observers viewed a sample array containing between one and four colored squares, followed by a brief retention interval and then a test array (see Figure 2). In the any-difference condition, the test array was identical to the sample array on 50% of trials and differed in the color of one item on the remaining 50% of trials. The critical feature was the presence of a change: observers pressed one button if the two 3
Treisman and her colleagues have argued that focused attention is not necessary to detect a feature target (Treisman, 1986; Treisman, 1988), but observers do in fact shift attention to feature-defined targets (Kim & Cave, 1995; Luck & Hillyard, 1994a) unless they are given a reason not to do so (Luck & Ford, 1998). The purpose of this may be to verify that the now-attended item is, in fact, the target.
HYUN, WOODMAN, VOGEL, HOLLINGWORTH, AND LUCK
1144
800 ms Test Sample (200 ms) (until response)
1 Critical Feature
0 Critical Features
Figure 2. Examples of trials with 0 or 1 critical features in the anysameness condition of Experiment 1. Different fill patterns are used to represent different colors. In this task, observers were asked to make one response if all items changed and a different response if one item stayed the same. In the any-difference condition, observers were asked to make one response if no items changed and a different response if an item changed.
arrays were identical and a different button if a color difference was detected. This condition was just like a typical change detection task except that the responses were speeded rather than unspeeded. In the any-sameness condition (illustrated in Figure 2), every item in the test array differed in color from the corresponding item in the sample array on 50% of trials, and one item was the same on the remaining 50% of trials. The critical feature in this condition was the absence of a change (the presence of a sameness): observers made a speeded response on one of two buttons to indicate whether all items were changed or whether one or more items were unchanged. Note that for both conditions, the number of items in the array varied from one to four and the number of critical features was either zero or one. We predicted that RTs would increase as a function of set size steeply in the any-sameness condition (as in visual search tasks with a target defined by the absence of a feature), and less steeply in the any-difference condition (as in visual search tasks with a target defined by the presence of a feature).
Method Participants. Ten college students between ages 18 and 30 participated in this experiment for course credit or monetary compensation. They reported normal color vision, normal or correctedto-normal visual acuity, and no history of neurological disorders. Stimuli and procedure. Stimuli were presented within an 8.2° ⫻ 8.2° region centered on a cathode ray tube (CRT) video monitor. The video monitor was placed 70 cm away from the participant’s eyes, and the stimuli were presented on a gray background (10.3 cd/m2). A Tektronix model J17 colorimeter (Tektronix Inc., Beaverton, OR) was used to measure the luminance and chromaticity of the stimuli using the Commission Internationale de l’Eclairage (CIE) 1931 color coordinate system. Each trial consisted of a 200-ms sample array followed by an 800-ms blank delay interval and then a test array that was visible until the participant responded. Each sample array consisted of between one and four colored squares, each subtending 0.74° ⫻ 0.74° of visual angle. The colors were selected at random without replacement from a set of eight colors: white (25.49 cd/m2), red
(x ⫽ .625, y ⫽ .313, 8.05 cd/m2), blue (x ⫽ .202, y ⫽ .131, 6.64 cd/m2), green (x ⫽ .321, y ⫽ .545, 14.17 cd/m2), black (⬍ 0.01 cd/m2), yellow (x ⫽ .458, y ⫽ .445, 24.99 cd/m2), cyan (x ⫽ .221, y ⫽ .251, 16.90 cd/m2), and violet (x ⫽ .324, y ⫽ .151, 4.72 cd/m2). When a color was changed between the sample and test arrays, the new color was selected at random without replacement from the remaining colors. Thus, colors were never repeated within either the sample or test array. In the any-difference condition, the test array was identical to the sample array on 50% of trials and was identical except for the color of one item on the remaining 50%. In the any-sameness condition, every item in the sample array changed colors in the test array on 50% of the trials, and all but one changed colors on the remaining half. Thus, the probability of the critical feature being present was .5 in both conditions. Participants pressed one of two buttons on a game pad to report whether the critical feature was detected. They pressed with the index finger of their dominant hand if the critical feature was absent and with the middle finger of the same hand if the critical feature was present. Speed and accuracy were equally emphasized. Each participant was tested in a single session of approximately 50 min that included a brief practice period for each task condition. The any-difference and any-sameness conditions were tested in counterbalanced order. Participants also performed a concurrent articulatory suppression task that effectively discourages the use of verbal working memory (Baddeley, 1986; Dixon & Shedden, 1993). Specifically, they repeated two digits aloud throughout each trial. These digits were presented for 500 ms at the beginning of each trial, followed by a 1,250-ms blank period, and they changed randomly from trial to trial.
Results Figure 3 shows the RT and accuracy results, along with the slopes of the best-fit linear functions. RT and accuracy were analyzed in separate within-subjects analyses of variance (ANOVAs) with factors of condition (any-difference or anysameness), set size (0, 1, 2, 3, or 4), and number of critical features (zero or one). In both conditions, RTs became slower as the set size increased, but RTs increased more steeply in the anysameness condition than in the any-difference condition. These effects led to a significant interaction between set size and condition, F(3, 27) ⫽ 17.79, p ⬍ .001, as well as significant main effects of set size and condition, (F(3, 27) ⫽ 47.46, p ⬍ .001, and F(1, 9) ⫽ 19.46, p ⬍ .01, respectively. RTs were faster when zero critical features were present than when one critical feature was present in the any-difference condition; this is the fast-same effect from the classic perceptual comparison literature. However, this effect was reversed in the any-sameness condition, leading to a significant interaction between condition and number of critical features, F(4, 36) ⫽ 13.3, p ⬍ .001. Error rates also differed markedly between the any-difference and any-sameness conditions. In the any-difference task, the error rate was generally low and increased only slightly as the set size increased. In the any-sameness task, observers frequently failed to detect the one nonchanging item, leading to a sharp increase in the error rate as set size increased on trials with one critical feature.
VISUAL WORKING MEMORY COMPARISON
1000
Mean RT (ms)
900 800 700
Any Differenceno change AnyDifference1 change AnySamenessall-change AnySameness1 no-change
(A) 111 98 42 36
600 500 400 1
2
3
4
Set Size
Any Differenceno change AnyDifference1 change AnySamenessall-change AnySameness1 no-change
Mean Error Rate
50 40 30
(B) 13.3
20 10
2.1 2.0 1.0
0 1
2
3
4
Set Size Figure 3. Mean reaction time (RT) (Panel A) and error rate (Panel B) from Experiment 1. The numbers on the right side of each line indicate the slopes of the best-fit linear functions in milliseconds/item (Panel A) and percentage of incorrect/item (Panel B), respectively. Error bars indicate within-subjects 95% confidence intervals.
The error rate did not increase sharply on trials with zero critical features in this condition, however. This pattern led to a significant three-way interaction among condition, set size, and number of critical features, F(3, 27) ⫽ 14.62, p ⬍ .001.
Discussion The results of Experiment 1 support the proposal that it is easier to search for the presence of a change than to search for the absence of a change, just as it is easier to find a visual search target defined by the presence of a feature than to find a target defined by the absence of a feature. These results are consistent with findings from a similar experiment in which the set size was held constant and the number of critical features varied between zero and four (Hyun & Luck, 2009). Similar results were also reported by Theeuwes (2004), who found that RT slopes were substantially steeper when observers searched for an item that did not change orientation among items that changed orientation than when they searched for an item that changed orientation among items that did not change orientation. Of interest, Theeuwes (2004) found much less difference when the retention interval between the sample and test arrays was eliminated, suggesting that this asymmetry does not apply when low-level sensory transients can be used to signal changes in the stimuli. A compatible result was also reported by Jiang, Olson, and Chun (2000), who found that change detection performance for a given item was impaired when all of the other
1145
items changed color in the test array; this is similar to the present finding that the any-sameness task was more difficult than the any-difference task. Although the presence of a change was detected more efficiently than the absence of a change in this experiment, the slope of the function relating RT to set size was still quite substantial (42 ms/item) when observers detected the presence of a change. This is substantially greater than the slopes typically observed when observers perform visual search tasks with targets defined by the presence of a feature. As was discussed previously, changes may be detected by an unlimited-capacity process that triggers a shift of attention to the changed item, but further processes may be necessary to verify that the now-attended item is actually a changed item before the observer will make a button-press response. These further processes may be set-size-dependent, masking the presence of an initial unlimited-capacity change detection mechanism. We designed Experiment 2 to test this proposal by determining whether covert attention is directed to the location of the changed item and whether the speed of the attention shift is independent of the set size (within the range of set sizes that can be stored in VWM).
Experiment 2: Allocation of Covert Attention to the Changed Item In this experiment, the latency of the N2pc component was used to measure the time at which covert attention was shifted to the changed item in the any-difference version of the task (i.e., in the conventional change detection task). The N2pc component is a negative-going electrical potential that is typically observed in response to a target in a visual search array, and it typically begins 150 –200 ms after the onset of the search array (Luck & Ford, 1998; Luck et al., 1997; Luck & Hillyard, 1994a, 1994b). It is larger over the hemisphere contralateral to the attended location than over the ipsilateral hemisphere, which makes it relatively easy to isolate from other ERP components, which are bilaterally distributed in response to bilateral stimulus arrays (see Chapter 2 of Luck, 2005). Several studies have shown that the N2pc component reflects the focusing of attention onto an object (Luck & Hillyard, 1990, 1994a, 1994b; Woodman, 2002; Woodman & Luck, 1999, 2003a, 2003b). Magnetoencephalographic studies indicate that the N2pc component is generated primarily in lateral occipitotemporal cortex (Hopf et al., 2000; Hopf, Vogel, Woodman, Heinze, & Luck, 2002), and a study combining magnetoencephalography and functional magnetic resonance imaging showed that the N2pc generators include the lateral occipital complex and the human homologue of macaque area V4 (Hopf et al., 2006). The timing of the N2pc component can be used to track the timing of shifts of attention with millisecond-level precision (Woodman & Luck, 1999, 2003b). Two questions were addressed using the N2pc component. First, we asked whether a changed item in the test array would attract attention to its location, eliciting an N2pc component contralateral to the changed item. Second, we asked whether the latency of the N2pc component elicited by this changed item would increase as set size increased, indicating that the comparison process is limited in capacity, or whether N2pc latency would remain constant, consistent with an unlimited-capacity comparison process. We also examined the latency of the P3 component, which reflects the operation of a late,
HYUN, WOODMAN, VOGEL, HOLLINGWORTH, AND LUCK
1146
limited-capacity process that follows the stimulus categorization (Isreal, Chesney, Wickens, & Donchin, 1980; Kok, 2001; Luck, 1998, 2005). We therefore expected P3 latency to increase as set size increased, just as RT was expected to increase. Figure 4 illustrates the stimuli and task used in Experiment 2, which were somewhat different from those used in typical change detection experiments to accommodate the special requirements of ERP recordings. Specifically, to avoid large changes in the stimuli across set sizes, we arranged for each sample and test array to contain five items, some drawn in red and others drawn in green. We varied the set size by instructing the observers to remember the orientations of the items drawn in one color and to ignore the items drawn in the other color. Between one and four items were drawn in the attended color, and because the color attended was varied in a given trial block, the same physical stimulus could be used for set sizes one and four (i.e., an array with one red item and four green items or vice versa) and for set sizes two and three (i.e., an array with two red items and three green items or vice versa). Previous experiments have indicated that observers can easily perform this kind of selection, remembering the selected items almost as well as if only the selected items had been present in the array (Gold et al., 2006; Vogel, 2000; Vogel et al., 2005). Moreover, this selection occurs during the encoding of the sample array, and we were mainly interested in examining the ERPs elicited by the test array. A similar approach has been used to isolate sensory factors from attentional factors in visual search (Palmer et al., 1993). Thus, this modification of the typical change detection procedure should not have had a large impact on the pattern of results.4
Method Participants. Seventeen paid volunteers between 18 and 30 years of age participated in this experiment. All reported normal or corrected-to-normal visual acuity, normal color vision, and no history of neurological disorders. Stimuli and procedure. Stimuli were presented at a viewing distance of 100 cm on a CRT monitor with a gray background (10.29 cd/m2) and a continuously visible white fixation point (25.51 cd/m2). Each sample array consisted of five colored bars, each measuring 0.39° ⫻ 0.05°. The orientation of each bar was selected at random, with replacement, from a set of four orientations (vertical, horizontal, 45°, and 135°).5 One, two, three, or four of the bars were red (x ⫽
Sample (100 ms)
Test (100 ms)
500 ms
Figure 4. Example of a change trial in Experiment 2. In this example, observers were instructed to remember the orientations of the items in one color (either green or red, represented here by white and black) and to ignore the other items. When a change occurred in the test array, it was always an orientation change in one of the attended-color items. To manipulate the set size, we varied the number of attended-color bars across trials. Event-related potentials were measured time-locked to test array onset.
.625, y ⫽ .313, 8.05 cd/m2) and the remaining bars were green (x ⫽ .321, y ⫽ .545, 14.17cd/m2). The bars were randomly presented within two 3.3° ⫻ 6.0° regions that were centered 2.8° to the left and right of fixation. Two bars were on the left side and the other three bars were on the right side for half of the trials, and this was reversed for the other half. The number of red versus green bars on a given side varied unpredictably. Each trial consisted of a 100-ms sample array followed by a 500-ms blank delay interval and a 100-ms test array.6 The screen was then blank until the participant responded, and this was followed by a blank intertrial interval that varied randomly between 550 ms and 750 ms. At the beginning of each block of trials, participants were instructed to attend to either the green or the red 4
Although this experimental design minimizes changes in the physical stimulus across set sizes that might influence the ERP waveforms, the stimuli used on change trials were slightly different from the stimuli used on no-change trials. That is, the sample and test arrays were identical on no-change trials, whereas the orientation of the changed item in the test array was different from the orientation of the corresponding item from the sample array on change trials. The presentation of an item at a given orientation in the sample array may lead to adaptation of sensory neurons that code that orientation, leading to a smaller response when that same orientation is repeated at the corresponding location in the test array. This might lead to a reduced sensory response for unchanged items in the test array compared with the response elicited by a changed item. A previous visual search study showed that this leads to a larger P1 contralateral to the location of an item that differs in orientation from the orientations that were present in a preceding array (Luck & Hillyard, 1994a) but with no changes in other ERP components (including the N2pc component). Thus, we expected to observe a slightly larger P1 contralateral to the changed item in the test array because of sensory adaptation. However, this should not influence the N2pc component, and Experiment 5 provides direct evidence that the same N2pc effects are observed when sensory adaptation is controlled. 5 In this experiment and Experiment 5, the constraints on ERP recordings made it necessary to allow repetitions of feature values within the stimulus arrays, whereas no repetitions were used in the other experiments (Experiments 1, 3, and 4). As a result, correct performance required comparing the corresponding locations in the sample and test arrays in the ERP experiments, whereas the mere presence of a new feature value, irrespective of location, could be used in the other experiments. This difference does not seem to have influenced behavioral performance in any obvious way. However, as noted by Johnson, Hollingworth, and Luck (2008), observers may use a representation of the global statistical properties of the stimulus arrays in addition to objectbased representations to perform the task when the changed item contains a new feature value, which may in turn lead to a slight improvement in accuracy compared with conditions that do not involve new feature values. The use of this secondary change detection mechanism may have influenced performance slightly in Experiments 1, 3, and 4. 6 This is a shorter test array duration than is usually used in change-detection tasks, but a pilot experiment showed that change-detection performance is just as accurate with a 100-ms test array as with a 2,000-ms test array. This result indicates that the comparison process must be quite rapid. However, because visual information may persist for hundreds of milliseconds following the offset of a stimulus, this result does not provide strong evidence that the comparison process is unlimited in capacity. The delay interval in this experiment was also somewhat shorter than is typical, which may raise questions about the possible use of iconic memory to solve the task. However, the test array effectively erases the iconic memory of the sample array in change detection tasks, and a delay as short as 70 ms is sufficient to avoid contamination from iconic memory (Rensink, O’Regan, & Clark, 1997).
VISUAL WORKING MEMORY COMPARISON
items and to remember the orientations of the attended items. The items of the unattended color never changed between the sample and test arrays. One of the attended-color items changed to a different orientation in the test array on two thirds of trials, and no change was present on the remaining a third of trials (this probability difference was implemented to increase the signal-to-noise ratio on the change trials). The unattended-color items never changed between the sample and test arrays. The participants were instructed to press a button on a game pad with the index finger of the dominant hand if they detected a change in an item of the attended color and to press a button with the middle finger of the same hand if they did not detect a change. Accuracy was emphasized, and speed was not. Participants performed eight blocks of trials, alternating between attend-red and attend-green blocks. The starting color alternated across participants. Each trial block contained 72 trials at each of the four set sizes. Articulatory suppression was not used in this experiment or in the following experiments because it introduces movement artifacts in ERP and eye movement recordings. There is no obvious way in which verbal coding of the stimuli could influence the ERP and eye movement responses recorded in these experiments, and previous research has also indicated that permitting verbal coding does not have a significant influence on behavioral measures in similar tasks (see Experiments 1 and 2 of Vogel, Woodman, & Luck, 2001). Recording and data analyses. The electroencephalogram (EEG) was recorded using tin electrodes mounted in an elastic cap. Recordings were obtained from 10 standard scalp sites of the International 10/20 System of Electrode Placement (F3, F4, C3, C4, P3, P4, O1, O2, T5, and T6), two nonstandard sites (OL, halfway between O1 and T5, and OR, halfway between O2 and T6), and the left mastoid. All of these sites were referenced to an electrode on the right mastoid. The averaged ERP waveforms were algebraically re-referenced offline to the average of the activity at left and right mastoids (Luck, 2005; Nunez, 1981). The horizontal electrooculogram (EOG) was recorded from electrodes placed lateral to the left and right eyes for monitoring horizontal eye movements. The vertical EOG was recorded with an electrode placed below the left eye, referenced to the right mastoid, and was used to detect blinks. Electrode impedances were reduced to 5 K⍀ or less. The EEG and EOG were amplified by an amplifier (SA Instrumentation, San Diego, CA) with a bandpass of 0.01– 80 Hz and digitized at a rate of 250 Hz. An additional low-pass filter was applied offline before the data were plotted (Gaussian impulse response function with a full-width at half maximum of 14 ms and a half-amplitude cutoff of 30 Hz), but all ERP measurements were obtained without this filter to maintain the temporal precision of the measures. Trials with blinks or eye movements were automatically excluded from all behavioral and ERP analyses using our standard procedures, which make it possible to ensure that the average eye movement was less than 0.1° in the direction of the changed item (see Woodman & Luck, 2003b). In accordance with our standard procedures, any participant with a rejection rate of 25% or higher was replaced; four participants were replaced for this reason. Error trials in which participants made incorrect responses were excluded from the averaged ERP waveforms; this increased the probability that the changed item was actually stored in memory.7
1147
The N2pc component was isolated by means of difference waves in which the ERP response on no-change trials was subtracted from the ERP response to a change at either contralateral or ipsilateral locations (relative to the electrode site). This procedure subtracts any ERP components that are unrelated to the detection of change and is somewhat different from our usual procedure, in which ipsilateral and contralateral responses are compared directly; the present procedure was more appropriate here because we were interested in the time at which a change was first detected. N2pc latency was measured from the contralateral difference waveforms using the 50% area latency algorithm at the medial occipital, lateral occipital, and posterior temporal electrode sites (O1/2, OL/R, and T5/6). This algorithm computes the area under the curve between 150 ms and 250 ms poststimulus and then finds the time point that bisects this area into two equal-area regions. This algorithm has many advantages over the more common peak latency measure, including being more robust in the face of noise and being more easily related to RT data (see Chapter 6 in Luck, 2005). N2pc amplitude was quantified as the mean amplitude in the contralateral difference waveforms from 150 ms to 250 ms, relative to a 200-ms prestimulus baseline period. We isolated the P3 component in the same manner as the N2pc component but using a measurement interval of 200 –575 ms poststimulus. When appropriate, the p values were corrected for nonsphericity using the Greenhouse–Geisser epsilon correction (Jennings & Wood, 1976).
Results Figure 5 summarizes the RT and error rate results. RTs and error rates were analyzed in separate ANOVAs with factors of trial type (change vs. no-change) and set size (1, 2, 3, or 4). Mean RT increased as a function of set size, leading to a main effect of set size, F(3, 48) ⫽ 68.84, p ⬍ .001. The mean error rate also increased as set size increased, F(3, 48) ⫽ 42.9, p ⬍ .001. These effects were observed primarily on change trials, with little effect of set size on no-change trials, leading to a significant interaction between trial type and set size for both RT and error rate, F(3, 48) ⫽ 19.6, p ⬍ .05, and F(3, 48) ⫽ 19.3, p ⬍ .001, respectively. One consequence of this is that RTs were substantially faster on no-change trials than on change trials at set sizes 3 and 4. This is the classic fast-same effect. Note that the slope of the function relating RT to set size was greater in this experiment than in Experiment 1; this likely reflects the fact that responses were speeded in Experiment 1 and unspeeded in the present experiment. Figure 6 shows grand average ERP waveforms from no-change trials and from change trials (separated into ipsilateral-to-change and contralateral-to-change waveforms). These waveforms contain many overlapping ERP components that are unrelated to the detection of changes, as well as ERP activity elicited by the sample array that was still present at the time of the test array. To isolate specific ERP components elicited by the detection of changes in the test array, we constructed difference waves in which the 7
The present experiment did not yield a sufficient number of error trials to perform a robust analysis of the ERPs on error trials. However, informal analyses of error trials in this and other similar experiments suggest that no substantial N2pc activity is elicited by changes that are not detected.
HYUN, WOODMAN, VOGEL, HOLLINGWORTH, AND LUCK
1200
100
No-change Change
1000 Mean RT (ms)
75 800
119
RT 600 400
22
50
6.9
25
Error Rate
200
0.9
0
Mean error rate (% incorrect)
1148
0 1
2
3
4
Set size Figure 5. Mean reaction times (RTs) and error rates from Experiment 2. The numbers next to each line indicate the slopes of the best-fit linear function in milliseconds/item (RT) and percentage of incorrect/item (error rate), respectively. Error bars indicate within-subjects 95% confidence intervals.
waveform on no-change trials was subtracted from the waveform on change trials (done separately when the change was ipsilateral versus contralateral to the electrode site). These difference waves are shown in Figure 7 and were used to measure the ERP amplitudes and latencies. A negativity was present in the contralateral difference waveforms from approximately 150 –300 ms but was largely absent from the ipsilateral waveforms; this is the N2pc component. The difference waveforms also contained a positivity beginning at approximately 300 ms that was present at both contralateral and ipsilateral sites; this is the P3 component. A small positivity was also present at contralateral sites from approximately 80 –150 ms; Ipsilateral-to-Change
this is the P1 sensory adaptation effect that was described in Footnote 4. The amplitude and latency of the N2pc component were largely invariant across set sizes. N2pc latency was measured from the contralateral waveforms and analyzed in a within-subjects ANOVA, with factors of set size and electrode site. N2pc latency was highly consistent across set sizes (204, 206, 206, and 204 ms for set sizes 1, 2, 3, and 4, respectively), and the main effect of set size was not significant, F ⬍ 1. Mean amplitude was also measured from these waveforms and did not vary significantly as a function of set size, F(3, 48) ⫽ 1.59, ns. Unlike N2pc latency, P3 latency (measured from contra-tochange minus no-change difference waves) increased as set size increased (376, 414, 426, and 439 ms for set sizes 1, 2, 3, and 4, respectively), leading to a significant main effect of set size, F(1, 16) ⫽ 16.96, p ⬍ .001. P3 amplitude did not differ significantly across set sizes, F ⬍ 1.
Discussion These results indicate that the detection of a difference between a VWM representation and a sensory input involves the use of both unlimited-capacity and limited-capacity processes. N2pc latency remained constant as the set size increased, indicating the existence of a process that can detect changes just as efficiently at a set size of four items as at a set size of one item. Moreover, the onset latency of the N2pc component in this experiment (⬇175 ms) was similar to the N2pc onset latency previously observed in visual search tasks in which the target was defined by the presence of a salient feature (e.g., Luck & Hillyard, 1994a, 1994b). We have replicated this result with set sizes as large as six items (Hyun, Woodman, Vogel, Niese, & Luck, 2003), but it is difficult to go much higher because the probability of the changed item being present in VWM decreases as the set size increases. Thus, the items from the sample array that are stored in VWM can be compared with the corresponding items from the test array rapidly and with no apparent capacity limitations.
Contralateral-to-Change
N2
N2
P3
P3
No-Change N2 P3
Set size 1 Set size 2 Set size 3 Set size 4 Figure 6. Grand average event-related potential waveforms for change and no-change trials averaged over the lateral occipital electrodes (OL and OR) in Experiment 2. Change trials are broken down into separate waveforms recorded at the electrode ipsilateral to the change and the electrode contralateral to the change. Error bars indicate within-subjects 95% confidence intervals.
VISUAL WORKING MEMORY COMPARISON
Ipsilateral-to-Change minus No-Change
1149
Contralateral-to-Change minus No-Change N2pc
OL/R P1
P3
P3 -3µV
-200
0
200
400
600
Set size 1 Set size 2 Set size 3 Set size 4
+3µV
Figure 7. Grand average difference waveforms from the lateral occipital (OL/OR) electrode sites in Experiment 2. These waveforms were created by subtracting no-change waveforms from ipsilateral-to-change or contralateral-to-change waveforms. The shaded area represents the N2pc component. Error bars indicate within-subjects 95% confidence intervals.
The pattern of N2pc results observed in the present experiment, in which N2pc latency and amplitude were constant across set sizes, was exactly like the pattern of results that was observed in a visual search experiment in which the target was defined by the presence of a distinctive feature (Luck & Hillyard, 1990). When the search target in that study was defined by the absence of a distinctive feature, however, the N2pc component ramped up more gradually and was smeared out in time. This pattern indicates that the amount of time between the onset of the search array and the shift of attention was highly variable, as would be expected for a limited-capacity search process (whether parallel or serial—see Townsend, 1990). In contrast, the N2pc component in the present experiment had a sharp onset and a relatively short duration, as is typically observed for feature-present visual search targets. Thus, the detection of changes in change detection is very much like the detection of feature-presence targets in visual search. The P3 and RT results indicate that the initial detection of the changed item was followed by a second comparison process, one that becomes slower as the set size increases. As discussed earlier, a verification process may be necessary after attention is directed to the changed item to be certain (or aware) that this item was indeed different from the corresponding item in VWM. It is not obvious that this process should take longer when more items are present, because it would seem possible to simply compare the attended item with the corresponding VWM representation and not perform any comparisons with the other items. At this stage, however, the process of comparing a VWM representation with a sensory input may become slower when more information is present in VWM. Alternatively, observers may not limit the comparison process to the attended item but may recheck all of the items, even though this might seem inefficient (just as observers do not terminate the memory search process in the Sternberg memory-scanning paradigm until all items have been checked; see Sternberg, 1966, 1969). It is also worth considering why the system would bother performing the initial unlimited-capacity comparison process and shifting attention to the changed item if another limited-capacity
comparison process is going to be performed before a response is made. Although we can only speculate at this point, it is reasonable to suppose that the initial comparison process is used for low-level aspects of visually guided behavior, such as the control of eye movements, that occur largely outside of awareness. Consequently, the next experiment tests the hypothesis that observers can make eye movements to the changed item in a rapid and set-sizeindependent manner.
Experiment 3: Allocation of Overt Attention to the Changed Item It is well documented that eye movements and spatial attention are closely linked, with a shift of attention preceding each shift of gaze (Deubel & Schneider, 1996; Henderson, Pollatsek, & Rayner, 1989; Hoffman & Subramaniam, 1995; Irwin & Andrews, 1996; Kowler, Anderson, Dosher, & Blaser, 1995; Rayner, McConkie, & Ehrlich, 1978). In addition, the N2pc component typically precedes an eye movement to a visual search target (Luck et al., 1997). Moreover, previous research has shown that saccades are not delayed when limited-capacity central processes are devoted to another task, which distinguishes eye movements from manual button-press responses (Pashler, 1993). Thus, it is plausible that the unlimited-capacity comparison process that produces rapid, set-size-independent shifts of covert attention—as measured by the N2pc component— can also produce rapid, set-size-independent shifts of gaze toward the changed item in the change detection task. Such a finding would provide strong converging evidence for the existence of an unlimited-capacity comparison process that operates within the visuomotor system. Experiment 3 was designed to determine whether the onset latency for eye movements to a changed item varies across set sizes. We examined eye movement latencies by having observers perform a change-localization task rather than a change detection task. In this task, a color change was always present in the test array, and the observers were instructed to fixate the changed item as quickly and accurately as possible. We predicted that the onset
1150
HYUN, WOODMAN, VOGEL, HOLLINGWORTH, AND LUCK
time of the eye movement would remain relatively constant as the set size increased. We tested set sizes of 1, 2, 3, and 4 items. When a single item was present in the sample array, the location of the changed item in the test array was always the same as the location of the one item in the sample array. Consequently, observers could prepare an eye movement prior to the onset of the test array at set size 1, and no comparison process was necessary. Thus, the data at set size 1 were treated separately from the data at set sizes 2, 3, and 4.
Saccade-onset latency was measured as the time between the onset of the test array and the onset of the saccade on correctresponse trials (after excluding trials according to the criteria described above). As is typical in eye movement studies, we will report the onset time of the saccade rather than the completion time. We also measured completion time, which produced the same pattern of results because saccades are ballistic and the duration of the saccade itself did not differ among conditions.
Results
Discussion The results from this experiment are largely consistent with the N2pc results from Experiment 2, showing that the time required
(A)
300
100 Slope = 12.2 ms/item
200 50 100
0
Error Rate (% incorrect)
Mean Saccade-Onset Latency (ms)
Participants. Ten college students between ages 18 and 30 participated for course credit. They reported normal color vision, normal or corrected-to-normal visual acuity, and no history of neurological disorders. Stimuli and procedure. Stimuli were presented on a CRT monitor with a gray background (15.93 cd/m2) and a continuously visible black fixation point at a viewing distance of 70 cm. Each memory array consisted of one, two, three, or four colored circles with a radius of 0.74°. The circles were placed at a randomly selected subset of the four corners of a notional 12.5° ⫻ 12.5° square, which was centered at fixation. A set of seven colors was used: white (76.12 cd/m2), red (x ⫽ .522, y ⫽ .277, 15.86 cd/m2), blue (x ⫽ .158, y ⫽ .069, 10.19 cd/m2), green (x ⫽ .320, y ⫽ .501, cd/m2), black (⬍ 0.01 cd/m2), yellow (x ⫽ .427, y ⫽ .466, 64.21 cd/m2), and violet (x ⫽ .302, y ⫽ .140, 23.02 cd/m2). Each item in the sample array was selected at random, without replacement, from this set. Each trial began when the participant fixated the central fixation point. After a 1,000-ms delay, the sample array was presented for 100 ms, followed by a 900-ms blank delay. The test array was then presented; it was identical to the sample array, except that one item changed to a new color that was not present in the sample array. The participant was instructed to fixate the changed item; speed and accuracy were stressed equally. Once the changed item was fixated, a bright green box appeared immediately around the changed item, even if multiple fixations were required to reach it. The test array was terminated approximately 300 ms after the correct location was fixated. Recording and data analyses. For monitoring eye position, a pupil-based eye tracker (ISCAN ETL-400; ISCAN Inc., Burlington, VT) was used with sampling rate at 240 Hz. Saccades were defined as changes in eye position exceeding 31°/s. Trials were excluded from the analyses if the eye position never reached one of the colored circles, if the eye position was already at the location of the changed item when the test array appeared (fast guess), or if the eye tracker lost track of the eye position. Fast guesses occurred frequently at set size 1, leading to a high rejection rate (44%), but the rejection rate was substantially lower for set sizes 2– 4 (13%) and did not vary significantly among these set sizes ( p ⬎ .18). Saccades toward a target object often fall short of the target, and such saccades are followed by an automatic corrective saccade to the actual target. We excluded such trials, which accounted for 12.7% of the trials that were not already excluded for one of the reasons described above. However, the pattern of results was nearly identical if these trials were included.
As shown in Figure 8A, the error rate increased as set size increased, just as in Experiments 1 and 2, presumably because the changed item was less likely to have been stored in VWM at larger set sizes. A one-way ANOVA on set sizes 2– 4 indicated that this effect was significant, F(2, 18) ⫽ 12.35, p ⬍ .001. The error rate at set size 1 was near zero. Probability distributions for saccade-onset latency are shown for set sizes 2– 4 in Figure 8B. The distributions were highly overlapping, but the probability of fast saccades was somewhat higher at set size 2 and the probability of slow saccades was somewhat higher at set size 4. Mean saccade-onset latency increased slightly across set sizes 2, 3, and 4 (264, 275, and 288 ms, respectively), producing a slope of 12.2 ms/item. A one-way ANOVA indicated that this increase was significant, F(2, 18) ⫽ 7.26, p ⬍ .01. Mean saccade-onset latency was much faster at set size 1 (199 ms), presumably because observers could plan the saccade prior to the appearance of the test array.
0 2
3
4
Set size Proportion of Saccades (%)
Method
0.2
(B) Set size 2 Set size 3 Set size 4
0.1
0.0 0
200
400
600
Saccade Latency (ms)
Figure 8. (Panel A) Mean saccade-onset latency and error rate as a function of set size in Experiment 3. (Panel B) Probability density histograms for saccade-onset latency in Experiment 3. Error bars indicate within-subjects 95% confidence intervals.
VISUAL WORKING MEMORY COMPARISON
for the visuomotor system to detect and localize a change increases only slightly as the set size increases. Indeed, the size of this effect in the saccade latency data is in the same range as visual search slopes for ostensibly parallel visual search tasks (Treisman, 1988; Wolfe, 1994; Wolfe, Cave, & Franzel, 1989). Three factors may have contributed to the finding that the slope, while low, was clearly greater than zero. First, because a change/ no-change must be made for each item in the array (until a change is detected), the number of decisions increases as the set size increases, and this increases the number of opportunities to make an error for purely statistical reasons. Saccadic-onset latencies may therefore have increased at larger set sizes to minimize increases in the error rate (see Palmer, 1998, for a discussion of the contribution of this factor to visual search slopes). Second, because observers responded by making a saccade to the location of the changed item rather than making a simple change/no-change response, increases in the set size necessarily led to increases in the number of potential response alternatives, which has been known for decades to increase response latencies (Hick, 1952). Third, as the set size increased, the number of objects in the test array increased (which was not the case in Experiment 2). The increasing number of salient objects with onset occurring just prior to the saccade may have led to increased competition within the occulomotor system, slowing the onset of the eye movement. It should also be noted that because the N2pc component indicates the selection of one side of the stimulus array but not necessarily the specific changed object on that side, it is possible that the time required to find the specific changed object was influenced by set size to a greater extent than can be revealed by the N2pc component. This is a limitation of the ERP approach of Experiment 2, but it is not an issue in the present experiment. Together, the results of these two experiments provide strong evidence for the hypothesis that the detection of change is achieved by a high- or unlimited-capacity process. These results also provide further support for our general hypothesis, namely that the detection of a change in change-detection tasks is like the detection of a simple feature in visual search. The minimal effect of set size on saccade latency in the present experiment and on N2pc latency in Experiment 2 contrasts with the considerable effects of set size on manual RTs in Experiments 1 and 2. As discussed previously, this may indicate that a limitedcapacity process must occur before the presence of a change becomes available to high-level decision and response systems (and perhaps to awareness). However, there were a number of differences in the stimuli used in these experiments, making it difficult to compare the set size effects. Therefore, we conducted Experiments 4A and 4B to measure manual RTs using the same stimuli as in Experiment 3 and using a change-localization task rather than a change detection task.
Experiments 4A and 4B: Effects of Set Size on Manual RTs In Experiment 4A, observers made a manual changelocalization response by pressing one of four keys on a keyboard, arranged in a square to correspond with the four stimulus locations. Although this mapping was straightforward, it was still a mapping from a set of locations on the video monitor to a set of locations on the keyboard. In contrast, the eye movements in Experiment 3
1151
were made to the actual location of the change on the video monitor. In Experiment 4B, therefore, observers indicated the location of the changed item by touching the actual location on the video monitor; a touch screen was used to detect the responses. Observers began each trial by holding down the space bar on the keyboard with their index finger (which was intended to be analogous to fixating the fixation point at the beginning of each trial in Experiment 3), and they then moved this finger to the changed location as rapidly as possible once the test array appeared.
Method The methods for Experiments 4A and 4B were identical to those of Experiment 3, except as noted here. New groups of 10 observers participated in each experiment. In Experiment 4A, the observers initiated each trial by pressing and then releasing one of the four response keys. After a 1,000-ms delay, the sample array appeared for 100 ms, followed by a 900-ms delay and then the test array. When the test array appeared, the observers were instructed to press one of four keys on the numeric keypad of a computer keyboard to indicate which location contained the change. The assignment of keys to locations was 7 for upper left, 9 for upper right, 1 for lower left, and 3 for lower right. The index finger of the right hand was used for the 7 and 1 keys, and the middle finger of the right hand was used for the 9 and 3 keys. In Experiment 4B, the observers pressed the space bar on a keyboard with the dominant hand to initiate each trial, and they were instructed to keep pressing it until the test display appeared and they detected the change. They then touched the position of the change on the monitor. A touch screen (Magic-Touch KTMT-1700 USB-M; Keytec Inc., Garland, TX) was used to detect the response. In both experiments, speed and accuracy were stressed equally, and trials with incorrect responses were excluded from the RT analyses. RT was measured in two ways in Experiment 4B. First, movement-completion latency was defined as the time between the onset of the test array and the moment at which the finger touched the touch screen. Second, movement-onset latency was defined as the time between the onset of the test array and the moment at which the finger was lifted from the space bar. This latter measure is comparable to the saccade-onset latency measure used in Experiment 3, which was defined as the amount of time between the onset of the test array and the initiation of the saccade away from the fixation point. However, whereas saccades are largely ballistic, pointing responses are not. As a result, observers in Experiment 4B could have lifted their finger from the space bar before deciding on a target location, which would lead to an underestimate of the time required to detect the change. Both measures are reported here to provide a complete picture of performance.
Results Figure 9 summarizes mean error rates and mean RTs from Experiments 4A and 4B, and Figure 10 shows the RT histograms for these experiments. Experiment 4A. In Experiment 4A, accuracy declined as set size increased, presumably because not all of the items were present in VWM at the larger set sizes. A one-way ANOVA
HYUN, WOODMAN, VOGEL, HOLLINGWORTH, AND LUCK
(A) Experiment 4A (Button Press) Experiment 4B (Touchscreen)
3
4
Set size
(B)
Experiment 4B Movement Completion (66.6 ms/item)
Experiment 4A Button Press (50.2 ms/item)
Experiment 4B Movement Onset (28.1 ms/item)
Figure 9. (Panel A) Mean localization error rate as a function of set size in Experiments 4A (triangles) and 4B (circles). (Panel B) Mean localization latencies for button-press responses in Experiment 4A (triangles) for releasing the space bar to begin the response in Experiment 4B (squares), and for touching the screen in Experiment 4B (circles). Error bars indicate within-subjects 95% confidence intervals.
including set sizes 2, 3, and 4 indicated that this effect was significant, F(2, 18) ⫽ 17.2, p ⬍ .01. Mean RT increased substantially across set sizes 2, 3, and 4 (580, 650, and 680 ms, respectively), with a best-fit linear slope of 50.2 ms/item. A one-way ANOVA indicated that these differences were statistically significant, F(2, 18) ⫽ 34.4, p ⬍ .001. Probability distributions are shown in Figure 10A; the primary effect of increased set size was a rightward shift in these distributions. Mean RT was much smaller at set size 1 (317 ms) than at the larger set sizes, and the mean error rate was only 0.3%; these fast and accurate responses presumably reflect the fact that observers knew the location for the response prior to the onset of the test array at set size 1. Experiment 4B. The results of Experiment 4B were similar to those of Experiment 4A. Accuracy declined as set size increased, and this effect was significant, F(2, 18) ⫽ 17.3, p ⬍ .001. Mean movement-onset latency increased across set sizes 2, 3, and 4 (340, 386, and 397 ms, respectively), with a slope of 28.1 ms/item. This effect was significant, F(2, 18) ⫽ 16.6, p ⬍ .001. The probability distributions shown in Figure 10B again primarily exhibit a rightward shift in the distribution at larger set sizes. However, all three of these set sizes included some very fast responses, which probably reflected trials on which participants released the space bar before actually determining the location of the changed item. Mean movement-completion latency increased across set sizes 2, 3, and 4 (1, 014, 1, 102, and 1, 147 ms, respectively), with a slope
Discussion The effect of set size on manual-response latencies in Experiments 4A and 4B was more than twice as great as the effect of set size on eye movement latencies in Experiment 3. Because these experiments were as similar as possible with the exception of the response modality, it is reasonable to conclude that a limitedcapacity process is interposed between the initial detection of a change and the initiation of a manual response. In contrast, eye movements can be triggered on the basis of a very high capacity or unlimited capacity-change detection process. This may be related to the finding that manual responses are slowed or postponed when central processes are occupied (in the psychological refractory period paradigm), whereas eye movement responses are not (Pashler, 1993). In both cases, a limited-capacity and presumably central process appear to be necessary for making a manual response but not for making an eye movement. Of interest, limitedcapacity central processes can apparently be circumvented for manual responses when the stimulus-response mappings are highly
Proportion of Trials (%)
2
of 66.6 ms/item. This effect was significant, F(2, 18) ⫽ 8.8, p ⬍ .01. The probability distributions shown in Figure 10C again primarily exhibited a rightward shift in the distribution at larger set sizes. The difference in latency between the onset of the movement and the completion of the movement was approximately 700 ms. For set size 1, the mean movement-onset latency was 273 ms, and the mean movement-completion latency was 901 ms. The mean error rate for set size 1 was 0.0%.
Proportion of Trials (%)
50 40 30 20 10 0
(A)
0.2
Set size 2 Set size 3
0.1 Set size 4
0.0 0
500 1000 1500 Mean button response time (ms)
2000
(B)
0.2
Set size 2 Set size 3
0.1
Set size 4 0.0 0
500
1000
1500
2000
Mean Movement Onset Time (ms)
Proportion of Trials (%)
Mean Error Rate
1152
(C)
0.2
Set size 2 Set size 3
0.1
Set size 4 0.0 0
500
1000
1500
2000
Mean Movement Completion Time (ms)
Figure 10. Probability density histograms for (Panel A) button-press latency in Experiment 4A, (Panel B) movement-onset latency in Experiment 4B, and (Panel C) movement-completion latency in Experiment 4B.
VISUAL WORKING MEMORY COMPARISON
overlearned (Hazeltine, Teague, & Ivry, 2002; Schumacher et al., 2001). Making an eye movement (or a shift of covert attention) to a target location is, of course, a highly overlearned response, and this may underlie the different patterns observed for manual and saccadic responses in the present study. The effect of set size was substantially greater for movementcompletion latency than for movement-onset latency. This suggests that observers often released the space bar before they were confident of their localization response, which is certainly plausible given that the difference between mean movement-onset latency and mean movement-completion latency was approximately 700 ms. This is also consistent with the finding that some of the movement-onset latencies were less than 200 ms (see Figure 10). Thus, the slope for the movement-onset measure is almost certainly an underestimate of the true effect of set size on the time required to make a decision about where to point.
Experiment 5: Do Changes Attract Attention Involuntarily? The previous experiments have shown that the presence of a change can be detected more efficiently than the absence of a change and that the presence of a change can be detected on the basis of an unlimited-capacity comparison process. These findings provide a strong analogy between the presence or absence of a change during change detection and the presence or absence of a distinctive feature during visual search. Experiment 5 was designed to explore an additional aspect of the analogy between change detection and visual search, namely the extent to which attention is drawn to the target involuntarily. In visual search, this issue has received considerable study. In a paradigm developed by Yantis and Jonides (1984), observers look for a visual target defined in one dimension, and one of the items in a given search array is different from the other items along a different dimension. For example, observers may search for the letter T among non-T distractor letters, and the letters might be drawn in green except for a single red item. When the target is more likely to be the red item than the green items, RTs become faster and less set-size-dependent when the target actually is the red item than when the target is one of the green items. When the red item is no more likely to be the target than any of the green items, however, Jonides and Yantis (1988) found that RTs were no different when the target happened to be red than when it happened to be green. Folk and his collaborators (Folk, Remington, & Johnston, 1992, 1993; Folk, Remington, & Wright, 1994) have proposed that this is due to the observer’s attentional set, which controls which features attract attention (see also Yantis & Egeth, 1999). That is, when observers are looking for a target defined by a particular dimension, discontinuities in that dimension will be particularly salient, and discontinuities in other dimensions will not involuntarily capture attention. Thus, the capture of attention depends on the task-relevance of a given feature dimension. This issue has also been addressed in ERP experiments that have asked whether a task-irrelevant singleton captures the variety of attention indexed by N2pc. Two studies have shown that a taskirrelevant singleton along one dimension (e.g., an orientation singleton when the target is a color singleton) will elicit little or no N2pc activity, whereas a task-relevant singleton along a different dimension (e.g., the color singleton target) will elicit a robust N2pc
1153
component (Luck & Hillyard, 1994a, 1994b). Thus, observers can restrict the allocation of this attention mechanism to task-relevant singletons (see also Hickey, McDonald, & Theeuwes, 2006). Experiment 5 addresses whether a change in a to-be-ignored dimension will elicit an N2pc component, which would indicate that the comparison process cannot be limited to a particular dimension. Observers performed either a color change-detection task or an orientation change-detection task, and changes along these two dimensions occurred independently in the test array (see Figure 11). That is, the test array could have no changes, only a color change, only an orientation change, or changes in both color and orientation. The observers were instructed to press one button when a change was detected in the relevant dimension and a different button if there was no change in that dimension, regardless of whether there was a change in the other dimension. This experimental design assumes that the observers will encode both dimensions of the object even though only one of the dimensions is relevant to the task. This assumption is indirectly supported by studies of object-based attention (Awh, Dhaliwal, Christensen, & Matsukura, 2001; Duncan, 1984), and it has been directly supported in the context of change detection (Hyun, 2006). The behavioral data from the present experiment can also provide support that the irrelevant dimension was encoded. Specifically, if the irrelevant dimension is encoded, then a change in the irrelevant dimension may cause the observer’s responses to be slowed.
Method The method for Experiment 5 was identical to that used in Experiment 2 except as noted. A new group of 14 students participated in Experiment 5 for monetary compensation. As illustrated in Figure 11, each sample array consisted of four bars (0.39° ⫻ 0.05°), and each bar was presented at a fixed position on a gray background that was 5.15° diagonally away from fixation, with one bar in each quadrant. The color of each bar was selected at random, with replacement, from a set of seven colors: white (25.49 cd/m2), red (x ⫽ .625, y ⫽ .313, 8.05 cd/m2), blue (x ⫽ .202, y ⫽ .131, 6.64 cd/m2), green (x ⫽ .321, y ⫽ .545, 14.17 cd/m2), black (⬍ 0.01 cd/m2), yellow (x ⫽ .458, y ⫽ .445, 24.99 cd/m2), and violet (x ⫽ .324, y ⫽ .151, 4.72 cd/m2). The orienta-
Test (100 ms)
Sample (100 ms)
900 ms Figure 11. Example of a change trial in Experiment 5. In this example trial, one item changed in both color and orientation. Note that these two changes could have occurred in different items rather than in the same item. The task-relevant dimension was determined solely by instructions from the experimenter.
HYUN, WOODMAN, VOGEL, HOLLINGWORTH, AND LUCK
1154
tion of each bar was also selected at random, with replacement, from a set of four orientations (vertical, horizontal, 45°, 135°). Each trial consisted of a 100-ms sample array followed by a 900-ms blank delay interval and a 100-ms test array. The screen was then blank until the participant responded, and the response was followed by a blank intertrial interval, randomly varying between 550 ms and 750 ms. At the beginning of each block, the participant was told whether orientation or color would be the task-relevant feature for that block. The participant was asked to respond only to changes in that dimension and to ignore changes in the other dimension. For example, when color was the relevant dimension, participants indicated whether a color change occurred, irrespective of the presence or absence of an orientation change. A change could occur in the orientation of a bar (25%), in the color of a bar (25%), in both the color and orientation of a bar (25%), or in neither color nor orientation (i.e., no change; 25%). When both changed, the item that changed in one dimension was selected independently of the item that changed in the other dimension; consequently, the same bar changed along both dimensions on 25% of the both-change trials (i.e., on 6.25% of all trials). Accuracy was emphasized, but speed was not. Participants performed eight blocks of 128 trials, alternating between attendcolor and attend-orientation blocks. The starting feature alternated across participants. The recording and analysis procedures were identical to those of Experiment 2.
Results Behavioral results. Figure 12A summarizes the RT results from trials with correct responses. RTs were fastest for no-change trials and were approximately 40 ms slower for relevant-, irrelevant-, and both-change trials. This pattern of results was
(A)
Mean RT (ms)
1000 900 800
717
718
719
Irrelevant
Both
676 700 600 No change Relevant
Change Response (%)
Trial types
(B)
100
70.4
67.9 50
8.8
7.1 0 No change
Relevant
supported by a two-way ANOVA with factors of relevant change presence and irrelevant change presence, which yielded an interaction between these two factors, F(1, 13), p ⬍ .01. Follow-up t tests in which the no-change RTs were compared with the average of the three types of change RTs indicated that the no-change RTs were significantly faster than the change RTs, t(13) ⫽ 3.17, p ⬍ .01. This is another example of the classic fast-same effect. In addition, an ANOVA on the three types of change trials indicated that the differences among them were not significant, F ⬍ 1. Moreover, a planned comparison of the no-change and irrelevantchange RTs indicated that RTs were significantly slower on irrelevant-change trials than on no-change trials, t(13) ⫽ ⫺4.21, p ⬍ .01. Thus, the irrelevant changes must have been detected at some level of the system. The finding that RTs were slowed just as much by irrelevant changes as by relevant changes supports our assumption that the irrelevant dimension was stored in VWM. Accuracy is summarized in Figure 12B, which shows the proportion of trials on which participants made a “change” response for no-change, relevant-change, irrelevant-change, and both-change trials. Participants made a change response on approximately 70% of relevant-change and both-change trials, and they made a change response on less than 9% of irrelevant-change and no-change trials.8 Participants were slightly more likely to make a change response when an irrelevant change was present (i.e., on both-change trials compared with relevant-change trials and on irrelevantchange trials compared with no-change trials). An ANOVA with factors of relevant change presence and irrelevant change presence yielded a statistically significant main effect of irrelevant feature presence, F(1, 13) ⫽ 5.86, p ⫽ .031. This increase in change responses when an irrelevant change was present provides further evidence that the irrelevant dimension was encoded in memory. However, the small size of this effect indicates that the comparison process can indicate which dimension changed and is not usually fooled by an irrelevant-dimension change. To explore these behavioral effects further, we conducted a follow-up behavioral experiment in which irrelevant-change and both-change trials contained a change along the irrelevant dimension in all four items, thus increasing the opportunity to observe an effect of these changes on behavior.9 The presence of irrelevant changes led to an even greater slowing in this experiment (79 ms) than in Experiment 5 (42 ms). Moreover, the probability of a change response was 14% on irrelevant-change trials compared with only 5% on no-change trials, a significant difference, F(1, 15) ⫽ 32.8, p ⬍ .001. Thus, the irrelevant dimension was clearly encoded by the participants even though it was maladaptive to do so.
Irrelevant
Both
Trial types
Figure 12. Mean reaction time (RT; Panel A) and mean percentage of change responses (Panel B) for each trial type in Experiment 5. The number on top of each bar represents the mean for that trial type. Error bars indicate within-subjects 95% confidence intervals.
8 It should be noted that overall accuracy in Experiment 5 was lower than previously reported for color or orientation change detection tasks with a set size of 4. For example, previous studies using four colored bars reported that participants typically make a change response on approximately 90% of one-change trials and on approximately 5% of no-change trials (Luck & Vogel, 1997; Vogel et al., 2001). This suggests that restricting change detection to a single dimension is more difficult than detecting changes irrespective of dimension. 9 Sixteen students received course credit for participating in this experiment. When a change was present in the relevant dimension, only one item changed. When a change was present in the irrelevant dimension, all four items changed. This experiment was identical to Experiment 5 in all other respects.
VISUAL WORKING MEMORY COMPARISON
Electrophysiological results. Figure 13 shows difference waves constructed by subtracting the no-change ERP waveforms from the waveforms for each type of change trial. A clear N2pc component was present at sites contralateral to the changed item when the change occurred along the relevant dimension (relevantchange and both-change trials), but little or no N2pc activity was observed on irrelevant-change trials. An ANOVA was conducted on the mean amplitude between 200 ms and 300 ms in the contralateral-minus-no-change difference waves with factors of trial type (relevant-change, irrelevant-change, both-change), and electrode site (O1/O2, OL/OR, T5/T6).10 A main effect of trial type was observed, F(2, 26) ⫽ 3.45, p ⬍ .05, confirming the observation that N2pc amplitude varied significantly among the different kinds of change trials. This analysis was followed up with ANOVAs comparing relevant-change trials to irrelevant-change and no-change trials. These ANOVAs indicated that irrelevantchange trials elicited a significantly smaller N2pc than relevantchange trials, F(1, 13) ⫽ 8.18, p ⬍ .05, but there was no significant difference between relevant-change and both-change trials, F ⬍ 1. Although relevant-change trials elicited a larger N2pc than irrelevant-change trials, close inspection of the difference waveforms in Figure 13 reveals a small amount of N2pc activity for irrelevant-feature trials. However, when the contralateral-minusno-change activity was compared with the ipsilateral-minus nochange activity, with electrode site as a second factor, this small difference was not significant, F(1, 13) ⫽ 3.28, p ⫽ .09. Thus, if any shifts of attention were triggered by changes in the irrelevant dimension, these shifts must have been small or infrequent.
1155
Discussion These results suggest that the process of comparing working memory representations with new perceptual inputs is, to a large extent, a controlled operation, even though it also appears to be an unlimited-capacity operation. This provides yet another similarity between the allocation of attention to a change in change-detection tasks and the allocation of attention to a simple feature in visual search tasks, which is also under voluntary control under similar conditions. This does not mean, however, that changes in the irrelevant dimension were not noticed at all (just as observers in visual search experiments may notice the presence of an irrelevant feature singleton even if spatial attention is not directed to it). Observers required more time to make a no-change response when an irrelevant-dimension change was present than when it was absent, and the presence of an irrelevant-dimension change also increased the probability of making a change response. Of interest, this same general pattern of results was observed in Egeth’s (1966) original study of perceptual comparison. These effects may reflect that the second, limited-capacity comparison process that we have proposed follows the initial, unlimited-capacity comparison process. This second comparison process may involve a more deliberative comparison between the VWM representation (which contains both dimensions) and the visual input, and this process may be slowed when a change in the irrelevant dimension is present. Observers certainly report being aware of these changes on a substantial fraction of trials, and this may lead to conflict at the stage of response selection. That is, the presence of a change in the irrelevant dimension may partially activate the change response, slowing the initiation of the no-change response.
General Discussion
Contralateral minus No-change
Ipsilateral minus No-change
N2pc OL/OR
Relevant* Both* Irrelevant**
Naturally occurring visually guided behavior presumably involves frequent comparisons between the contents of VWM and the current sensory input, allowing us to notice similarities and differences between consecutive views of the environment that are interrupted by blinks, saccades, and occlusions. The change detection task is designed to simulate this aspect of natural visual function, but very little change-detection research has addressed the mechanisms that perform the comparisons. The goal of the present study was to provide some initial steps toward characterizing these mechanisms.
Similarities Between Change Detection and Visual Search
Time after test onset (ms)
Figure 13. Grand average difference waveforms from the lateral occipital (OL/OR) electrode sites in Experiment 5. These waveforms were created by subtracting no-change waveforms from waveforms recorded contralateral or ipsilateral to a changed item. Both-change trials sometimes contained a relevant change on one side and an irrelevant change on the other side, and the waveforms shown here were sorted on the basis of the side of the relevant change, irrespective of the side of the irrelevant change (which had little or no effect on the waveform). Error bars indicate within-subjects 95% confidence intervals.
As discussed in the Introduction, the change-detection task can be considered as a special case of the visual search paradigm, in which the observer searches for a target item in the test array that 10
The fact that no-change trials are neither ipsilateral nor contralateral makes it impossible to do the kind of factorial analysis that was performed for the behavioral data. In addition, the fact that both change trials could contain two changes on the same side or one change on each side further constrained the analysis. Thus, we simply examined the contralateralminus-no-change difference waves for the three kinds of changes, and contralateral was defined relative to the relevant feature for the both change trials.
1156
HYUN, WOODMAN, VOGEL, HOLLINGWORTH, AND LUCK
is defined as being different from the corresponding item in the sample array. In this context, the present study provides evidence that the presence of a change in change detection is analogous to the presence of a simple and unique feature in visual search. Four similarities were found between changes in change detection and features in visual search. First, just as visual targets defined by the presence of a feature can be detected much more efficiently than targets defined by the absence of a feature (Treisman, 1988; Treisman & Souther, 1985), Experiment 1 showed that the presence of a difference between the sample and test arrays can be detected much more efficiently than the absence of a difference. Specifically, detection of the critical feature was faster and more accurate in the any-difference task than in the any-sameness task, and the slope of the function relating RT to set size was more than twice as great for the any-sameness task than for the any-difference task.11 A second similarity is that the presence of a difference in change detection leads to a shift of covert attention to the changed item, as reflected by the presence of an N2pc component contralateral to the location of the change in Experiment 2. Attention also shifts to feature singleton targets in visual search, as demonstrated in both behavioral and ERP studies (Kim & Cave, 1995; Luck & Hillyard, 1994b, 1995). Feature integration theory proposes that attention should be unnecessary for the detection of feature-defined targets (Treisman, 1988), but observers may focus attention onto feature targets even if this is not strictly necessary. Indeed, the N2pc for feature targets is eliminated if observers perform a concurrent attention-demanding task at fixation, and yet the observers are still able to detect the targets (Luck & Ford, 1998). We cannot yet say whether observers would be able to accurately perform change detection tasks without focusing attention onto the changed item. This would be an interesting avenue for future research. A third similarity is that the presence of a change in a change detection task can be detected by means of an unlimited-capacity parallel process, just like the presence of a feature singleton in visual search. In Experiments 2 and 3, we found that the slopes relating N2pc latency and saccade-onset time to set size were very low, in the range usually attributed to unlimited-capacity parallel processing in visual search (Wolfe, 1998). Manual reaction time slopes in Experiments 1, 4A, and 4B were not nearly as flat; possible reasons for this finding will be described in a later section. The finding that differences can be detected by an unlimitedcapacity parallel process, leading to rapid shifts in covert or overt attention, suggests that these differences may be important in everyday visually guided behavior. These differences may occur in the context of eye movements, for example, when a memory of the presaccade input in VWM is compared with the postsaccade input to integrate the pre- and postsaccade information (Currie et al., 2000; Henderson & Hollingworth, 1999) or when the visual system tries to determine whether a saccade actually brought the correct item into the center of gaze (Hollingworth et al., 2008). It should be noted that a lack of capacity limitations for a given process does not mean that this process is perfectly accurate (see Palmer et al., 1993). In the case of VWM comparisons, previous studies have shown that observers may fail to report changes even though the information was encoded in memory (Mitroff et al., 2004; Simons et al., 2002). In addition, the magnitude of the difference between the sample and test items may impact the likelihood that the change is detected, just as the salience of a
feature will influence RT slopes in parallel visual search tasks (Palmer, 1998; Treisman, 1988). Our conclusions are based on a comparison of slopes for manual RTs, saccade-onset times, and ERP latencies, and it is worth considering whether slope values for these various measures can be directly compared. That is, is a 10 ms/item slope for N2pc latency or saccade-onset time directly comparable to a 10 ms/item slope for RT? As long as set size primarily influences the time required to find the target and not later processes such as response selection, the effects of set size should be identical for these different measures, and the slopes should be directly comparable. Most studies of visual search implicitly assume this, and it is also supported by an ERP study in which nearly identical visual search slopes were observed for RT and for P3 latency (Luck & Hillyard, 1990), which is a measure of stimulus evaluation time that is not influenced by postperceptual factors such as response selection time. A fourth similarity between changes in change detection and features in visual search is that in both cases, attention can be limited to specific feature dimensions. In the domain of typical visual search tasks, this has been worked out in detail in the context of Wolfe’s guided search model (Wolfe, 1994; Wolfe et al., 1989) and related theories (Cave, 1999; Folk et al., 1992; Treisman & Sato, 1990). In addition, a robust N2pc component is observed for objects containing relevant features but not for feature singletons defined by an irrelevant dimension (Luck & Hillyard, 1994a). Experiment 5 showed this same pattern in change detection, showing that the N2pc component was much larger in response to relevant-dimension changes than in response to irrelevant-dimension changes. A small and statistically insignificant N2pc was observed for the irrelevant-dimension changes, but small N2pc effects are also observed for irrelevant-dimension feature singletons in visual search (Luck & Hillyard, 1994b). These small N2pc effects may simply reflect occasionally lapses in selectivity.
Limited- and Unlimited-Capacity Comparison Processes in Change Detection Although measures of covert and overt attention showed little or no slowing as the set size increased in Experiments 2 and 3, moderately high slopes were observed for manual response times in Experiments 1, 4A, and 4B. These various latency measures are summarized together in Figure 14, which shows that the slope ranges from 0.0 ms/item for N2pc latency in Experiment 2 to 66.6 11
Treisman and Gormican (1988) noted that the asymmetries observed for feature-present and feature-absent visual search tasks can be understood in terms of the Weber fraction, and the same analysis can be applied to the present data. That is, if the presence of a change is the signal detected by the nervous system, then the any-difference condition requires observers to distinguish between 0 and 1 units of this signal, whereas the any-sameness condition requires observers to distinguish between 4 and 3 units of this signal. The Weber fraction is greater for making a comparison between 0 and 1 units of a signal than between 3 and 4 units, and this will naturally make it easier to detect a single critical feature in the any-difference task than in the any-sameness task. Note, however, that this explanation of the differences between the any-difference and any-sameness tasks assumes that the presence of a change is the signal detected by the nervous system, which is exactly our conclusion.
Mean response onset time (ms)
VISUAL WORKING MEMORY COMPARISON 4B: Movement Completion (66.6 ms/item)
1: Button Press (50.3 ms/item) 4A: Button Press (50.2 ms/item)
4B: Movement Onset (28.1 ms/item) 3: Saccade Onset (12.2ms/item) 2: N2pc Latency (0.0 ms/item)
Figure 14. Summary of the latency measures from Experiments 1, 2, 3, 4A, and 4B, along with linear regression lines and slope values.
ms/item for movement completion latency in Experiment 4B. Even though the manual response task in Experiment 4B was made as similar as possible to the saccade task in Experiment 3, the slope was more than twice as great for manual responses as for saccades. To explain this pattern of results, we propose that an unlimitedcapacity comparison process triggers shifts of covert and overt attention but that a limited-capacity process follows this unlimitedcapacity process before a manual response can be made. The need for this limited-capacity process arises from a key difference between the change detection task and typical visual search tasks: a shift of attention to the changed item does not bring the change itself into the focus of attention in change detection, whereas a shift of attention to a target feature does bring the feature itself into the focus of attention in visual search. In visual search, bringing the target feature into the focus of attention may directly activate a response that has been associated with the target. This is not possible in change detection because the changed item is not itself a target and is not directly associated with a response. For example, if an item was red in the sample array and yellow in the test array, attention would be shifted to the yellow item. However, the color yellow is not directly linked to the change response. Thus, additional processing may be necessary to verify that the nowattended item is actually different from the corresponding VWM representation, and this processing may involve a limited-capacity consideration of all the items in the test array, all the representations stored in VWM, or both. It should be noted that under some conditions, a limited-capacity process may be necessary following the detection of a simple feature in visual search tasks. For example, Joseph, Chun, and Nakayama (1997) used a visual search task as the second task in an attentional blink experiment. They observed the typical attentional blink pattern—an impairment in performance for the second task when it occurs shortly after the first task—whether the visual search task involved feature detection or conjunction discrimination. This result indicates that some aspect of the feature detection task was limited in capacity and therefore subject to interference
1157
from the first task (see also Dell’Acqua, Sessa, & Jolicoeur, 2006; Jolicoeur, Sessa, & Dell’Acqua, 2006). It is possible that the different pattern of results for shifts of attention and manual responses is due, in part, to different levels of experience. Overt and covert shifts of attention are made to the location of a target object thousands of time each day, whereas button-press responses and pointing responses are relatively rare. A similar difference between these two classes of responses has been observed in the psychological refractory period paradigm, where dual-task interference is minimal when the second of two responses is an overt or covert shift of attention (Pashler, 1991; Pashler, Carrier, & Hoffman, 1993). When shifts of attention are not made directly to the target, however, and are made to a symbolically cued location, interference is restored. Thus, the need for a limited-capacity process may be eliminated under the conditions that typically lead to automaticity (e.g., frequently occurring and consistently mapped stimulus–response pairings). The general issue of dissociations between manual responses and shifts of attention has been discussed by Hunt, von Mu¨hlenen, and Kingstone (2007), who pointed out that manual responses typically occur substantially later than shifts of covert and overt attention. As a result, different information is available at the times of these different responses, and this can lead to different effects of various experimental manipulations. In the cases examined by Hunt et al., sudden onsets led to strong occulomotor capture but had little or no effect on manual responses, presumably because the visual system was able to discount the effects of the onsets by the time of the manual response. Under these conditions, as under most simple experimental conditions, the passage of additional time before the manual response allows for greater efficiency in the manual responses. In the present study, however, exactly the opposite pattern was observed, with greater efficiency (as measured by shallower slopes) for the eye movements and the N2pc measure of covert attention than for the manual responses. This may indicate that the change signal fades as time passes following the onset of the test array. That is, if the test array overwrites the memory representation of the sample array, then the change signal should be maximal near the onset time of the test array. By the time of the manual response, this signal may have faded enough that limited-capacity processes become necessary to make the correct response. This is closely related to the idea that shifting attention to the changed item does not bring the change itself into the focus of attention, as discussed earlier.
Summary This study has explored several new questions about the processes by which VWM representations are compared with sensory inputs, and it has provided initial answers to many of these questions. It has linked the VWM comparison process to a largely forgotten literature on perceptual comparisons. It has shown how the change detection task can be fruitfully studied as a special case of visual search in which changes are analogous to simple features. It has shown that changes can be detected by means of an unlimited-capacity comparison process, which can be used to direct covert and overt attention but that manual responses depend on a limited-capacity process. Finally, it has shown that the unlimited-capacity comparison process can be limited to specific feature dimensions. Because these findings address, for the most
1158
HYUN, WOODMAN, VOGEL, HOLLINGWORTH, AND LUCK
part, previously unexplored questions about VWM and change detection, it will not be surprising if future studies lead to refinements and revisions of these proposals. However, the issues, hypotheses, and methods that were developed in this study can provide a starting point for future efforts at understanding this important aspect of visual cognition and visually guided behavior.
References Alvarez, G. A., & Cavanagh, P. (2004). The capacity of visual short-term memory is set both by information load and by number of objects. Psychological Science, 15, 106 –111. Awh, E., Dhaliwal, H., Christensen, S., & Matsukura, M. (2001). Evidence for two components of object-based selection. Psychological Science, 12, 329 –334. Bacon, W. F., & Egeth, H. E. (1994). Overriding stimulus-driven attentional capture. Perception and Psychophysics, 55, 485– 496. Baddeley, A. D. (1986). Working memory. Oxford, UK: Clarendon. Cave, K. R. (1999). The FeatureGate model of visual selection. Psychological Research, 62, 182–194. Chelazzi, L., Duncan, J., Miller, E. K., & Desimone, R. (1998). Responses of neurons in inferior temporal cortex during memory-guided visual search. Journal of Neurophysiology, 80, 2918 –2940. Currie, C., McConkie, G., Carlson-Radvansky, L. A., & Irwin, D. E. (2000). The role of the saccade target object in the perception of a visual stable world. Perception and Psychophysics, 62, 673– 683. Dell’Acqua, R., Sessa, P., & Jolicoeur, P. (2006). Spatial attention freezes during the attentional blink. Psychophysiology, 43, 394 – 400. Deubel, H., & Schneider, W. X. (1996). Saccade target selection and object recognition: Evidence for a common attentional mechanism. Vision Research, 36, 1827–1837. Dixon, P., & Shedden, J. M. (1993). On the nature of the span of apprehension. Psychological Research, 55, 29 –39. Duncan, J. (1984). Selective attention and the organization of visual information. Journal of Experimental Psychology: General, 113, 501– 517. Egeth, H. (1966). Parallel versus serial processing in multidimensional stimulus discrimination. Perception and Psychophysics, 1, 245–252. Farell, B. (1985). “Same”–“different” judgments: A review of current controversies in perceptual comparisons. Psychological Bulletin, 98, 419 – 456. Folk, C. L., Remington, R. W., & Johnston, J. C. (1992). Involuntary covert orienting is contingent on attentional control settings. Journal of Experimental Psychology: Human Perception and Performance, 18, 1030 –1044. Folk, C. L., Remington, R. W., & Johnston, J. C. (1993). Contingent attentional capture: A reply to Yantis (1993). Journal of Experimental Psychology: Human Perception and Performance, 19, 682– 685. Folk, C. L., Remington, R. W., & Wright, J. H. (1994). The structure of attentional control: Contingent attentional capture by apparent motion, abrupt onset, and color. Journal of Experimental Psychology: Human Perception and Performance, 20, 317–329. Gentner, D., & Namy, L. (1999). Comparison in the development of categories. Cognitive Development, 13, 487–513. Gold, J. M., Fuller, R. L., Robinson, B., McMahon, R. P., Braun, E. L., & Luck, S. J. (2006). Intact attentional control of working memory encoding in schizophrenia. Journal of Abnormal Psychology, 115, 658 – 673. Gold, J. M., & Green, M. F. (2005). Neurocognition in schizophrenia. In B. J. Sadock & V. A. Sadock (Eds.), Kaplan & Sadock’s comprehensive textbook of psychiatry: Vol. I (8th ed., pp. 1436 –1448). Philadelphia: Lippincott, Williams, & Wilkins. Hazeltine, E., Teague, D., & Ivry, R. B. (2002). Simultaneous dual-task performance reveals parallel response selection after practice. Journal of
Experimental Psychology: Human Perception and Performance, 28, 527–545. Henderson, J. M., & Hollingworth, A. (1999). The role of fixation position in detecting scene changes across saccades. Psychological Science, 10, 438 – 443. Henderson, J. M., Pollatsek, A., & Rayner, K. (1989). Covert visual attention and extrafoveal information use during object identification. Perception & Psychophysics, 45, 196 –208. Hick, W. E. (1952). On the rate of gain of information. Quarterly Journal of Experimental Psychology A, 4, 11–26. Hickey, C., McDonald, J. J., & Theeuwes, J. (2006). Electrophysiological evidence of the capture of visual attention. Journal of Cognitive Neuroscience, 18, 604 – 613. Hoffman, J. E., & Subramaniam, B. (1995). The role of visual attention in saccadic eye movements. Perception and Psychophysics, 57, 787–795. Hollingworth, A. (2003). Failures of retrieval and comparison constrain change detection in natural scenes. Journal of Experimental Psychology: Human Perception and Performance, 29, 388 – 403. Hollingworth, A., Richard, A. M., & Luck, S. J. (2008). Understanding the function of visual short-term memory in human cognition: Transsaccadic memory, object correspondence, and gaze correction. Journal of Experimental Psychology: General, 137, 163–181. Hopf, J.-M., Luck, S. J., Boelmans, K., Schoenfeld, M. A., Boehler, C. N., Rieger, J., & Heinze, H.-J. (2006). The neural site of attention matches the spatial scale of perception. Journal of Neuroscience, 26, 3532–3540. Hopf, J.-M., Luck, S. J., Girelli, M., Hagner, T., Mangun, G. R., Scheich, H., & Heinze, H.-J. (2000). Neural sources of focused attention in visual search. Cerebral Cortex, 10, 1233–1241. Hopf, J.-M., Vogel, E. K., Woodman, G. F., Heinze, H-J., & Luck, S. J. (2002). Localizing visual discrimination processes in time and space. Journal of Neurophysiology, 88, 2088 –2095. Hunt, A. R., von Mu¨hlenen, A., & Kingstone, A. (2007). The time course of attentional and oculomotor capture reveals a common cause. Journal of Experimental Psychology: Human Perception and Performance, 33, 271–284. Hyun, J.-S., & Luck, S. J. (2009). Linking change detection to perceptual comparisons. Manuscript in preparation. Hyun, J.-S. (2006). How are visual working memory representations compared with perceptual inputs? Iowa City, IA: University of Iowa. Hyun, J.-S., Woodman, G. F., Vogel, E. K., Niese, A. T., & Luck, S. J. (2003). How are visual inputs compared with memory representations in the change-detection paradigm? [Abstract]. Journal of Vision, 3, 322a. Irwin, D. E., & Andrews, R. V. (1996). Integration and accumulation of information across saccadic eye movements. In T. Inui & J. L. McClelland (Eds.), Attention and performance XVI: Information integration in perception and communication (pp. 125–155). Cambridge, MA: MIT Press. Isreal, J. B., Chesney, G. L., Wickens, C. D., & Donchin, E. (1980). P300 and tracking difficulty: Evidence for multiple resources in dual-task performance. Psychophysiology, 17, 259 –273. Jennings, J. R., & Wood, C. C. (1976). The e-adjustment procedure for repeated-measures analyses of variance. Psychophysiology, 13, 277– 278. Jiang, Y., Olson, I. R., & Chun, M. M. (2000). Organization of visual short-term memory. Journal of Experimental Psychology: Learning, Memory, and Cognition, 2, 683–702. Johnson, J. S., Hollingworth, A., & Luck, S. J. (2008). The role of attention in the maintenance of feature bindings in visual short-term memory. Journal of Experimental Psychology: Human Perception and Performance, 34, 41–55. Jolicoeur, P., & Dell’Acqua, R. (1998). The demonstration of short-term consolidation. Cognitive Psychology, 36, 138 –202. Jolicoeur, P., Sessa, P., & Dell’Acqua, R. (2006). Attentional control and
VISUAL WORKING MEMORY COMPARISON capture in the attention blink paradigm: Evidence from human electrophysiology. European Journal of Cognitive Psychology, 18, 560 –578. Jonides, J., & Yantis, S. (1988). Uniqueness of abrupt visual onset in capturing attention. Perception and Psychophysics, 43, 346 –354. Joseph, J. S., Chun, M. M., & Nakayama, K. (1997, June 19). Attentional requirements in a “preattentive” feature search task. Nature, 387, 805– 808. Kim, M.-S., & Cave, K. R. (1995). Spatial attention in visual search for features and feature conjunctions. Psychological Science, 6, 376 –380. Kok, A. (2001). On the utility of P3 amplitude as a measure of processing capacity. Psychophysiology, 38, 557–577. Kowler, E., Anderson, E., Dosher, B., & Blaser, E. (1995). The role of attention in the programming of saccades. Vision Research, 35, 1897– 1916. Luck, S. J. (1998). Sources of dual-task interference: Evidence from human electrophysiology. Psychological Science, 9, 223–227. Luck, S. J. (2005). An introduction to the event-related potential technique. Cambridge, MA: MIT Press. Luck, S. J. (2008). Visual short-term memory. In S. J. Luck & A. Hollingworth (Eds.), Visual memory (pp. 43– 85). New York: Oxford University Press. Luck, S. J., & Ford, M. A. (1998). On the role of selective attention in visual perception. Proceedings of the National Academy of Science of the United States of America, 95, 825– 830. Luck, S. J., Girelli, M., McDermott, M. T., & Ford, M. A. (1997). Bridging the gap between monkey neurophysiology and human perception: An ambiguity resolution theory of visual selective attention. Cognitive Psychology, 33, 64 – 87. Luck, S. J., & Hillyard, S. A. (1990). Electrophysiological evidence for parallel and serial processing during visual search. Perception and Psychophysics, 48, 603– 617. Luck, S. J., & Hillyard, S. A. (1994a). Electrophysiological correlates of feature analysis during visual search. Psychophysiology, 31, 291–308. Luck, S. J., & Hillyard, S. A. (1994b). Spatial filtering during visual search: Evidence from human electrophysiology. Journal of Experimental Psychology: Human Perception and Performance, 20, 1000 –1014. Luck, S. J., & Hillyard, S. A. (1995). The role of attention in feature detection and conjunction discrimination: An electrophysiological analysis. International Journal of Neuroscience, 80, 281–297. Luck, S. J., & Vogel, E. K. (1997, November 20). The capacity of visual working memory for features and conjunctions. Nature, 390, 279 –281. Mitroff, S. R., Simons, D. J., & Levin, D. T. (2004). Nothing compares 2 views: Change blindness can occur despite preserved access to the changed information. Perception and Psychophysics, 66, 1268 –1281. Nunez, P. L. (1981). Electric fields of the brain. New York: Oxford University Press. Palmer, J. (1998). Attentional effects in visual search: Relating search accuracy and search time. In R. D. Wright (Ed.), Visual attention (Vol. 8, pp. 348 –388). New York: Oxford University Press. Palmer, J., Ames, C. T., & Lindsey, D. T. (1993). Measuring the effect of attention on simple visual search. Journal of Experimental Psychology: Human Perception and Performance, 19, 108 –130. Pashler, H. (1991). Shifting visual attention and selecting motor responses: Distinct attentional mechanisms. Journal of Experimental Psychology: Human Perception and Performance, 17, 1023–1040. Pashler, H. (1993). Dual-task interference and elementary mental mechanisms. In D. E. Meyer & S. Kornblum (Eds.), Attention and performance XIV: Synergies in experimental psychology, artificial intelligence, and cognitive neuroscience (pp. 245–264). Cambridge, MA: MIT Press. Pashler, H., Carrier, M., & Hoffman, J. E. (1993). Saccadic eye movements and dual-task interference. Quarterly Journal of Experimental Psychology, 46A, 51– 82. Rayner, K., McConkie, G. W., & Ehrlich, S. (1978). Eye movements and
1159
integrating information across fixations. Journal of Experimental Psychology: Human Perception & Performance, 4, 529 –544. Rensink, R. A. (2000). Visual search for change: A probe into the nature of attentional processing. Visual Cognition, 7, 345–376. Rensink, R. A. (2002). Change detection. Annual Review of Psychology, 53, 245–277. Rensink, R. A., O’Regan, J. K., & Clark, J. J. (1997). To see or not to see: The need for attention to perceive changes in scenes. Psychological Science, 8, 368 –373. Schumacher, E. H., Seymour, T. L., Glass, J. M., Fencsik, D. E., Lauber, E. J., Kieras, D. E., & Meyer, D. E. (2001). Virtually perfect time sharing in dual-task performance: Uncorking the central cognitive bottleneck. Psychological Science, 12, 101–108. Scott-Brown, K. C., Baker, M. R., & Orbach, H. S. (2000). Comparison blindness. Visual Cognition, 7, 253–267. Sekuler, R. W., & Abrams, M. (1968). Visual sameness: A choice time analysis of pattern recognition processes. Journal of Experimental Psychology, 77, 232–238. Simons, D. J., Chabris, C. F., & Schnur, T. (2002). Evidence for preserved representations in change blindness. Consciousness and Cognition, 11, 78 –97. Simons, D. J., & Rensink, R. A. (2005). Change blindness: Past, present, and future. Trends in Cognitive Sciences, 9, 16 –20. Spencer, J. P., & Hund, A. M. (2002). Prototypes and particulars: Spatial categories are formed using geometric and experience-dependent information. Journal of Experimental Psychology: General, 131, 16 –37. Sternberg, S. (1966, August 5). High-speed scanning in human memory. Science, 153, 652– 654. Sternberg, S. (1969). Memory scanning: Mental processes revealed by reaction time experiments. American Scientist, 57, 421– 457. Taylor, D. A. (1976). Effect of identity in the multiletter matching task. Journal of Experimental Psychology: Human Perception and Performance, 2, 417– 428. Theeuwes, J. (1993). Visual selective attention: A theoretical analysis. Acta Psychologica, 83, 93–154. Theeuwes, J. (1994). Stimulus-driven capture and attentional set: Selective search for color and visual abrupt onsets. Journal of Experimental Psychology: Human Perception and Performance, 20, 799 – 806. Theeuwes, J. (2004). No blindness for things that do not change. Psychological Science, 15, 65–70. Townsend, J. T. (1990). Serial vs. parallel processing: Sometimes they look like Tweedledum and Tweedledee but they can (and should) be distinguished. Psychological Science, 1, 46 –54. Treisman, A. (1988). Features and objects: The fourteenth Bartlett memorial lecture. Quarterly Journal of Experimental Psychology, 40, 201– 237. Treisman, A., & Gelade, G. (1980). A feature-integration theory of attention. Cognitive Psychology, 12, 97–136. Treisman, A., & Gormican, S. (1988). Feature analysis in early vision: Evidence from search asymmetries. Psychological Review, 95, 15– 48. Treisman, A., & Sato, S. (1990). Conjunction search revisited. Journal of Experimental Psychology: Human Perception and Performance, 16, 459 – 478. Treisman, A., & Souther, J. (1985). Search asymmetry: A diagnostic for preattentive processing of separable features. Journal of Experimental Psychology: General, 114, 285–310. Vickery, T. J., King, L.-W., & Jiang, Y. (2005). Setting up the target template in visual search. Journal of Vision, 5, 81–92. Vogel, E. K. (2000). Selective storage in visual working memory: Distinguishing between perceptual-level and working memory-level mechanisms of attention. Iowa City, IA: University of Iowa. Vogel, E. K., McCollough, A. W., & Machizawa, M. G. (2005, November 24). Neural measures reveal individual differences in controlling access to working memory. Nature, 438, 500 –503.
1160
HYUN, WOODMAN, VOGEL, HOLLINGWORTH, AND LUCK
Vogel, E. K., Woodman, G. F., & Luck, S. J. (2001). Storage of features, conjunctions, and objects in visual working memory. Journal of Experimental Psychology: Human Perception and Performance, 27, 92–114. Vogel, E. K., Woodman, G. F., & Luck, S. J. (2006). The time course of consolidation in visual working memory. Journal of Experimental Psychology: Human Perception and Performance, 32, 1436 –1451. Wilken, P., & Ma, W. J. (2004). A detection theory account of change detection. Journal of Vision, 4, 1120 –1135. Wolfe, J. (1994). Guided search 2.0: A revised model of visual search. Psychonomic Bulletin & Review, 1, 202–238. Wolfe, J., Cave, K. R., & Franzel, S. L. (1989). Guided search: An alternative to the feature integration model for visual search. Journal of Experimental Psychology: Human Perception and Performance, 15, 419 – 433. Wolfe, J., & Horowitz, T. S. (2004). What attributes guide the deployment of visual attention and how do they do it? Nature Reviews Neuroscience, 5, 495–501. Wolfe, J. M. (1998). Visual search. In H. Pashler (Ed.), Attention (pp. 13–73). Hove, UK: Psychology Press/Erlbaum/Taylor & Francis. Woodman, G. F. (2002). The involvement of visual working memory in visual search. Unpublished dissertation, University of Iowa, Iowa City.
Woodman, G. F., & Luck, S. J. (1999, August 26). Electrophysiological measurement of rapid shifts of attention during visual search. Nature, 400, 867– 869. Woodman, G. F., & Luck, S. J. (2003a). Dissociations among attention, perception, and awareness during object-substitution masking. Psychological Science, 14, 605– 611. Woodman, G. F., & Luck, S. J. (2003b). Serial deployment of attention during visual search. Journal of Experimental Psychology: Human Perception and Performance, 29, 121–138. Yantis, S., & Egeth, H. E. (1999). On the distinction between visual salience and stimulus-driven attentional capture. Journal of Experimental Psychology: Human Perception and Performance, 25, 661– 676. Yantis, S., & Jonides, J. (1984). Abrupt visual onsets and selective attention: Evidence from visual search. Journal of Experimental Psychology: Human Perception and Performance, 10, 601– 621.
Received March 29, 2007 Revision received January 15, 2008 Accepted January 24, 2008 䡲