Nov 2, 2004 - The Danger of Interval-Based Power Efficiency. Metrics: When Worst Is Best. Yiannakis Sazeides*, Rakesh Kumar. +. , Dean M. Tullsen. +.
The Danger of Interval-Based Power Efficiency Metrics: When Worst Is Best Yiannakis Sazeides �, Rakesh Kumar , Dean M. Tullsen , and Theofanis Constantinou � � Department of Computer Science Department of Computer Science and Engineering University of Cyprus, Nicosia University of California, San Diego Abstract— This paper shows that if the execution of a program is divided into distinct intervals, it is possible for one processor or configuration to provide the best power efficiency over every interval, and yet have worse overall power efficiency over the entire execution than other configurations. This unintuitive behavior is a result of a seemingly intuitive use of power efficiency metrics, and can result in suboptimal design and execution decisions. This behavior may occur when using the energy-delay product and energy-delay¾ product metrics but not with the energy metric.
I. I NTRODUCTION Power is increasingly becoming a limiting design factor. High peak power can compromise the correctness of a highend processor, whereas high energy may limit battery life for mobile/embedded devices. Thus, virtually any processor, from embedded to the most aggressive, is designed to optimize some combination of power and performance. To help measure and compare power efficiency, several metrics have been proposed. One of the first proposed power efficiency metrics was the energy-per-operation [3], also seen in its inverse form, the millions of instructions per second per Watt (MIPS/Watt) metric. This represents the performance achieved per consumed watt. For many systems, however, performance is more critical than this metric accounts for. Consequently, other metrics such as the energy-delay product (EDP) [4] and energy-delay product (ED P) [2], have been proposed to emphasize performance more strongly. The various power efficiency metrics are widely used by the architectural research community to compare and quantify the quality of new ideas related to power. This work shows that a seemingly intuitive use of the EDP and ED P metrics can result in unintuitive behavior when applied to virtually any interval-based optimization. Selecting the best configuration or processor at each interval (based on a particular metric) may result in a solution that is far from the optimal. In fact, we show that even when a single processor or configuration has the best power efficiency over every interval, another configuration may have the best power efficiency over the entire execution. This behavior, referred to henceforth as best-worst-behavior (BWB), has significant implications for any interval-based or adaptive optimization. BWB was observed experimentally in [5] where a singleISA heterogeneous multi-core architecture is proposed as the means to reduce power. In [5], it is stated that even under perfect knowledge of the delay and energy characteristics at the granularity of intervals, choosing the core that minimizes This work has been supported by the University of Cyprus, Intel, HiPEAC, and NSF grant CCR-0311683. Manuscript submitted: 2 Nov. 2004. Manuscript accepted: 22 Dec. 2004. Final manuscript received: 7 Jan. 2005.
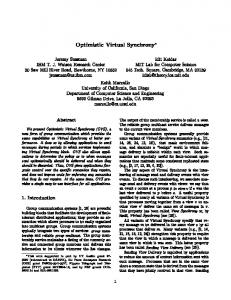
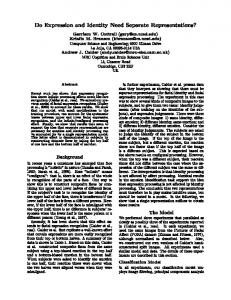
the EDP over each interval may not give an optimal powerefficiency solution. However, BWB was not clearly defined and neither its causes nor its ramifications were discussed. This paper presents an example where BWB is observed when using the EDP metric (Section II). It explains the reason for this behavior and shows that it can also occur with the ED P but not the energy metric (Section III and Section IV). Finally, it discusses some implications of BWB and provides direction for future work (Section V). II. E XAMPLE S CENARIO WITH BWB This section describes a scenario where the best-worstbehavior (BWB) is observed when using the EDP. Consider the dual-core heterogeneous-chipmultiprocessor [6] shown in Fig. 1 that aims to increase power efficiency by having only one of the two cores active at a time, and by transferring the execution of a process from one core to the other when it is likely the execution on the new core will be more power efficient. A core may represent a better match for a given program phase because each core can include different resources or may be clocked at a different frequency. To determine the power-efficiency limits of the above approach an experimental study was performed based on the sim-wattch [1] simulator using SPEC95 and SPEC2000 benchmarks. Each benchmark was run for the first four billion instructions using reference inputs. Each core was modeled using the default sim-wattch out-of-order processor with the key core parameters taking the values shown in Fig. 1. The cores are out-of-order processors clocked at the same frequency, but core P1 has a simpler branch predictor and smaller data cache, issue width, and number of execution units. Thus P1 provides lower performance but consumes less power than P2. The somewhat exaggerated data cache configuration of P2 is chosen for illustrative purposes. Core switches take place at fixed-size intervals of committed instructions and the switch decisions are made with oracle knowledge of which of the two cores has lower EDP for that interval. The study assumed that there is no performance or energy penalty for core switches (either for the transfer or cold start effects) and that an inactive core does not consume energy. It should also be noted that in the case of time-based intervals the problem is very similar, but the demonstration and derivation of the problem is simplified by this definition of an interval. Under these assumptions, one might expect to achieve better (or no worse) power efficiency than running on either of the
L2$
I$
D$
P1
I$
D$
P2
EDP (Joules.seconds)
290 p1 p2 dual-core
285 280 275 270 265 1M
core D$ Width IntALU Branch Pred P1 8KB 2 2 Bimodal 2KB P2 128KB 4 4 Gshare 2KB Fig. 1.
A Heterogeneous Dual-Core Chip Multiprocessor
2M
4M
8M
16M
32M
64M
128M
Interval Size(Instr.)
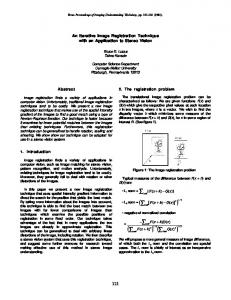
Fig. 2.
Power efficiency with and without core transfers for gzip
1.03 gcc95 bzip00 gzip00
1.02
EDP (Normalized)
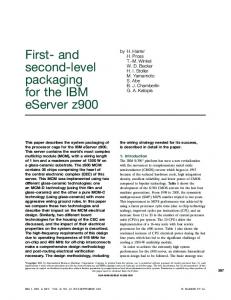
cores alone, and that the smaller the intervals, the closer we approach to an optimal solution. As demonstrated in the following experiments, neither of these expectations are necessarily true. To illustrate this counter-intuitive behavior, consider Fig. 2 that shows the results for benchmark gzip. The graph shows the power efficiency when executing only on core P1, only on core P2, and dual-core under oracle-driven switches. The performance for the dual-core is shown for different interval sizes. Power efficiency is reported in terms of EDP. The lower the EDP the better the power efficiency. The data show that for several interval sizes the power efficiency of the dual-core option is worse than running only on P1. This, therefore, demonstrates that BWB can occur. Specifically, by dividing an execution of program gzip into distinct intervals processor P1 has for each interval same or worse power efficiency as compared to the dual-core system, but P1 has overall better power efficiency. The root cause for the BWB behavior is hidden in the definition of the EDP metric and in what it means to optimize it. These issues are discussed in the next section. BWB behavior was observed for many other benchmarks and interval sizes. Fig. 3 shows the dual-core’s EDP with changing interval size for representative benchmarks. The reported EDP is normalized to the EDP produced when executing only on core P1. The majority of points have normalized EDP value greater than one and correspond to instances of BWB. The remaining points represent cases where the dual-core had same or better performance than P1. Fig. 3 reveals distinct trends with decreasing interval size depending on the benchmark. The EDP improves with smaller interval size for bzip, remains relatively unchanged for gcc, and worsens for gzip. The trend of gzip is unintuitive because it suggests that more frequent per-interval oracle decisions can lead to worse power efficiency. The behavior with changing interval size is the subject of Section IV. To further establish that BWB is not the result of an overly contrived scenario, Table I shows an example with only two intervals, and variance between the intervals below 5%. Yet the oracle is suboptimal in EDP by about 10%. While it is equally easy to demonstrate cases where the oracle is correct, the simplicity of this example should create concern for the generality of this problem.
1.01 1.00 0.99 0.98 0.97 1M
2M
4M
8M
16M
32M
64M
128M
Interval Size(Instr.)
Fig. 3. Normalized Power efficiency of the Dual-Core with changing interval size for various benchmarks
III. O PTIMIZING THE Energy-Delay Product This section examines the definition of the EDP metric, in particular, and explains the cause of the BWB. The EDP for a given program execution can be computed using the expression �� where � and � correspond to the energy and time spent to execute the program. If a program execution is broken up into a series of � distinct instruction intervals then the overall EDP can be obtained by the formula:
��
�� �� �
��
�� �� �
(1)
where �� and �� represent the energy and time spent for the ��� interval. When for each program interval there are several choices for energy and delay behavior, such as with adaptive architectures, then the overall minimum EDP can be determined by choosing the �� s that solve the following: � � � � ��� �� � ��� �� �� (2)
�
�
where �� denotes the configuration for interval �. However, when making interval-by-interval decisions, we instead minimize: � � � � (3) ��� �� �� ��
�
While a solution of equation (2) clearly minimizes (1), a solution of equation (3) may not (as demonstrated in Section II). That is, decisions that minimize the per-interval EDP
TABLE I E XAMPLE WHERE THE DYNAMIC SELECTION OF THE CORE WITH BEST POWER EFFICIENCY LEADS TO WORSE POWER EFFICIENCY THAN EITHER CORE
Interval 1 2 Overall
E 1 1 2
P1 t 4 4.1 8.1
EDP 4 4.1 16.2
E 2 2 4
P2 t 2.1 2 4.1
EDP 4.2 4 16.4
Best EDP Core P1 P2 (1+2)x(4+2)=18
may not minimize the overall EDP. Therefore, locally optimal decisions can possibly lead to BWB behavior. To illustrate the differences between the equations (2) and (3), consider the case where energy and delay are constant across two intervals (total time ��, total energy ��, where � and � now represent the time and energy for a single interval). If all intervals are identical, the global sum equates to ���, and the interval sum to ���, different by only a factor (the number of intervals). If, however, one interval has energy � � and delay � � , the global sum is � � � � � � � � � �, i.e. ��� � �� � �� � . The interval sum (multiplied by the factor) is ��� � �� � �� � � . Thus, it has overstated the relative impact of the term by a factor of two. If we had 1000 intervals, the term would be overstated by a factor of 1000. Thus, the bound on the potential difference between the two formulations grows with the number of intervals, and a reasonably long program, even assuming coarse OS time-slice intervals, could have millions of intervals. This example assumes variance in only one interval. If all intervals vary, the bound on the potential difference between the two formulations can be even greater. The BWB behavior can potentially occur with just about any interval-based metric where the overall value is not computed as the sum of the metric values for each interval. This means that the BWB can occur with the ED P metric which is computed as
�
� �
�
��� � �� ��� � � but not with the energy metric that is computed as �
�
��� � since it consists only of a single term, and the total is the additive combination of all interval measurements. We have chosen the heterogeneous multiple-core architecture to demonstrate this problem, because the dramatic power difference between reconfigurations highlights the problem. However, this is a problem for any adaptive mechanism whose goal is to balance power/energy and performance. This is relevant to many previous interval-based proposals including cache reconfiguration, dynamic voltage scaling, instruction queue reconfiguration, fetch throttling, upsizing/downsizing optimizations, etc. The architectures and optimizations are not at fault. Any adaptive architecture has the ability to improve on (or in the worst case not worsen) a static architecture. The point of this paper is that the metrics and mechanisms used to control adaptations so that (1) performance/power is optimized, or even (2) guarantee that we do not make matters worse, are poorly understood.
BWB may also occur when comparing the power efficiency across benchmarks. Specifically, it is possible for a processor or configuration to have the best power efficiency for each benchmark but across all benchmarks to have worse power efficiency than some other configuration. This is analogous to a situation where power efficiency is optimized per interval with the difference that each interval corresponds to a distinct benchmark. This suggests that when reporting power efficiency using EDP or ED P it may be useful to report the overall power efficiency across all benchmarks. IV. B EHAVIOR WITH C HANGING I NTERVAL S IZE In Section II we observed trends in power-efficiency, as we varied the interval size, that appeared to be somewhat unpredictable and in some cases unintuitive. We attribute those effects to be due to one or both of the following factors: (a) the frequency the high power core (P2) is selected with, and (b) the global effects on power-efficiency when using the high energy core. The first claim is supported by the data in Fig. 4 that shows the fraction of intervals that are executed on core P2 with changing interval size. A clear correlation can be established with Fig. 3: (a) for gcc where power-efficiency is relatively insensitive to the interval size, smaller intervals do not lead to an increase execution on core P2, and (b) for gzip and bzip where changing interval size means change in powerefficiency, smaller intervals result in a larger fraction of the execution on core P2. Nevertheless, execution frequency on core P2 is not sufficient to explain the opposite trends observed in Fig. 3 for gzip and bzip. The second claim can provide a basis to explain this behavior. To support the second claim on a simpler example, we will use the same scenario as in Section II with two heterogeneous cores P1 and P2. We assume that the interval behavior can be divided into two categories, fast and slow, and that an interval is either fast on both cores or slow on both. Further, it is assumed that the delay on P2 is t for a fast interval and 2.5t for a slow interval, and on P1 is 2.5t for a fast and 3t for a slow. Finally, we assume that each core consumes constant energy per interval, � for P1 and �� for P2. Therefore, if there are � intervals and the fraction of fast intervals is x, the EDP for P1 is given by the expression ��� � �� � � �� �
�� �
that after simplification is equal to: � �� �
� � �
and similarly the EDP for P2 is given by: � �� �
� ��
Based on the above assumptions, P2 has better per-interval power efficiency for the fast intervals and P1 is better for the slow. If the execution was transfered to P2 for fast intervals and to P1 for slow then the EDP with dual-core will be given by the expression: � �
�� � �� � � �� �
�� � � � �
5
gcc95 bzip00 gzip00
50
Energy-Delay Product (k2et)
Execution on core P2 (% intervals)
60
40 30 20 10
4.5
3.5 3 2.5 2
0
0
1M
Fig. 4.
P1 P2 dual-core
4
2M
4M
8M
16M
32M
64M
128M
Fraction of Execution on core P2 as a function of Interval Size
which when simplified becomes: � ��
� � � ��
(4)
Fig. 5 shows the EDP for three switching policies: always choose P1, always choose P2 and dual-core, which uses the policy described above (equation (4)). The EDP of each policy is plotted as a function of the fraction of fast intervals. The data show clearly that P1 is a better choice than P2 unless the fraction of fast intervals is more than 80%. More interesting is the behavior of the interval-optimized dual-core policy. As the number of fast intervals grows its EDP is initially increasing and getting worse as compared to P1. When the frequency of the fast intervals grows further, over 25%, the adaptive policy’s EDP starts improving. However it remains worse than P1 until the amount of fast interval becomes more than 75%. When the range of fast intervals is between 75%-90% the interval-based policy offers better power efficiency than running on either core alone. This example only illuminates the behavior trend of gzip. However, a similar approach can be used to derive another scenario that explains the behavior trend of bzip. What is enlightening about the above result is that the nature of the individual intervals does not change, only the relative number of each type. Yet, the best policy changes from one extreme to the other. This highlights the fact that the optimal choice for any single interval cannot be determined without knowledge of the complete beginning-to-end behavior of the whole application. The results in [5] indicate that it is possible to find good policies for an adaptive architecture. However, we find here that finding the optimal, or upper bound, is much more difficult. This prevents us from fully understanding the potential of any of these architectures, as long as our measure of power efficiency is some multiplicative combination of energy and performance. The above does provide a direction for future work that aims for the development of on-the-fly heuristics that rely on estimates of long-term future behavior, combined with shortterm (next interval) estimates, to determine policies for an adaptive or configurable architecture. V. C ONCLUSIONS This work shows that the EDP and ED P metrics can exhibit the best-worst behavior (BWB) and can therefore lead
0.1
0.2
0.3
0.4
0.5
0.6
0.7
0.8
0.9
1
x (fraction of fast intervals)
Fig. 5.
EDP for a hypothetical interval behavior
to inferior performance. This happens when an adaptive or configurable architecture must make decisions at intervals on how to configure the architecture for the next interval. This has implications for virtually any adaptive or configurable power optimization, which would include most optimizations proposed so far by the architecture community. This work also shows that to establish the power efficiency limits of an adaptive design requires complete and future knowledge of application behavior. Furthermore, it is suggested that establishing optimality, even with complete knowledge, is not trivial. To avoid BWB when comparing designs using the EDP and ED P metrics, researchers and designers should not use per-interval (or per benchmark) calculations of these metrics. New policies need to be used that either try to optimize other metrics, or that use more global information to better estimate one interval’s impact on the global EDP (or other global metric). Finally, this paper points to two directions for future work. One is to develop off-line computationally efficient algorithms or heuristics that can determine or approximate the optimal power efficiency. Under certain conditions (regarding the statistical properties of the terms � � and �� of the interval behavior) it may be possible to establish the optimal power efficiency. The other direction is to develop on-the-fly heuristics that improve power efficiency decisions. R EFERENCES [1] D. Brooks, V. Tiwari, and M. Martonosi, “Wattch: A Frameowrk for Architectural-Level Power Analysis and Optimization,” in 27th International Symposium on Computer Architecture, June 2000, pp. 83–94. [2] D. Brooks, P. Bose, S. Schuster, H. Jacobson, P. Kudva, A. Buyuktosunoglu, J.-D. Wellman, V. V. Zyuban, M. Gupta, and P. W. Cook, “Power-Aware Microarchitecture: Design and Modeling Challenges for Next-Generation Microprocessors,” IEEE Micro, vol. 20, no. 6, pp. 26– 44, November/December 2000. [3] A. P. Chandrakasan, S. Sheng, and R. W. Brodersen, “Low-power Digital CMOS Design,” IEEE Journal of Solid State Circuits, vol. 27, no. 4, pp. 473–484, April 1992. [4] M. Horowitz, T. Indermaur, and R. Gonzalez, “Low Power Digital Design,” in IEEE International Symposium on Low Power Electronics, October 1994, pp. 8–11. [5] R. Kumar, K. Farkas, N. Jouppi, P. Ranganathan, and D. Tullsen, “SingleISA Heterogeneous Multi-Core Architectures: The Potential for Processor Power Reduction,” in 36th International Symposium on Microarchitecture, December 2003, pp. 81–92. [6] ——, “Processor Power Reduction Via Single-ISA Heterogeneous MultiCore Architectures,” Computer Architecture Letters, vol. 2, April 2003.


![ModelSim Tutorial - UCSD CSE [PDF]](https://m.moam.info/img/260x300/modelsim-tutorial-ucsd-cse-pdf_64799306098a9e495b8b45ed.jpg)