Apr 26, 1990 - Van der Zwaan, G.J., Jorissen, F.J. and De Stigter, H.C., 1990. The depth dependency of planktonic/benthic foraminiferal ratios: Constraints and ...
Marine Geology, 95 (1990) 1-16
1
Elsevier Science Publishers B.V., Amsterdam
The depth dependency of planktonic/benthic foraminiferal ratios: Constraints and applications G.J. van der Zwaan, F.J. Jorissen and H.C. de Stigter Department of Geology, Institute of Earth Sciences, University of Utrecht, Budapestlaan 4, 3508 TA Utrecht, The Netherlands (Received N o v e m b e r 15, 1989; revision accepted April 26, 1990)
ABSTRACT Van der Zwaan, G.J., Jorissen, F.J. and De Stigter, H.C., 1990. The depth dependency of planktonic/benthic foraminiferal ratios: Constraints and applications. Mar. Geol., 95: 1-16. Study of the ratio between planktonic and benthic foraminifera in a great number of areas shows that variation of this ratio with depth can be described using organic matter flux equations. Essentially, the share of benthic foraminifera in the total association is inversely proportional to depth, as is the amount of organic matter resulting from primary productivity reaching the sea bottom. • Variation in the P/B ratio from area to area appears to be strongly dependent on the amount ofinbenthic living foraminifera. If the ratios are corrected for this, the regressions between the proportion of planktonic foraminifera (%/') and depth appear to be near-identical in the Gulf of Mexico, the Gulf of California, the west coast of the USA and the Adriatic Sea. This regression can be described by: Depth = e ~3"ss7is + (o.o3saa.%/,D A study of the behaviour of this function in nine cores from the Adriatic Upper Quaternary reveals that the palaeodepth reconstructions are not influenced by fluctuations in productivity and temperature but that they are significantly influenced by redeposition of fine-grained deposits.
Introduction Palaeobathymetry is of growing importance in palaeoceanography and basin analysis, its main importance being in the reconstruction of the uplift and subsidence history of sedimentary basins. In addition to this, increasing attention is being paid to the construction of sea-level curves. This followed the first publication (Vail et al., 1977) pertaining to the until then unknown and unappredated magnitude and rhythm of relative sea-level movements. Although the model originally put forward by Vail et al. has been contested (e.g. Cloetingh et al., 1985; Cloetingh, 1988), this first attempt to evaluate the magnitude and effects of relative sea-level movements has functioned as a catalyst for further research (e.g. Haq et al., 1988). In this context it is not surprising that the demand 0025-3227/90/$03.50
for more accurate palaeobathymetrical techniques has increased. However, this demand has by no means been satisfied. The presently most widely employed and probably most accurate palaeobathymetrical techniques are of a micropaleontological nature. In these techniques, use is made of the distribution patterns of mainly benthic species, which in younger Cenozoic deposits are mostly foraminifera or ostracods. Although a reasonable consensus has been developed concerning the notion that benthic species are roughly arranged along a depth gradient, it is evident that a number of problems prevent accurate reconstructions of palaeobathymetry: (1) There is only a little understanding of the fundamental factors which decide the ultimate bathymetric distribution of benthic species. (2) Bathymetric ranges of species differ consider-
© 1990 - - Elsevier Science Publishers B.V.
2
ably from area to area, apparently depending on rather badly defined and poorly understood factors. A good example is provided by the so-called delta-depressed or delta-elevated species described by Pflum and Frerichs (1976). (3) There is no consensus as to whether species are isobathyal in time or whether they may be able to change their bathymetrical range through time. The implicit assumption in most palaeobathymetrical analyses is that species, or even homeomorphic species, inhabit constant depth ranges through time. However, there is evidence that following particular environmental changes some species have changed their depth habitats (e.g. Douglas and Woodruff, 1981; Miller, 1982). The need for a better quantitative measure of palaeodepth stimulated the search for tools other than species distribution patterns. In 1955, Grimsdale and Van Morkhoven published their classical study on the application of the ratio between planktonic and benthic foraminifera (P/B ratio) in palaeodepth reconstructions. Their work followed the study of Phleger (1951), who also pointed to the relationship between P/B ratios and depth, They found that the proportion of planktonic foraminifera of the total association (P) increased fairly systematically towards deeper water. In spite of the general tendency of increasing P-values with depth, Grimsdale and Van Morkhoven (1955) observed an extremely wide data scatter. Later, the P/B ratio was applied in a number of studies (e.g. Uchio, 1960; Poag, 1972; Kafescioglu, 1 9 7 5 ; Murray, 1976; Van Marie et al., 1987). Although the P/B ratio seemed to be a fair measure of depth in nearly all cases, the scatter in P-values versus depth in modern environments (Parker, 1 9 5 4 ; Uchio, 1960;Wilcoxon, 1964; Lutze, 1974)remains a worrying factor, rendering the method difficult to apply, In this paper we will present P/B data from a number of areas and discuss their application to palaeobathymetry. Most of these data are derived from the literature. We will discuss the sources of the wide data scatter and present a refined method for quantitatively using the P/B-ratio elaborating upon the results of Berger and Diester-Haass (1988). In this method we will stress the dependence of the abundance of benthic foraminifera on
G.J. van tier Z W A A N ET AL.
the organic flux exported from the photic zone. In numerical experiments we will show the effects of variation in this flux on foraminiferal abundance patterns. The ratio between planktonic and benthic foraminifera There is no clear consensus in the literature regarding the cause of the increase in the number of planktonic foraminifera (P) with depth (or, more precisely, with increasing distance from the coast) (Berger and Diester-Haass, 1988). However, the reason for the increase is partly evident: with increasing distance from the coast the turbidity decreases, enabling primary production to increase. Furthermore, the complex pelagic ecosystern, with many nutrient chains and recycling loops, is only fully developed at a certain water depth encompassing the total photic zone (Rohling and Gieskes, 1989). With a continued increase in water depth the mesopelagic and bathypelagic planktonic foraminifera enter the ecosystem (Hemleben and Spindler, 1983; Hemleben et al., 1989), thus completing the pelagic system and adding to the total pelagic biomass. As the input of nutrients from the continent decreases, one would expect the pelagic biomass to decrease again at a certain distance from the coast. The benthic biomass follows less predictable patterns, sometimes being extremely high in unexpected places such as in anoxic basins (e.g. Uchio, 1960; Phleger and Soutar, 1973). The general pattern, however, is that the benthic foraminiferal number increases from the nearshore area to the continental edge; further seaward it decreases rather drastically towards low values at bathyal depths (compare Douglas and Woodruff, 1981). In many respects the benthic biomass and thus the benthic foraminiferal number follows the global distribution pattern of organic carbon in the sediment (Romankevich, 1984; Pearson and Rosenberg, 1987) which is highest in shelf seas and at the continental edge, and rapidly decreasing towards greater depths. In this respect, both the benthic and planktonic foraminiferal abundance patterns appear to be to a great extent a function of food and nutrients. Many other factors, such as
THE DEPTH DEPENDENCYOF PLANKTONIC/BENTHICFORAMINIFERALRATIOS
temperature, salinity, substrate and circulation pattern also play a role, but in most cases clearly a subordinate one (compare Pearson and Rosenberg, 1987). Berger and Diester-Haass (1988) used the planktonic/benthic feraminiferal ratio as a productivity index. They showed that the flux of primary produced organic matter plays a crucial role in this respect. If we assume that the main source of food for benthic organisms consists of organic matter raining down through the water column, the amount reaching the bottom at a particular depth can be calculated by:
J(d) = (k.PP/d)+ (r'PP) (1) where J(d) is the amount of organic matter arriving at the bottom, k and r are constants, d is the water depth/100 and PP the primary production (see Suess, 1980; Berger and Diester-Haass, 1988). Berger and Diester-Haass argue that the second term is of no importance in this context. It represents the amount of refractory organic matter and r is close to 0.01. The first term indicates the amount of non-refractory organic matter arriving
3
at the bottom at depth D. They estimate the export factor k at about 0.2, instead of the original estimate of Suess of 0.4. In our further reasoning we will assume that the number of planktonic foraminiferal tests is propordonal to the primary production and that the number of benthic foraminifera is proportional to J(d). The term (k.PP) would then be equivalent to (k.(number of planktonic foraminifera)) and reprosent the export productivity. This is evidently a simplification, but at the moment we find it an acceptable assumption. However, before these terms in the equation can be replaced by their biotic counterparts, another problem must be solved, i.e. how efficient benthic foraminifera are compared with planktonic foraminifera in the use of food. Clearly, it is not acceptable to assume that from a given amount of food the same number of progeny arises for planktonic and benthic foraminifera alike. We must take an efficiency factor into account, which is estimated by Berger and DiesterHaass to be about 3; i.e. benthic foraminifera are three times more efficient in the use of organic matter than planktonic foraminifera are as second-
Benthos productivity ot K = 0 . 2 ~ P o t K-- 0 . 2 - 0.6 ~ P o t K = O . 4 ond E= 3 - 4
100~
0.6
-
•
N
-
50g -
~ / /
/
25~ '
100
1000
2000
3000 metres
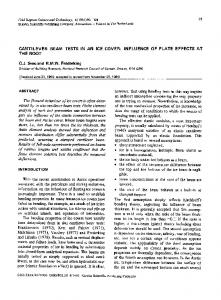
Depth Fig. 1. Relationship between number o f benthic foraminifera, % P and depth, calculated on the basis o f the ,/(d) equation and constant primary productivity. The % P versus depth relationship is calculated for k = 0.2-0.6 and for k = 0.4 with varying efficiency factors E = 3-4. For explanation, see text.
4
G.J. van der ZWAANET AU
ary producers. We calculated various options for k and efficiency factor E (Fig.l). From this figure it appears that the calculated percentage of planktonic foraminifera in the total association follows a semi-linear relationship with Ln(D) at depths greater than 100 m. As stated earlier, Berger and Diester-Haass assume the export factor to be 0.2, instead of the original 0.4 estimated by Suess. The different factors of k, however, have a relatively minor effect on the proportion of planktonic foraminifera in the total association• It should be appreciated that Eppley and Peterson (1979) and Betzer et al. (1984) propose that the export factor k is dependent on PP. For instance, the relationship described by Betzer et al. would result in a variation in k from about 0.2 to 0.3 under conditions of intermediate to high-primary productivity• For the time being, we also consider this variation in k to be of no importance. Although various models estimate different export productivities, the decay below the mixed layer is described by all as essentially inversely proportional to depth, From the J(d) equation it follows that the P/B
ratio varies directly with depth, because it can be rewritten as: D = IO0.k.P/B (2) From the value of the %P in Fig.1 it follows that in deeper waters the values of the P/B ratio strongly increase and eventually approach infinity• This implies that in the depth range of 0-1000 m the P/B ratio increases from 0 to 10, but then rapidly from 20 to oo. Regression analysis is strongly influenced by this tail. Moreover, the P/B ratio in this depth range is highly sensitive to small changes in B, which could easily be artificial and induce inaccuracy. Therefore, we decided to use the %P instead of the P/B ratio. From Fig. 1 it is clear that in the greater part of the depth range below 1500 m the relationship between depth and %P is almost log-linear and can be described as: Ln(D)=a+b.%P (3) This type of equation was earlierempirically found by Wright (1977) and employed by Van Marie et al. (1987).
.L2
'100 7
~-g
"6
-g
~
"6
~o
-
o
~
-~
• W
CD
LLJ
3=: z
w
~
o
~
:~
3=
o
i
90 80 7O 60
~
50 40 30 20 10 I
500
I
I
1000
1500
I
2000
I
2500
metres
Depth Fig.2. Regression curves of % P versus depth 13ased on the following data: Western Australia (Betjeman, 1969); northeastern coast of the USA (Kafe~ioglu, 1975); e,~tern Gulf of Mexico (Parker, 1954); southeastern coast of the USA (Wilcoxon, 1964); Mediterranean (Parker, 1958; Todd, 1958; Jorissen, 1988); western Gulf of Mexico (Phleger, 1951); Gulf of California (Uchio, 1960). For regression analysis, the general equation Ln(D)= a + b ' % P was used.
THE DEPTH DEPENDENCY
OF PLANKTONIC/BENTHIC
FORAMINIFERAL
RATIOS
In Fig.2 we have depicted a number of curves of % P versus depth derived from various areas. For sake of convenience we have depicted the curves here on a non-logarithmic depth scale to better demonstrate the gradual variation in regression from area to area. The regressions have varying degrees of correlation, most being significant but showing an extremely great data scatter. What is more worrying is the difference in regression from area to area, which strongly limits the general applicability of the method. This variability has already been observed by Wright (1977) and Van Marie et al. (1987). In the context of the J(d) flux equation, however, this variability can only be explained by variation in k from area to area, a variation which far exceeds the expected variation determined by P P (Betzer et al., 1984), or by assuming that the equation is not valid in the context of our problem. Therefore, we have decided to analyze the data from various areas from which extensive faunal data sets existed in more detail, mainly focussing on the Gulf of Mexico, the Gulf of California, the western coast of the United States and the Adriatic Sea.
5
The dependence of % P on depth In the Gulf of Mexico we analyzed in detail a number of transects previously studied by Phleger (1951; transects 1-12) and by Parker (1954; transects 1-7). The plot of all the raw P data versus depth (Fig.3) shows the enormous data scatter which occurs in this area. Figures 4 and 5 show the plot of the number of benthic and planktonic foraminifera respectively versus depth. The number of planktonic foraminifera steadily increases with depth, and the number of benthic foraminifera shows a very vague trend towards decreasing values. These total numbers are of course not corrected for differences in sedimentation rate. The figures show, however, that the trend of increasing % P with increasing depth is clearly caused by the opposite trends in numbers of the two groups. In many of the transects studied the trend of increasing %P-values with depth is rather pleasing and regular. In some transects, however, notably those from areas in front of the Rio Grande River and the Mississippi River, this trend is highly irregular, causing the large data scatter in Fig.3.
100
...,.,.
4" 80
• .~*.~
•, ,
*
,*
,
*.**
**
*~* ,f
20
*
*** * • **
'%
,/'~' • ',~ **
,
-, ; : ' . .
**
*
~
• * ** *
40
*
,
*
*
*
,. ***
**
*
** • •
O
,l
10
laB,
Z l.
.. ,.
.r
h, , ~ , *
.r_,.rr.]lLIII
*
~1
,
*
,U,
10 2
U U,#
I
10 3
'
'
'
''
'''1
10 ~
Depth
Fig.3. Raw data (n= 517) from transects 1-12 of Phleger (1951) and transects 1-7 of Parker (1954) from the Gulf of Mexico. All samples containingless than 100 foraminiferaper sample are deleted.
i
0
N
_~:
~
~
o
_
.
i
i itllll
•
'."
i
.. ..
~
•
i
~
.~ ~ .-
, illll]
.
I ~ Illl[
o
t ~1#
* * * * * *
*
I
.
...
.
i illlll
f.
~
-',-..,...,,~-
":" .'-
.::.-,,.:.:,..
I
;~ :-.
t i
i
p l a n k t o n i c
-...,.-...~..-,
-- . - . . . .
*~'i~ * e ' k , l * *
i
of
f o r a m i n i f e r a
N u m b e r
.
I
.
I LILIIt
.
~
~
~
~~
0
~
~
~
~
~
o
o
t~ ~t
Z
:Z
~
~
o
~
o .
.
.
t
.
.
-
.
~ Illll
*
.
.
*
.
.
,
-
.
*
.
.
.
. ..~
....
.
.
,:,:..~........
* * * /
**It t .
I~
~ J
I
Jltltl
'
.
o
*
¢.
..
.
.
..,:........
I
o
benthic;
, . ,*. . -. ' .# ',2-" .~ . ..~.. t. . . ~ : - *. . . . .* , * t * ~ * * ~ . . * . ~**t
.
, . ~.--..
I~
%
.
o
of
f o r a m i n i f e r a
N u m b e r
.: **
'
I
,i,L,'
o
-4
7
THE DEPTH DEPENDENCY OF PLANKTONIC/BENTHIC F O R A M I N I F E R A L RATIOS
We have recently, concluded (Van der Zwaan and Jorissen, 1989) that in these areas high numbers of the benthic genera Bulimina, Globobulimina, Bolivina, Uvigerina, and Fursenkoina occurred. We suggested that these species all have an infaunal habitat, i.e. are not directly dependent on the supply of organic matter and food from the overlying water layers. Instead, they would be deposit-feeders, relying on the food within the sediment. In Fig.6 we have plotted the cumulative frequencies of species belonging to the abovementioned genera versus depth. It can be seen that this group reaches highest frequencies between 50 and 800 m. Comparison with Fig.3 suggests that also in this interval a high number of deviant, low P-values occur. Assuming that the J(d) model describes primarily the relationship between planktonic foraminifera and epibenthic foraminifera (Fig.7), we calculated new %P-values, omitting the inbenthic species. We made conservative groupings in this case; i.e. we only excluded taxa which are generally agreed upon as being inbenthic (see Grossman, 1984a, b; Corliss, 1985; Van der Zwaan et al., 1986; Verhallen, 1987; Jorissen, 1988; Mackensen and Douglas, 1989). This newly calculated ratio, hereafter called %P*, is depicted in Fig.8. It can be seen that the regression is greatly improved by disregarding the infaunal elements,
[
NUm,ENTS primary
productivity
secondary
productivity
J(d)=R.(rillPP00)
secondary
productivity
EPIFAUNA
/ ~
Ioteral supply of organic matter
= I
Fig.7. Theoretical
I
model of food flux from surface layers to the
10o
~""~~f~j~;t~ ~ ¢'~ .. " . *..;p~ . :..~, •~ . . : . . " :". '~,z '.' """ ....e t o . ..o.. t .'. : , .* ' " .
80
.
e0 ~, ~
3 " , ** * * (, ,°°
.
* • ,
.~:.g* ..
o
---."
:
:',"
8o
""~
" •
'
.~.
" " .'"
... ,. ~ g] ~ O
•
(6)
where Se= standard error, S v = v a r i a n c e of % P * and T~ = student-t statistic, According to this model, a depth estimate of 1200 m (corresponding to about 99% P) would have 90% confidence limits o f 860 and 1650 m. An estimate of 430 m (corresponding to 50% P ) w o u l d result in lower and upper confidence limits of 310 and 590 m respectively. The data set from the Adriatic Sea, which exhibits an extremely tight regression, demonstrates that these outcomes can be improved considerably by using well-screened material, We chose a number of cores from the Adriatic Sea to assess the value of the present model under
Fig.18. Plot o f predicted and observed depth values in the G u l f
of Mexico, based on: D = e (3"5871s+(0"353'~'%/')).
Only values below 1250m (the m a x i m u m depth estimate
possiblewith the regression) were considered. fossil conditions. Most of the cores penetrate the Holocene and the uppermost part of the Pleistocene; the m o d e m water depths from which the cores were taken vary between 68 and 1234m. Therefore, we cover a wide environmental and bathymetrical range with these cores. In Fig. 19 the samples are calibrated to the numerical time scale, using carbon dating as discussed by Jorissen et al. (1990). In this paper we restrict ourselves to the palaeobathymetry of the cores; biostratigraphy, lithostratigraphy and faunal contents will be discussed by Jorissen et al. (1990). In the cores a number of clearly turbiditic sediments occur; samples from these intervals were excluded from the analysis. Further, a number of sapropel levels, i.e. laminated and anoxic deposits, are present. Samples from these intervals were also excluded. All other samples were processed, although in some of them signs of possible downslope displacement or resedimentation could be observed. In Fig.19 we have plotted the palaeobathymetrical estimates, together with the confidence limits using a 80% confidence interval. We have also indicated a theoretical palaeobathymetrical estimate, based on modern water depth minus the sea level drop that presumably took place during the various
l 'J
G.J. van der ZWAANET AL.
stages of glaciation and deglaciation. A number of cores show good to very good palaeobathymetrical reconstructions. This is true for the whole palaeobathymetric range from 68 to 1234 m. A number of intervals, however, show rather considerable deviations and a fluctuating palaeobathymetric pattern. This is true for cores 68-21 and 68-29. Judging from the 14C record extensive resedimentation took place, especially in core 68-29 and in the lower part of core 68-7. Jorissen et al. (1990) concluded that the sedimentation record older than 15 ka is strongly influenced by redepositional 8oo ,
,
looo ,
,
1200 ,
700 .
.
.
eoo .
.
1100
processes. The data further suggest that cores derived from the steep margins of the southern Adriatic basin were considerably more prone to resedimentation than those from the basin floor. The resedimentation is not easily discernible from the faunal associations. Preservation is nearperfect and the resedimentation did not lead to mixing of very shallow water associations with deep water ones. This suggests that the sediment displacement took place within narrow bathymetrical limits. In core 68-21, resedimentation is probably not the cause of the deviating palaeoba7oo
9oo
N--
"Noo
5oo i
i
7o0 z
z
eoo z
i
1100 i
Age I n Ka BP -o
"
Core IN 68-.5 t 030m
Core
IN 6 8 - 9
Core IN 6 8 - 3
1254m
868m
,
Core
age
20
uncerfaln
IN 6 8 - 7 1120m
Fig. 19. Palaeobathymetrical estimates of samples in Adriatic Sea cores, plotted with 80% confidence limit (horizontal bar). Heavy line indicates theoretical palaeobathymetry based on m o d e m depth minus assumed sea level lowerings due to glaciation. Ages from Jorissen et al. (1990).
THE DEPTH DEPENDENCY OF PLANKTONIC/BENTHIC FORAMINIFERAL RATIOS
thymetric estimates. Here, the depth estimates are far too high in sediments older than 10 ka; yet, the 14C record does not reveal extensive resedimentation. The extreme dominance of miliolids in this part of the core suggests that bottom life was impoverished, probably due to anomalous salinities in this isolated basin during the glacial lowstands,
certain amount of our data scatter is possibly attributable to variation in k induced by variation in PP. We have seen, however, that this effect is quite limited. In general, in waters below the mixed layer, our data confirm the J(d) relationship, predicting decay of organic matter inversely proportional to depth. In fact, our data conflict with the model of Betzer et al. (1984), even if higher benthos efficiencies are considered (Fig.17). Our equation:
Constraints on the model
D= From our data it is clear that the use of the %P* versus depth regression is potentially useful for making palaeodepth estimates between 30 and 1250m. In general, the regression seems to correspond to the prediction of the J(d) flux model, which explains the %P* patterns theoretically. A Age Ka o-
In BP
4o t
60 i
0 t
Co
s0100~50 i i i
0 ,
solools0200 , , .
.
.
.
13
(7)
e t 3 " S s 7 1 s +(0.03534.-%/*))
corresponds well to:
J(d)=O.4.PP/(D/IO0)
(8) and a benthos efficiency factor of 4. Both the efficiency factor and k are larger than mentioned
0 .
1oo20( . .
.
5oo
i
J
i
i
looo J
70o ,
.
9oo . .
.
.
1200
-22
15-
Cor
20Core
IN
68-16
194rn
Core
IN 797m
68-29
14
by Berger and Diester-Haass (1988). If we use k=0.2, which is probably an acceptable average value, we need an efficiency factor of about 10 to approach eqn.(7) in the bathymetrical range 100-400 m (Fig.17). At about 1000 m deep the value k = 0 . 2 and an efficiency factor of 3 (the values estimated by Berger and Diester-Haass) seem to provide good approximations of our equation. This would suggest that the benthos efficiency decreases drastically with depth, for instance due to the gradual displacement of highly opportunistic species with a large progeny by equilibrium species with a small progeny, The upper limit of 1200m in our model is artificial and not predicted by the J(d) flux model; this model predicts a "tail" (Fig.17) which is extremely dependent on D but scarcely at all dependent on %P*. This implies that small changes in %P*, due to counting artefacts or preservation (dissolution), weigh heavily and lead to highly divergent depth estimates. Therefore, any attempt to apply the model in deeper environments would seem to be fruitless, High abundances of infaunal elements coincide with relatively low % P values. That these low values are caused by relatively high standing stocks of benthic forminifera and not by dissolution is proved by the fact that in these samples the planktonic foraminiferal numbers are not significantly lower than in other samples. In this context it is worth mentioning that in anoxic or dysoxic basins often high benthic foraminiferal standing stocks are reported which are dominated by infauna(cf. Douglas and Woodruff, 1981; Phleger and Soutar, 1973; Lutze and Coulbourn, 1984; Lutze et al., 1986). Verhallen (1987) and Jorissen (1988) speculated on this matter alid assumed that decreasing oxygen resulted in increasing organic matter contents and the subsequent initial increase of, in particular, the inbenthic standing stocks. This increase in standing stock is probably also related to the decrease in predation pressure. The increase continues until oxygen becomes a limiting factor, upon which the standing stock decreases dramatically. Clearly we can correct the % P for the initial stage, the increase in standing stock, by disregarding the infaunal elements. The second stage, where the total benthic standing stocks
G.J. van der Z W A A N ET AL,
decrease, is far more difficult to correct for and at the moment we have no means of doing so. This would depend on detailed and precise knowledge of the relationship between standing stock and oxygen below certain critical limits. Therefore, one should avoid at this stage palaeobathymetrical estimates in anoxic or strongly dysoxic environments, which are recognizable by the accumulation of organic matter and the disappearance of burrowing organisms, and by the very typical low diversity benthic associations. A major source of error is formed by redeposition and downslope contamination. At first sight this seems to be fairly easy to deal with. The general contention is that this contamination is readily recognizable by the occurrence of mixed associations, i.e. from shallower and deeper water, or by preservation. The sample analysis of the Adriatic Sea cores, however, proves that resedimentation is extremely difficult to trace if it occurs within a narrow bathymetrical range and if finegrained sediments are resedimented. Only by using carbon dating, were Jorrisen et al. (1990) able to prove the enormous extent of redeposition. The effects of this redeposition on the P-values are not consistent: in a number of cases it causes lower Pvalues than expected at a particular depth. In core 68-29, however, a considerably higher than expected P-value was found. The last source of error, for which we know of no method to correct for, is formed by differential dissolution processes. In many sediments, especially organic-rich ones, dissolution may play an important role by selective dissolution of, in particular, the juvenile planktonic foraminifera. The last forms affected by dissolution will be the benthic foraminifera, thus leading to P-values which are relatively too low. This probably plays a role in the Gulf of Mexico and in the Gulf of California. Concerning the constants of the equation, there is a discrepancy between the values as found by us, by Wright (1977) and Van Marle et al. (1986). The differences between our equation and that of Wright are very small. The equation of Van Marie et al., however, is considerably different; they correctly state that oxygen could have been a limiting factor on their benthic populations, which
THE DEPTH DEPENDENCY OF PLANKTONIC/BENTHIC FORAMINIFERAL RATIOS
could thus have influenced their %P-values. We believe that this is the case. In our study we found no reason whatsoever why the equations should be considerably different under various climatological and oceanographical regimes. In fact, our study on the Adriatic Sea cores seems to indicate that the relationship is valid provided that great care is taken in selecting the samples, i.e. by avoiding strongly oxygen-deficient areas and areas where active redeposition takes place. Our study certainly shows that these effects are probably far more important than variation in the export factor k coupled with variation in the primary productivity,
Conclusions Our data indicate that ratios between planktonic and benthic foraminifera can be well described by using organic flux equations, as has already been indicated by Berger and Diester-Haass (1988). The fact that organic fluxes are inversely proportional to depth, explains why P/B ratios also co-vary with depth. Our material proves that disregarding infaunal living benthic foraminifera in calculating the P/B ratios improves the regression between P/B ratio and depth considerably. More importantly, however, the regressions between P/B ratio and depth from various areas (Gulf o f Mexico, G u l f of California, west coast o f the USA and the Adriatic Sea) become very similar after correction of the P/B ratios for inbenthic living foraminifera. The general relationship between depth and % P can be described according to: Depth = e (3"S871s+~°'°aSa'*'%e) Statistical analysis shows that the 80% confidence limits are still quite large, but can be reduced if better screened material is employed to base the regression on. Study of material from recent environments, as well as material from piston cores from the Adriatic Sea, shows that variations in productivity and the export factor k have no profound effect on the relationship between depth and %P. The same holds for variation in temperature regime. Palaeodepth reconstructions are vulnerable, however, to variations in preservation (e.g. by dissolution) of the material. Although easily recognizable, it is not
15
easy to correct for this in a quantitative way. The best procedure seems to neglect all samples which show signs of dissolution. The effects o f redeposition, especially of fine-grained sediments, proved to be the most damaging in palaeobathymetric reconstructions, and by far the most difficult to detect.
Acknowledgements We thank T o m van Hinte for drawing the figures and two anonymous reviewers for suggestions for improving the manuscript. This research was partly supported by grant 751.356.021 from The Netherlands Organization for Scientific Research (NWO).
References Berger, W.H. and Diester-Haass, L., 1988. Paleoproductivity: the benthic/planktonic ratio in foraminifera as a productivity index. Mar. Geol., 81:15-25 Betjeman, K.J., 1969. Recent foraminifera from the western continentalshelf of Western Australia. Contrib. Cushman Found. Foraminiferal Res., 20:119-138 Betzer, P.R., Showers, W.J., Laws, E.A., Winn, C.D., DiTuUio, G.R. and Kroopnick, P.M., 1984. Primary productivity and particle fluxes on a transect of the equator at 153°W in the Pacific Ocean. Deep-Sea Res., 31:1-11 Cloetingh,S., 1988. Intraplate stresses: A new element in basin analysis. In: Pettijohn Memorial Volume, pp.205-226 Cloetingh,S., McQueen, H. and Lambeck, K., 1985. On a tectonic mechanism for regional sea level variations. Earth Planet Sci. Lett., 75:157-166 Corliss,B.H., 1985. Microhabitats of benthic foraminifera within deep-sea sediments. Nature, 314:435-438 Douglas, R.G. and Woodruff, F., 1981. Deep-sea benthic foraminifera. In: C. Emiliani (Editor), The Oceanic Lithosphere. (The Sea, 7). Wiley-Interseience, New York, pp.1233-1327 Eppley,R.W. and Peterson, B.J., 1979. Particulate organic matter flux and planktonic new production in the deep ocean. Nature, 282:677-680 Grimsdale, T.F. and Van Morkhoven, F.P.C.M., 1955. The ratio between pelagic and benthonic foraminifera as a means of estimating depth of deposition of sedimentary rocks. Proc. World Pet. Congr., 4th (Rome) Sect. l/D4, pp.473-491 Grossman, E.L., 1984a. Stable isotope fractionation in live benthic foraminifera from the Southern California Borderland.Palaeogeogr., Palaeoclimatol., Palaeoecol., 47: 301-327 Grossman, E.L., 1984b. Carbon isotopic fractionation in live benthic foraminifera - - comparison with inorganic precipitate studies. Geochim. Cosmochim. Acta, 48:1505-1512 Haq, B.U., Hardenbol, J. and Vail, P.R., 1988. Mesozoic and
16 Cenozoic chronostratigraphy and cycles of sea-level change. In: Sea-Level Changes - - an Integrated Approach. Soc. Econ. Paleontol. Mineral. Spec. Publ., 42:71-108 Hemleben, C. and Spindler, M., 1983. Recent advances in research on living planktonic foraminifera. Utrecht Micropaleontol. Bull., 30:141-170 Hemleben, C., Spindler, M. and Anderson, O.R., 1989. Modern Planktonic Foraminifera. Springer, Berlin, 363 pp. Jorissen, F.J., 1988. Benthic foraminifera from the Adriatic Sea; principles of phenotypic variation. Utrecht Micropaleontol. Bull., 31:179 pp. Jorissen, F.J., Rohling, E.J., Zachariasse, W.J., Van der Borg, K., Borsetti, A.M., Gudjonsson, L., Hilgen, F.J., Iaccarino, S., De Jong, A.F.M., Juurlink, T. and De Visser, J.P., 1990. Late Quaternary high resolution biochronology for the Central Mediterranean. Mar. Micropaleontol., submitted, Kafescioglu, I.A., 1975. Quantitative distribution of foraminifera on the continental shelf and uppermost slope off Massachusetts. Micropaleontology, 21:261-305 Lutze, G.F., 1974. Benthische Foraminiferen in Oberfl/ichenSedimenten des Persischen Golfes. Teil I: Arten. "Meteor" Forschungsergeb., Reihe C, 17:1-66 Lutze, G.F. and Coulbourn, W.T., 1984. Recent benthic foraminifera from the continental margin of Northwest Africa: community structure and distribution. Mar. Micropaleontol., 8:361-401 Lutze, G.F., Pflaumann, U. and Weinholz, P., 1986. Jungquart/ire Fluktuationen der benthischen Foraminiferenfaunen in Tiefsee-Sedimenten vor NW-Afrika - - Eine Reaktion auf Produktivit/its Anderungen im Oberfl/ichenwasser. "Meteor" Forschungsergeb., Reihe C, 40:163-180 Mackensen, A. And Douglas, R.G., 1989. Down-core distribution of live and dead deep-water benthic foraminifera in box cores from the Weddell Sea and the Californian continental borderland. Deep-Sea Res., 36:879-900 Miller, K.G., 1982. Eocene-Oligoeene paleoceanography of the deep Bay of Biscay: benthic foraminiferal evidence. Mar. Micropaleontol., 7:403-440 Murray, J.W., 1976. A method of determining proximity of marginal seas to an open ocean. Mar. Geol., 22:103-119 Parker, F.L., 1954. Distribution of the foraminifera in the northeastern Gulf of Mexico. Bull. Mus. Comp. Zool., Harv. Univ., 111:452-588 Parker, F.L., 1958. Eastern Mediterranean foraminifera. Rep. Swed. Deep-Sea Exped:, 8(4): 219-283 Pearson, T.H. and Rosenberg, R., 1987. Feast and famine: structuring factors in marine benthic communities. In: J.H.R. Gee andP.S. Giller (Editors), Organization of Communities, Past and Present. Blackwell, Oxford, pp.373-395 Pflum, C.E. and Frerichs, W.E., 1976. Gulf of Mexico deepwater foraminifers. Cushman Found. Foraminiferal Res. Spec. Publ., 14:125 pp. Phleger, F.B., 1951. Foraminifera distribution. In: Ecology of
G.J. van der ZWAANET AL. Foraminifera, Northwest Gulf of Mexico. Geol. Soc. Am. Mem., 46:1-88 Phleger, F.B. and Soutar, A., 1973. Production of benthic foraminifera in three east Pacific oxygen minima. Micropaleontology, 19:110-115 Poag, C.W., 1972. Shelf-edge submarine banks in the Gulf of Mexico: paleoecology and biostratigraphy. Gulf Coast Assoc. Pet. Geol. Bull., 48(11): 1810-1827 Rohling, E.J. and Gieskes, W.W.C., 1989. Late Quaternary changes in Mediterranean intermediate water density and formation rate. Paleoceanography, 3 Romankevich, E.A., 1984. Geochemistry of Organic Matter in the Ocean. Springer, Heidelberg, 344 pp. Schrader, H., Guangfen Cheng and Mahood, R., 1983. Preservation and dissolution of foraminiferal carbonate in an anoxic slope environment, Southern Gulf of California. Utrecht Micropaleontol. Bull., 30:205 227 Suess, E., 1980. Particulate organic carbon flux in the oceans - surface productivity and oxygen utilisation. Nature, 288: 260-263 Todd, R., 1958. Foraminifera from western Mediterranean deep-sea cores. Rep. Swed. Deep-Sea Exped., 8(3): 169-215 Uchio, T., 1960. Ecology of living foraminifera from the San Diego, California, area. Cushmn Found. Foraminiferal Res. Spec. Publ., 5:1-72 Vail, P.R., Mitchum, R.M. and Thompson, S., 1977. Seismic stratigraphy and global changes of sea level, part 4: Global cycles of relative changes of sea level. In: C.E. Payton (Editor), Seismic S t r a t i g r a p h y - Applications to Hydrocarbon Exploration. Am. Assoc. Pet. Geol. Mere., 26:83-97 Van der Zwaan, G.J. and Jorissen, F.J., 1989. Biofacial patterns in river-induced shelfanoxia. In: R. Tyson and T.H. Pearson (Editors), Modern and Ancient Continental Shelf Anoxia. Geol. Soc. London Spec. Publ., submitted. Van der Zwaan, G.J., Jorissen, F.J., Verhallen, P.J.J.M. and Von Daniels, C.H., 1986. Uvigerina from the eastern Atlantic, North Sea basin, Paratethys and Mediterranean. In: G.J. van der Zwaan, F.J. Jorissen, P.J.J.M. Verhallen and C.H. yon Daniels (Editors), Atlantic-European OligoceneRecent Uvigerina. Utrecht Micropaleontol. Bull., 35:7-20 Van Marie, L.J., Van Hinte, J.E. and Nederbragt, A.J., 1987. Plankton percentage of the foraminiferal fauna in seafloor samples from the Australian-lrian Jaya continental margin, Eastern Indonesia. Mar. Geol., 77:151-156 Verhallen, P.J.J.M., 1987. Early development of Bulirnina marginata in relation to paleoenvironmental changes in the Mediterranean. Verh. K. Ned. Akad. Wet., Ser. B, 90:161-180 Wilcoxon, J.A., 1964. Distribution of foraminifera off the southern Atlantic coast of the United States. Contrib. Cushman Found. Foraminiferal Res., 15:1-24 Wright, R.G., 1977. Planktonic-benthonic ratio in foraminifera as paleobathymetric tool. Quantitative evaluation. Ann. Am. Assoc. Pet. Geol. and Soc. Econ. Paleontol. Mineral. Conv. (Washington, D.C.), p.65 (Abstr.).