Atlantic City International Airport , New Jersey. This paper presents the results of a human factors assessment sponsored by the Required Navigation.
PROCEEDINGS of the MINI-CONFERENCE ON HUMAN FACTORS IN COMPLEX SOCIOTECHNICAL SYSTEMS - 2005
6-1
THE EFFECT OF DEVIATION ANGLE AND DEVIATION LOCATION ON AIR TRAFFIC CONTROLLERS’ ABILITY TO DETECT AIRCRAFT BLUNDERS Anton S. Koros1 and Pam S. Della Rocco2 Northrop Grumman Information Technology1 FAA William J. Hughes Technical Center2 Atlantic City International Airport , New Jersey This paper presents the results of a human factors assessment sponsored by the Required Navigation Performance (RNP) Program Office (ATO-R). The National Airspace System Human Factors group (ATO-P, formerly ACB-220) conducted a reaction time task as part of the human factors evaluation at the Northern California Terminal Radar Approach Control (TRACON). Sixteen Air Traffic Controller Specialists (ATCSs) completed the 35-minute simulation task. The air traffic display presented one aircraft at a time. The display showed aircraft as they would typically appear on a radar display, i.e. identified by a radar symbol and updated every 4.8 seconds. Eight of the 20 aircraft “blundered” from the typical flight path by initiating a turn of 15º, 30º, 45º, or 60º. The participants identified when a blunder occurred by pressing a computer key. The results indicated that ATCSs identified deviations more quickly if the aircraft turned soon after becoming established on the flight path verses near the end of the flight path (6.0 vs 8.7 seconds). On average, participants responded most quickly to deviations of 30º (5.8 seconds) followed by 60º (6.7 seconds), 45º (7.1 seconds), and 15º (9.9 seconds). The researchers theorize that the controllers focused near the beginning of the flight path because, based on their ATC experience, this phase of flight represented a greater likelihood of a deviation. They also speculated that the superior performance at 30º may be due to everyday familiarity with this turn rate and distrust of rates more extreme than those typically experienced. INTRODUCTION The FAA forecasts that over the next ten years demand at the major hub airports will increase by 200 million passengers (FAA, 2002). In response, the FAA is pursuing the creation of area navigation and required navigation performance (RNP) arrival and departure routes. These routes leverage the capabilities of modern aviation systems to reduce reliance on ground-based navigation aids and promote more efficient flight paths. The Required Navigation Performance Division (ATOR) requested that the NAS Human Factors group (ATO-P) conduct a human factors assessment of a proposed Required Navigation Performance (RNP) converging approach procedure to San Francisco International Airport (SFO). Today, during adverse weather conditions, SFO must adopt a single stream operation. During these times, the airport acceptance rate falls from approximately 60 aircraft per hour to near 30 aircraft per hour. In December 2004, the NAS Human Factors group conducted a simulation utilizing an RNP converging approach procedure that would maintain a dual stream operation during lower weather minimums. The study consisted of a reaction time task and four operational scenarios. The operational scenarios investigated two communications options, two options for locating the nontransgression zone, and two levels of traffic. One of the primary objectives of the study was to characterize controllers’ ability to distinguish between standard track error and “blunders” using an ARTS Color Display showing ASR-9 radar data. The simulation environment provided the opportunity to measure ATCS response times to a number of aircraft deviations; an incident so rare that a
controller may not experience a similar event during their entire ATC career. We implemented aircraft deviations of 30º in the operational scenarios in accordance with previous research (Magyarits & Ozmore, 1999; Magyarits & Ozmore, 2002). Unlike the operational scenarios, the reaction time task provided an opportunity to measure response times to varying deviation angles when controllers were not responsible for monitoring multiple aircraft, providing aircraft separation, or communicating with pilots. This paper presents results of the reaction time task. Method Participants. Sixteen ATCS Northern California Terminal Radar Approach Control (TRACON) participated in the study. All participants were males ranging in age from 35 to 60 years with a median age of 48.5 years. Their experience as a SFO terminal airspace controller ranged from 2 months to 31 years, with a median of 12.5 years. Test Facility. The researchers conducted the simulation at the Enhanced Target Generator training facility at Northern California TRACON. Apparatus. The apparatus consisted of four on site ARTS Color Displays (ACD), a portable high fidelity air traffic control simulator, and pre-recorded scripts. The simulation platform consisted of the target generation facility (i.e, a target generator) and the Distributed Environment for Simulation, Rapid Engineering, & Experimentation (DESIREE). The four reaction time scripts consisted of 20 pre-recorded flight paths. The researchers changed the aircraft callsigns and the order of presentation for each version, but the exact path of all aircraft remained identical.
PROCEEDINGS of the MINI-CONFERENCE ON HUMAN FACTORS IN COMPLEX SOCIOTECHNICAL SYSTEMS - 2005
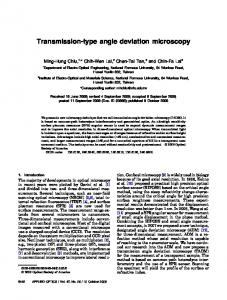
Outer Marker SFO 28L
Non-Transgression Zone
2000’
Deviation initiation areas
28 Left ILS Approach
Figure 1. Approach used for reaction time task. Variables. Independent variables included angle of deviation (i.e., 15º, 30º, 45º, and 60º) and deviation location (i.e., shortly after an aircraft was established on the approach, or near the end of the approach). The dependent measure presented here is the amount of time from the onset of the aircraft turn until the controller pressed a key to indicate that the aircraft deviated from the approach path. RESULTS The researchers averaged the reaction time to identify each blunder situation for all 16 participants. Figure 2 presents the average time to identify a deviation from the initiation of the turn. Deviation angle appears on the x-axis and average time for the controller to respond in seconds on the y-axis. The lower line ( ) shows the average time controllers required to identify a deviation that occurred soon after an aircraft was established on the approach path.
The upper line ( ) presents the average time participants required to respond when the deviation was near the end of the approach path.
15
Seconds (average)
Procedure. Each day, four ATCSs completed the 35minute reaction time task. They concurrently observed the series of 20 individual aircraft turn onto the final approach course for SFO runway 28-Left. For this task, the ATCSs could only observe the aircraft and had no communications capability with the pilot. The researchers instructed the participants to indicate when an aircraft deviated from the final approach course by pressing any key on the ACD keyboard. Diverging aircraft turned 15º, 30º, 45º, or 60º. The researchers did not inform the participants that deviations occurred either soon after the aircraft was established on the approach, or near the end of the approach. All deviating aircraft continued on the divergent path until they entered a non-transgression zone (NTZ). The NTZ was a 2,000-foot wide area, located equidistant between the runway 28-Left and 28-Right final approach courses. We instructed the participants to indicate when they were certain that a deviating aircraft would enter the NTZ by pressing any key on the ACD. The simulator captured the system time for each display update and participant key press. Figure 1 depicts the areas where deviating aircraft on the 28-Left approach initiated the turn.
6-2
10
5 Location of deviation Beginning of approach End of approach
0
15
30
45
60
Deviation Angle (degrees)
Figure 2. Average time to identify a deviation. The researchers conducted a 2 X 4 repeated measures ANOVA to compare controller response times for deviation location and deviation angle. The first factor, deviation location, included two levels (i.e., soon after the aircraft was established on the approach or near the end of the approach). The second factor, deviation angle, had four levels (i.e., 15º, 30º, 45º, and 60º). There was a significant interaction for deviation location by angle, F(3,45)=10.53, p