THE EFFECT OF INFORMATION TECHNOLOGIES ON TQM: AN INITIAL ANALYSIS. Angel R. Martínez-Lorente 1 * Universidad Politécnica de Cartagena, Cartagena, Spain
Cristóbal Sánchez-Rodríguez Wilfrid Laurier University, School of Business & Economics, Waterloo, Canada
Frank W. Dewhurst Manchester School of Management, UMIST, Manchester, United Kingdom
Abstract Information Technology (IT) and Total Quality Management (TQM) have significantly impacted on most organizations and each has been widely researched. However, there is little well-founded empirical research on the relationship between the two, particularly on the way in which TQM is influenced by IT. This paper presents an investigation of such relationships through a survey of the largest industrial companies based in Spain. The data indicate that the most intensive users of IT perceive a bigger impact on their TQM dimensions.
Keywords:
Information Technology, Total Quality Management, empirical study
1
Corresponding author: Angel R. Martínez-Lorente. Facultad de Ciencias de la Empresa, Paseo Alfonso XIII, 50, 30203, Cartagena, Spain. Telephone: 34 68 325618. Fax: 34 68 327008. E-mail:
[email protected] * The authors wish to thank the financial support provided by Seneca Foundation for this research.
1
Introduction It is frequently argued that IT is a very important factor in increasing productivity and reducing costs [1, 2, 3, 4, 5], although some studies show contradictory results [6, 7, 8]. Evidence of positive and significant returns from IT investment can be found in Brynjolfsson and Hitt [9], Dewan and Min [10] and Kelley [11] whilst Loveman [12], Powell and DentMicalef [13] and Strassmann [14] found that IT had no significant effect on productivity or competitive advantage. Using country-level data, Dewan and Kraemer [15] found that IT investments have a positive and significant effect on GDP output in developed countries but not in developing ones. Manufacturers and service providers seeking continuous improvements in business performance apply various means for improving quality, reducing costs and increasing productivity. These include Total Quality Management (TQM), Total Productive Maintenance (TPM), Business Process Re-engineering (BPR), Manufacturing Resources Planning (MRP), Just-in-Time (JIT), etc. Weston [5] claims that all these interventions rely on IT, since they act as a feedback mechanism to users who are keen to measure productivity and, in addition, they also serve as the means to get rapid and more accurate information, improve communication links, and facilitate the implementation of advanced tools, systems and modelling techniques. There is little doubt that applications of IT affect all sections and functions of a company, therefore, it is argued that IT also must affect Total Quality Management (TQM). This paper examines the way in which TQM is influenced by IT and the role of IT in TQM interventions. Before considering the influence of IT on TQM it is necessary to define what is meant by the term TQM. We used the TQM dimensions identified by Ahire et al. [16], Flynn et al. [17] and Saraph et al. [18] to identify the key TQM dimensions used in this study (see Table 1). Accordingly, eight key TQM dimensions were identified: top management support, workforce
2
management, employees attitudes and behaviour, customer relationship, supplier relationship, product design process and process flow management. Figure 1 offers a brief description about each TQM dimension. In recent years quality award programs such as the European Quality Award [19] and the Malcolm Baldrige Award (MBNQA) [20], have brought attention to quality issues and helped to clarify the meaning and the key constituents of quality management [21, 22]. After comparing the key elements included in our TQM definition with the building blocks of the EFQM and MBNQA frameworks (see Table 1) we can conclude that, as a whole, the TQM definition used in this study is consistent with EFQM and MBNQA frameworks. However, there are two exceptions: the product design process and quality data and reporting, which are not considered in the EFQM framework. Much has been written about how IT might be used to enhance TQM, see for example: Ayers [23], Zadrozny and Ferrazzi [24], Berkley and Gupta [25] and Cortada [26]. Sobkowiak and LeBleu [27] and Pearson and Hagmann [28] emphasise the key roles that information and IT play in TQM. Specific IT applications in various aspects of TQM have been described by: Miller [29], Aiken et al. [30], Goodman and Darr [31], Khalil [32], Kaplan [33], Kock and McQueen [34] and Counsell [35]. Some studies have considered how IT is related to organizational performance measures. For example Byrd and Marshall [36] employed causal model analysis to relate IT investment to organisational performance whilst Rogers et al. [37] examined the relationship between utilisation of IT and company performance in the warehouse industry. Although Rogers et al. [37] provided empirical evidence of the importance of IT in quality performance, the role of IT in TQM environments was not investigated. Torkzadeh and Doll [38] devised and applied a construct to measure the perceived impact of IT on work (i.e. only one of the eight TQM dimensions).
3
The only consideration given to how IT influences TQM is the reference model developed by Forza [39] to link TQM practices, information systems and quality performance through empirical research. However, using his own model and associated measures, Forza [40] did not succeed in empirically establishing a link between TQM practices and IT and only the use of IT in the quality assurance aspect of TQM was explored. Forza [40] proposed that the contribution of IT should be further investigated by developing adequate measures especially with reference to its use. More recently, Dewhurst et al. [41], have suggested that IT support TQM by improving costumer and supplier relationship, increasing process control, facilitating teamwork, facilitating inter departmental information flow, improving design process and skills and applying preventive maintenance. To develop a measurement construct it is necessary to state the hypotheses to be tested and this requires an underlying theoretical framework. The framework shown in Figure 2 was developed by the authors after a case study analysis on fourteen companies [41]. The relationships espoused in the framework are explained as follows: •
Previous research [42] has shown that the application of TQM can be affected by variables such as company size or type of production system. In this paper the company characteristics that have been analysed include: company size, the importance of quality to compete and the type of manufacturing process (e.g. Job shop, Assembly line, Continuous production, Cellular or Fixed).
•
More advanced companies will make a bigger use of IT and will also apply TQM. Therefore, a positive relationship between both variables can be expected.
•
If IT affects TQM, a bigger use of IT should be positively related with any impact of IT on TQM.
•
If IT implementation is positive, it has to be related with company performance.
•
TQM is expected to be positively related with company performance [43].
4
•
A positive impact of IT on TQM dimensions should have a positive impact on company performance.
Methodology A postal questionnaire was used based on a previous multiple case study. The population comprised industrial companies with factories located in Spain. Industrial companies were chosen because the problems faced in the management of quality by service companies are different [44, 45]. A list of the 3000 largest Spanish companies by annual sales turnover is published by the organization "Fomento de la Producción" of which 1949 were surveyed. The target respondents of the questionnaire were quality managers. When the name of the quality manager was unknown, the questionnaire was addressed to "responsable de calidad” (quality leader) and the first question asked for the position of the respondent in the company. The questionnaire response rate was 22.7% (442 companies), and this is comparable to those of Operations Management studies by Frohlich and Dixon [46], Mehra and Inman [47], Small and Yasin [48] and Vickery et al. [49]. Some 60% of the companies in the sample are made up of Spanish companies, 21% of other European Union companies. The majority of the questionnaires were answered by quality managers (70.5%) whist other major respondents were quality department representatives (10.5%) and plant directors (3.4%). Respondents were also asked to indicate if they were using TQM or not; 52.9% of companies identified themselves as implementing TQM (N = 234). Using the scores from this sub-sample of companies, a set of analyses of variance (ANOVAs) were performed on all items comprising TQM, IT impact on TQM, quality importance to compete and operational and quality performance to assess the impact of the respondent’s position in the company on the responses. The ANOVAs results showed that respondent’s perceptions among different groups were not significantly different for 61 of the 67 items considered. Only in six cases quality department members perceived a more
5
optimistic situation than the quality manager and the operations/ production manager (see Table 2). The measurement of most of the variables requires the definition of a scale because they cannot be measured directly and consequently 19 scales were developed (see Table 3 and Appendix). According to Orlikowski and Gash [50] IT can be defined as “any form of computer-based information system, including mainframe as well as microcomputer applications.” A list of information technologies was obtained based on previous literature [51, 52, 53, 54, 55] (see Appendix). Information technologies were then classified into six broad categories (constructs) relating to their purpose of use: administrative IT, communications-related IT, decision support IT, production planning IT, product design IT, and production control IT. For instance, the administrative IT (ITADMN) construct pertains to IT used to assist in the more clerical and administrative tasks such as document organization, data organization and storage, data analysis, etc. This construct includes IT applications such as invoicing systems, stock control systems, payroll systems, databases and cost accounting systems. The communication-related IT construct (ITCOMM) refers to IT that is directly related to the transmission of information. This construct includes the following IT applications: advertising by a company web page, direct sales by a company web page, electronic data interchange (EDI), Intranet, and inter company networks and group working with electronic information interchange. The decision support IT (ITDEC) construct refers to the use of IT to support managers in the decision-making process. Subsequently, the decision support IT construct includes such IT applications as decision support systems, data analysis techniques and forecasting software. The production planning IT construct (ITPLAN) refers to the use of IT in production planning tasks, and therefore, includes such IT applications as Computer Aided Production Planning (CAPP), Manufacturing Requirements Planning (MRP), and Enterprise
6
Resource Planning (ERP). The production design support IT (ITDESIGN) construct refers to the use of IT to assist in the product design process and include such IT applications as computer aided design (CAD), computer aided manufacturing (CAM), and computer aided engineering (CAE). The production control IT construct (ITPDCTRL) refers specifically to the use of IT in manufacturing activities and in quality control activities. This construct includes such IT applications as computerized numerical control machines (CNC), robots, electronic systems of quality control and flexible manufacturing systems (FMS). The TQM implementation construct was measured using a seven-item scale (see Appendix for measurement indicators) based on Martinez-Lorente’s et al. [56] TQM definition (see Figure 1). Top management support was not included in the TQM implementation construct because it was considered that top management support is more of a necessary mechanism to implement TQM practices (e.g. customer relationships, supplier quality management, process flow management, workforce management, etc.) than a manifestation of TQM implementation in itself. Eight constructs were developed to measure the impact of IT on TQM (see Table 2 and Appendix for measurement indicators). Each one of these constructs refers to the impact of IT on each one of the eight TQM dimensions shown in Figure 1: impact of IT on top management support, impact of IT on workforce management, impact of IT on employees attitudes and behaviour, impact of IT on customer relationship, impact of IT on supplier relationship, impact of IT on product design process, impact of IT on process flow management and impact of IT on quality data and reporting. Four indicators of company performance were used (see Table 2): •
Operational - different aspects of operational efficiency were subjectively measured by the respondents in relation to their industry (see Appendix).
•
Quality - different aspects of quality were subjectively measured by the respondents in relation to their competitors (see Appendix).
7
•
Profitability on sales turnover (PST) - obtained from the Fomento de la Producción database.
•
Profitability per employee (PE) - obtained from the Fomento de la Producción database.
All the items measuring TQM, IT, IT impact on TQM, operational and quality performance constructs were measured on a 1 to 5 scale where a score of 1 “no use at all” and 5 represented “intensive use”. The scores in each construct were averaged to obtain a composite measure for the construct. Reliability for the all the study’s constructs was measured (see Table 3) using the internal consistency method, as described by Bohrnstedt [57]. Typically, reliability coefficients of 0.7 or more are considered adequate, however, coefficients of 0.6 can be accepted for new scales [58]. RESULTS Company characteristics and IT implementation The results show that company size is related with IT implementation. Number of employees and sales turnover are positive and significantly related with all the scales of IT implementation except for administrative work (see Table 4 and Figure 3). The use of IT for administrative work can be considered as less complex and more common. The results confirm that the extent of IT implementation depends on company size and the reason can be found in the fact that bigger companies have more qualified workers, which are necessary for the successful application of IT. The process type does appear to be related to and influence the application of computerised production control (i.e. the ITPDCTRL), the IT most related with automation. An ANOVA test shows a level of significance of p = 0.02. However, when the means of ITPDCTRL for each process type are analysed (see Table 5), it can be seen that the implementation of ITPDCTRL in a fixed position process is significantly lower than in the other types of processes (job shop, assembly line, continuous, and cellular)
8
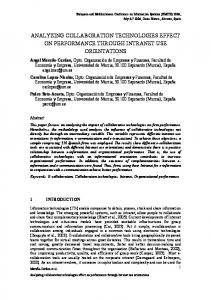
Company characteristics and TQM implementation. Companies that apply TQM have a higher sales turnover and more employees and differences are significant at p < 0.05 as shown in Table 6 and Figure 4. However, the correlation between company size (measured by sales turnover and number of employees) and the extent to which TQM is implemented is not significant . This would indicate that size is an important factor in the decision of whether to apply TQM but when a company decides to do it, size is not an important issue. The importance of quality in the industry should be an incentive to apply TQM. The data confirms this hypothesis and the mean of the level of the importance of quality is significantly bigger (p = 0.017) for companies that apply TQM (mean = 4.06) than for those that do not (mean = 3.93). Moreover, the level of application of TQM is correlated with the level of importance of quality to compete (r = 0.389, p = 0.000). The type of process does not appear to affect the application of TQM. Although companies with assembly lines apply TQM more frequently (see Table 7), global differences are not significant (Chi-Square = 2.391, p = 0.664). Therefore, process type is not an important factor in the decision of implementing TQM in a company. IT and TQM implementation. TQM and IT implementation do not necessarily have to be correlated because they can be applied independently. However, we would expect to find that more advanced companies would introduce both IT and TQM. The data support this hypothesis, since means of application of the different dimensions of IT are all bigger when the company apply TQM (see Table 8 and Figure 5) and all differences are significant at p < 0.05. Moreover, correlations between the different dimensions of IT implementation and TQM implementation are positive and significant at p < 0.01 (see Table 9).
9
IT and IT impact on TQM. The impact of IT on TQM was measured on a 5- point scale. The composite means of seven of the eight TQM dimensions were above point 3 of the scale (see Table 10). Therefore, the correlation between the level of IT implementation and the level of IT impact on TQM dimensions was evaluated. If IT has an impact on TQM, then it is reasonable to suppose that when IT is employed intensively, the perceived impact on TQM has to be greater. The data confirm this hypothesis because all the measures of the dimensions of IT are positive and significantly correlated (p < 0.01) with the measures of IT impact on TQM dimensions (see Table 11 and Figure 5). TQM and company performance Companies that apply TQM have better operational performance and the difference in means is significant at pD*; F>G* 4.00 3.75 3.73 3.67 3.75 4.23 3.54 2.40 0.028 F>D*; F>G* 4.20 3.75 3.27 3.45 3.25 4.26 3.54 3.59 0.002 F>C*; F>D*; F>E*; F>G* 4.20 3.75 3.82 3.60 4.00 4.26 3.88 2.17 0.047 F>D* 3.20 3.00 3.45 3.08 3.00 3.74 3.46 2.31 0.035 F>D*; F>E* 3.40 2.75 3.36 3.12 3.25 3.70 3.63 2.18 0.046 F>B*; F>D* N=5 N=4 N=11 N=156 N=4 N=23 N=24 Table 2. Influence of respondent’s position on selected items. Note: (A) President, owner or general manager; (B) General manager in Spain; (C) Plant director; (D) Quality department director/manager; (E) Operations/production department director/manager, (F) Quality department member; (G) Other * Statistically significant at p = 0.05
Variable IT implementation
TQM implementation IT impact on TQM dimensions
Company performance
Company characteristics
Scale ITADMN ITCOMM ITDEC ITPLAN ITDESIGN ITPDCTRL TQM Top management support Customer relationship Supplier relationship Workforce management Employee attitudes Product design process Process flow management Quality data & reporting Operational performance Quality performance PST PE Number of employees
Sales volume Type of production process Importance of quality to compete Table 3. Variables, number of items, and reliability.
No. of items 5 6 3 3 3 7 7 4 5 5 8 4 4 6 7 5 4 1 1 1
Cronbach’s α 0.7395 0.7048 0.7221 0.8297 0.7490 0.8003 0.8176 0.8879 0.8210 0.7781 0.9166 0.7767 0.8288 0.8383 0.8706 0.6478 0.7259 -
1 1 4
0.6439
24
ITADMN ITCOMM ITDEC ITPLAN ITDESIGN 0.072 0.150 0.151 0.125 0.107 0.065 0.001 0.001 0.005 0.014 p 0.074 0.148 0.167 0.198 0.180 No. Employees 0.060 0.001 0.000 0.000 0.000 p Table 4. Correlations between company size indicators and IT implementation. Sales turnover
Type of production process Job Shop Assembly Line Continuous 83 110 105 Number 2.5516 2.4948 2.5439 Mean 0.9399 1.0232 0.8888 Std. Dev. Table 5. ITPDCTRL and type of production process.
Cellular 105 2.5287 0.8004
ITPDCTRL 0.211 0.000 0.274 0.000
Fixed 9 1.4815 0.5576
TQM implemented Yes No 33503.30 13224.95 Sales turnover 701.16 337.49 No. Employees Table 6. Mean company size and adoption of TQM.
Type of production process
TQM implemented YES NO 43 41 Job shop 51.2% 48.8% 19.5% 21.0% 65 45 Assembly line 59.1% 40.9% 29.5% 23.1% 52 53 Continuous 49.5% 50.5% 23.6% 27.2% 55 52 Cellular 51.4% 48.6% 25.0% 26.7% 5 4 Fixed 55.6% 44.4% 2.3% 2.1% 220 195 Totals 53% 47% 100% 100% Table 7. Type of production process and adoption of TQM.
Total 84 100% 20.2% 110 100% 26.5% 105 100% 25.3% 107 100% 25.8% 9 100% 2.2% 415 100% 100%
25
TQM ITADMN ITCOMM ITDEC 4.5778 3.0403 3.0862 YES 4.4692 2.7186 2.7649 NO 4.5267 2.8893 2.9354 Total Table 8. Adoption of TQM and IT implementation.
ITPLAN 3.2812 2.6970 3.0109
ITADMN ITCOMM ITDEC ITPLAN 0.476 0.448 0.569 0.407 TQM Table 9. Correlations between TQM implementation and IT applications.
ITDESIGN 3.1033 2.7067 2.9184
ITPDCTRL 2.7048 2.2994 2.5136
ITDESIGN 0.385
ITPDCTRL 0.533
TQM dimensions Mean Std. Dev. Top management support 3.1094 0.8962 Customer relationship 3.3936 0.7713 Supplier relationship 3.3800 0.6722 Workforce management 3.0266 0.6584 Employee attitudes 3.2376 0.5277 Product design process 2.8251 0.9229 Process flow management 3.1099 0.7421 Quality data & reporting 3.6464 0.6599 Table 10. Mean and Standard deviation for IT impact on TQM dimensions. IT impact on TQM ITADMN ITCOMM ITDEC ITPLAN ITDESIGN ITPDCTRL dimensions Top management support 0.340 0.362 0.472 0.339 0.282 0.363 Customer relationship 0.182 0.419 0.376 0.244 0.240 0.321 Supplier relationship 0.321 0.361 0.430 0.393 0.259 0.400 Workforce management 0.276 0.365 0.507 0.355 0.317 0.442 Employee attitudes 0.248 0.161 0.319 0.301 0.206 0.362 Product design process 0.219 0.441 0.501 0.388 0.528 0.515 Process flow management 0.169 0.278 0.431 0.266 0.285 0.469 Quality data & reporting 0.378 0.314 0.506 0.300 0.207 0.353 Table 11. Correlations between IT impact on TQM dimensions and IT implementation.
26
Company performance Operational
Quality
PST
TQM implementation
r 0.356 0.405 0.019 p 0.000 0.000 0.780 Table 12. Correlations between TQM implementation and company performance.
PE 0.041 0.552
IT implementation ITADMN ITCOMM ITDEC ITPLAN ITDESIGN ITPDCTRL r 0.226 0.209 0.210 0.073 0.053 0.151 p 0.000 0.000 0.000 0.067 0.136 0.001 Quality r 0.266 0.226 0.242 0.087 0.074 0.172 p 0.000 0.000 0.000 0.095 0.133 0.004 PST r -0.044 0.009 -0.004 0.005 -0.002 -0.018 p 0.186 0.427 0.468 0.457 0.485 0.358 PE r 0.027 -0.007 0.007 -0.019 -0.046 0.020 p 0.295 0.440 0.444 0.352 0.179 0.341 Table 13. Correlations between IT implementation and company performance. Company performance Operational
Company performance Quality Operational PST r 0.365 0.318 -0.002 p 0.000 0.000 0.978 Customer relationship r 0.275 0.215 0.092 p 0.000 0.001 0.184 Supplier relationship r 0.208 0.140 0.121 p 0.002 0.035 0.078 Workforce management r 0.403 0.302 0.067 p 0.000 0.000 0.325 Employee attitudes r 0.342 0.184 0.047 p 0.000 0.005 0.498 Product design process r 0.173 0.138 0.071 p 0.010 0.042 0.312 Process flow management r 0.253 0.204 0.066 p 0.000 0.002 0.339 Quality data & reporting r 0.343 0.319 0.078 p 0.000 0.000 0.253 Table 14. Correlations of IT impact on TQM dimensions and company performance. IT impact on TQM dimensions Top management support
PE 0.024 0.730 0.080 0.244 0.176 0.010 0.078 0.257 0.036 0.596 0.060 0.393 0.070 0.310 0.119 0.081
27
DIMENSIONS Top management support
Customer relationship
Supplier relationship
Workforce management
Employee attitudes & behaviour
Product design process
Process flow management
Quality data and reporting
DESCRIPTION Top management commitment is one of the major determinants of successful TQM implementation. Top management has to be the first in applying and stimulating the TQM approach and they have to accept the maximum responsibility for their products and services. Top management also has to provide the necessary leadership to motivate all employees. The needs of customers and consumers and their satisfaction have always to be in the mind of all employees. It is necessary to identify these needs and their level of satisfaction. Quality is a more important factor than price in selecting suppliers. Longterm relationships with suppliers have to be established and companies should collaborate with suppliers to help improve the quality of products/services. Workforce management has to be guided by the principles of: training, empowerment of workers and teamwork. Plans for recruitment and training have to be implemented and workers need the necessary skills to participate in the improvement process. Companies have to stimulate positive work attitudes, including loyalty to the organisation, pride in work, a focus on common organisational goals and the ability to work cross-functionally. All departments should participate in the design process and work together to achieve a design that satisfies the requirements of the customer subject to technical, technological and cost constraints of the company. Housekeeping along the lines of the 5S concept. Statistical and nonstatistical improvement instruments should be applied as appropriate. Processes need to be error proof. Self-inspection should be undertaken using clear work instructions. Processes should be maintained under statistical control. Quality information has to be readily available and the information should be part of the visible management system. Records about quality indicators have to be kept, including scrap, rework and cost of quality.
Figure 1. TQM dimensions.
COMPANY CHARACTERISTICS •Size •Quality importance •Production Process
INFORMATION TECHNOLOGIES Implementation
TOTAL QUALITY MANAGEMENT Implementation
IT impact on TQM dimensions
COMPANY PERFORMANCE •Quality performance •Operational performance •Financial performance (PST, PE)
Figure 2. IT – TQM framework.
28
SIZE •No of employees •Sales turnover
(+)
INFORMATION TECHNOLOGIES •ITADMIN •ITCOMM •ITDEC •ITPLAN •ITDESIGN •ITPDCTRL
PRODUCTION PROCESS •Job shop •Assembly line •Continuous •Cellular •Fixed
Relationship is significant at p = 0.05 Relationship is non-significant at p ≤ 0.05, except for ITPDCTRL
Figure 3. Company characteristics and IT implementation.
SIZE •No of employees •Sales turnover
(+) QUALITY IMPORTANCE
(+) TOTAL QUALITY MANAGEMENT
PRODUCTION PROCESS •Job shop •Assembly line •Continuous •Cellular •Fixed Relationship is significant at p = 0.05 Relationship is non-significant at p ≤ 0.05 Figure 4. Company characteristics and TQM implementation.
29
INFORMATION TECHNOLOGIES •ITADMIN •ITCOMM •ITDEC •ITPLAN •ITDESIGN •ITPDCTRL
(+)
(+)
TOTAL QUALITY MANAGEMENT
IT IMPACT ON TQM •Top management support •Customer relationship •Supplier management •Workforce management •Employee attitudes •Product design process •Process flow management •Quality data & reporting
Relationship is significant at p = 0.05 Relationship is non-significant at p ≤ 0.05
Figure 5. Relationships among IT, TQM and IT impact on TQM.
TOTAL QUALITY MANAGEMENT
(+) INFORMATION TECHNOLOGIES •ITADMIN •ITCOMM •ITDEC •ITPLAN •ITDESIGN •ITPDCTRL
COMPANY PERFORMANCE •Operational performance •Quality performance
(+)
(+)
•PST •PE
IT IMPACT ON TQM •Top management support •Customer relationship •Supplier management •Workforce management •Employee attitudes •Product design process •Process flow management •Quality data & reporting Relationship is significant at p = 0.05 Relationship is non-significant at p ≤ 0.05, except for supplier management and PE Figure 6. Relationships among IT, TQM, IT impact on TQM and company performance.
30