The Effect of Nanometer-Scale Technologies on the Cache Size Selection for Low Energy Embedded Systems
[email protected],
[email protected]
Abstract - Several studies have shown that cache memories account for more than 40% of the total energy consumed in processor-based embedded systems. In microscale technology nodes, active power is the primary contributor to the total power dissipation of a CMOS chip. However, in nano-scale technologies, leakage power is dominating total power dissipation. In this paper, we show that this fact affects the optimal cache size for low energy embedded systems. We study a number of embedded applications in three different technologies: 180nm, 100nm and 70nm. The results confirm that for a given application, the optimal cache size for minimal energy consumption varies with the technology. Our study further reveals that the change in the optimal size of cache depends on the rate at which cache misses increase when reducing the cache size; when this rate is sharp, the optimal point is the same for all three technologies, however at less steep rates, smaller caches consume the least energy (upto 91% less energy with only 14% performance loss). Consequently in future nanometer processes, unlike previous technologies, cache size should be minimized to obtain the least energy. Keywords: Low Energy, Embedded Systems, Cache Memories, Leakage Current.
Koji Inoue†, and Kazuaki Murakami† ‡ System LSI Research Center Kyushu University Fukuoka, Japan
[email protected],
[email protected]
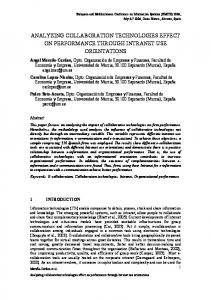
is increasing. For the given example, the dynamic energy in 180nm is almost four times of 100nm and 9 times of 70nm, however the static energy in 70nm is 400 times of 180nm and five times of 100nm. Energy consumption is an important issue for battery powered embedded systems. On-chip cache consumes almost half of a microprocessor’s total energy [2], [3]. Energy efficient cache architecture design is thus a critical 0.3
32K
16K
8K
4K
2K
1K
0.25
Dynamic Energy (nJ)
Hamid Noori†, Maziar Goudarzi‡ Department of Informatics, Graduate School of Information Science and Electrical Engineering Kyushu University Fukuoka, Japan
†
0.2
0.15
0.1
0.05
0 180nm
100nm
70nm
Technology
Fig. 1. Dynamic energy for different cache sizes 300
32K
16K
8K
4K
2K
1K
1
Introduction
Leakage (also known as static) power is becoming the dominant contributor to the power consumption of CMOS integrated circuit. Unlike dynamic power, which depends on the activity in the circuit, leakage exists as long as power supply is applied to the circuit even if there is no activity. Consequently, in general, bigger circuits dissipate higher leakage. Figs. 1 and 2 show the dynamic energy and leakage power for various cache sizes in three different technologies: 180nm, 100nm and 70nm. The values shown are results of running CACTI tool [1], which is widely used for cache power-estimation, and correspond to different sizes of a 4-way set-associative cache with 16-byte block size. The figures clearly state that dynamic and static powers are exchanging their roles. While the dynamic power is decreasing in finer technologies, the static power
Leakage Power (mW)
250
200
150
100
50
0 180nm
100nm
70nm
Technology
Fig. 2. Leakage power for different cache sizes issue in the design of microprocessors that target embedded systems. Since off-chip memory access is costly in terms of power consumption as well as performance, a taken-forgranted remedy is to use a larger cache; this may reduce off-chip access for some programs, but comes at the expense of an increasingly higher power to hold the data
(static power) in nanometer technologies. Performancecritical applications may not care this additional power, but energy-critical applications (especially battery-powered ones) need a cache size balancing the energy savings from higher hit ratio with the energy increase from more leakage. We show in this paper that larger cache is no longer reducing total system energy. The impact of cache parameters such as cache size, number of ways and line size on energy and performance has been shown in [2][4][5]. Reliability is another important factor that has been considered, besides energy and performance, for cache size selection as studied in [6]. In this paper we investigate the effects of target technologies as yet another parameter for optimal cache size selection for low energy embedded systems. Processors are among typical designs that are highly reused and hence ported to new manufacturing technologies as an IP core in new designs. The aim of this paper is to show that when re-implementing a processor-based embedded system in a new technology, cache size may need to be revised due to the increase of leakage current and reduction of dynamic energy, if minimum energy consumption is a must. This paper is organized as follows. In Section 2, we highlight related works. In Section 3, we present our energy evaluation equations and the tools for calculating the dynamic and static energy, then formulate the problem. We present the experimental results in Sections 4 and finally paper is closed by conclusions and future work.
2
Related work
Some researchers have investigated cache architectures for reducing dynamic energy by modifying the lookup procedure. Way predictive set-associative caches [7][8] access one tag and data array initially, and only access the other arrays if that initial array did not result in a match, again resulting in less energy at the expense of longer average access time. Reactive-associative cache (RAC) [9] also uses way prediction and checks the tags as a conventional set-associative cache, but the data array is arranged like a direct-mapped cache. PSAC [10] is physically organized as a direct-mapped cache. Upon a miss, a specific index bit is flipped and a second access is made to the cache using this new index. Since the share of dynamic energy in total cache energy decreases in finer technologies, such techniques lose some significance. Other work focuses on cache architectures that save static energy. Cache decay [11] dynamically turns off cache lines that have not been visited for a designated period, reducing the L1 cache leakage energy dissipation without impacting performance. Zhou [12] proposed to dynamically determine the time interval for deactivating the cache lines, put into sleep mode. In contrast with the shutting off mechanism that loses the information in the cache, a drowsy cache [13] keeps the unused cache line in a low power mode by lowering the SRAM supply voltage while
retaining the contents of the cache. These approaches are used dynamically by monitoring the hits and misses for a cache configuration and are independent of target technology, however in our study we try to show the effect of technology on cache size selection. Therefore, these approaches can be orthogonal to our study. Researchers have recently begun to suggest configurable cache architectures. Kim [14] proposed a multifunction computing cache architecture, which partitions the cache into a dedicated cache and a configurable cache. Another effort is way shutdown cache methods, proposed by Albonesi [4]. Zhang [2] proposed a technique called way concatenation that tunes the cache ways between one (direct-mapped), two and four. A dynamic online scheme that combines the processor voltage scaling and dynamic cache reconfiguration was proposed by Nacul et al. [15]. Zhang et al. [5] introduced an online heuristic that dynamically adjusts the cache size in order to minimize the cache energy. None of these techniques accounts for the change in leakage in different technologies, but to adapt to this effect analyzed in this paper, one way is to use the above reconfigurable caches. Cotterel et al. [16] and Zhang et al. [17] respectively analyze loop caches and victim buffers to reduce energy in embedded systems. In [6] Cai et al. consider another factor, besides performance and energy which is reliability for cache size selection in time-constrained systems. We analyze yet another factor: the manufacturing technology. Bai et al. [20] investigate the impact of Tox and Vth on power-performance trade-offs for on-chip caches. They start by examining the optimization of the various components of a single level cache and then extend this to two level cache systems. We analyze yet two other factors: the manufacturing technology and temperature. Kaxiras et al. [21] propose a mechanism that takes into account temperature in adjusting the leakage control policy at run time. They use a hybrid decay+drowsy policy where the main benefit comes from decaying cache lines while the drowsy mode is used to save leakage in long decay intervals. To adapt the decay mode to temperature, they propose a triggering mechanism that is based on the principles of decaying 4T thermal sensors and, as such, tied to temperature.
3
Problem formulation
In this section, first we discuss our energy evaluation model and then formally define the problem.
3.1
Energy evaluation
The power consumption of CMOS circuits includes dynamic, static, and short circuit power. The short circuit power consumption is much smaller than dynamic and static power, and is negligible. Dynamic power attributes to signal transitions in activated bit- and word-lines, senseamplifiers, comparators, and selectors during reads/writes, while static power is due to the total amount of leakage
current through inactive or OFF transistors. Energy equals power times time. The dynamic energy consumed per access is a sum of the energy spent on searching within the cache, an extra energy required for handling the writes and energy consumed by block replacement on cache miss. Dynamic energy per cache access is the dynamic power of all circuits in the cache multiplied by the time per cache access; the static energy of a cache equals static power multiplied by the time. Dynamic energy consumption causes most of the total energy dissipation in micrometer-scale technologies, but static energy dissipation will contribute an increasingly larger portion of total energy dissipation in nanometer-scale technologies. We consider both types of energies. Another important factor is the energy dissipation due to accessing off-chip memory; fetching instructions and data from off-chip memory is energy expensive because of the high off-chip capacitance and large off-chip memory storage. Additionally, when accessing the off-chip memory, the processor may stall while waiting for the instruction and/or data, and such waiting still consumes some energy. Thus, we calculate the total energy due to memory accesses using Equation 1. In our evaluation the energy is a function of the size of cache (S) and the technology (T). Other parameters assumed to be constant.
energy_uP_stall is the energy consumed when the processor is stalled waiting for the memory system to provide missed instruction or data. According to the explanations and experiments in [2], we assumed: Energy_off_chip_access+energy_uP_stall(T)=20 nJ
3.2
(1)
energy_miss(S,T) = energy_off_chip_access + energy_uP_stall(T) + energy_cache_block_refill(S,T)
energy_static(S,T) = executed_clock_cycles(S) * clock_period * leakage_power(S,T)
Experimental results
(2)
We use applications from Mibench [19] benchmark suite. As mentioned, SimpleScalar and CACTI (version 4.1) are used as our simulation tool and power modeling tool, respectively. Cache hit is assumed to take one clock cycle and cache miss 100 cycles. The clock frequency of the base processor is assumed to be 200 MHz. All applications are executed until completion to obtain the total energy consumption. We study three technologies in these experiments: 180, 100 and 70nm.
(3)
4.1
where energy_dynamic(S,T) = cache_access(S) * energy_cache_access(S,T) + cache_misses(S) * energy_miss(S,T)
Problem definition
In the study that we report in this paper, we assume that the cache organization (for both instruction and data cache), the embedded application and the processor used are all invariant and only the technology and total size of the cache is changing. This reflects a scenario where a processor-based embedded system is re-implemented in different technologies. So in our experiments, the optimization problem is defined as follows: “For a given application, processor architecture, technology, and instruction- and data-cache organization (i.e. the cache associativity and line-size), find the cache size that results in minimum energy consumption (i.e. minimizes Equation 1 for a given technology) over the entire application run.”
4 energy_memory(S,T) = energy_dynamic(S,T) + energy_static(S,T)
(5)
(4)
The values of cache_access, cache_misses and executed_clock_cycles are computed by running SimpleScalar [18] for the given applications with the desired cache configuration. energy_cache_access, energy_cache_block_refill, and leakage_power are energy for accessing the cache, cache block (line) refilling after a cache miss, and the leakage power (static power) of a given cache, respectively, which are computed using CACTI [1] . The energy_off_chip_access is the energy of accessing off-chip memory when there is a miss, and the
Studying the effects on the instruction cache
Fig.3 shows total execution clock cycles for qsort for different instruction caches sizes with a fixed size for data cache. Here the instruction cache is direct mapped with 16bytes line size. As expected, when the cache becomes smaller the execution clock cycles increase due to the increase of misses. Fig. 4, 5 and 6 show the total energy (divided into dynamic energy and static energy) for qsort in three different technologies. According to these figures as the number of misses and hence execution time increases, the dynamic energy grows up as well.
optimal size at new technology (100nm or 70nm) compared to the energy of the cache with minimum energy at 180nm now operating at new technology (100nm or 70nm). The energy saving is calculated using Equation 6 below. In this equation, the energy_cache180_NTech is the energy consumption of the cache configuration with minimum energy consumption for 180nm when the technology is 100nm or 70nm; the energy_cacheNTech is the energy of the cache configuration with minimum energy for technology 100nm or 70nm.
20000 18000 16000
Clock Cycles (M)
14000 12000 10000 8000 6000 4000 2000 0 64K
32K
16K
8K
4K
2K
1K
Cache Size
Fig. 3. Clock cycles for Instruction Cache (qsort) 4000
static
dynamic
Total Energy (mJ) - 180nm
3500 3000 2500 2000 1500 1000 500 0 64K
32K
16K
8K
4K
2K
1K
Cache Size
Fig. 4. Total energy – 180nm – qsort – Instruction Cache static
4000
dynamic
Total Energy (mJ) - 100nm
3500 3000 2500 2000 1500 1000 500 0 64K
32K
16K
8K
4K
2K
1K
Cache Size
Fig. 5. Total energy – 100nm – qsort – Instruction Cache static
5000
dynamic
4500 4000 Total Energy (mJ) - 70nm
However, as the technology is becoming finer the static energy is increasing, so that the static energy of 180nm becomes negligible compared to 100nm and 70nm. As the cache size decreases we expect the reduction of the static energy similar to what happens for 64K, 32K and 16K. However, for 8K we see an increase in static energy. The reason can be understood by looking through Fig. 3. From this figure we learn that for 8K the number of misses increases sharply and consequently the execution time increases. A big increase in execution time causes a big increase in static energy which can be seen for 8K and 4K. Due to the small leakage power of 2K and 1K we see again a decrease in static energy. These figures depict that for 180nm, 100nm and 70nm, there are two different points for a minimum-energy cache size which are 64K (180nm), and 16K (100nm and 70nm). In 180nm, since the effect of static energy is smaller than dynamic energy, dynamic energy dominates the total energy. For 100nm and 70nm, the effect of static power increases which causes the total energy to increase for bigger caches such as 64K and 32K. The curve of total energy becomes similar to that of dynamic energy at cache sizes smaller than 16K since the dynamic energy dominates due to huge number of misses while the effect of static energy decreases due to small size of the caches. Total energy is reduced by 38% and 55% respectively in 100nm and 70nm processes when selecting 16KB size for the instruction cache instead of 64KB. In this application (qsort), this saving comes at a performance penalty of 37% which is the same irrespective of the manufacturing technology, and hence, would finally be acceptable in some future technology node since the energy reduction increases with technology scaling as shown above. We also note that energy is reduced by 50% in 180nm process when employing a 64KB cache instead of 16KB; i.e., bigger cache used to result in less energy. But as shown above, this trend is reversed in nanometer technologies. Table 1 contains more examined applications from Mibench. In this table the cache size with minimum energy for 180nm, 100nm and 70nm are given (the cache configuration is direct mapped with 16 bytes for the cache line size). The energy saving illustrates the percentage of saved energy obtained by resizing the cache to the new
3500 3000 2500 2000 1500 1000 500 0 64K
32K
16K
8K
4K
2K
1K
Cache Size
Fig. 6. Total energy – 70nm – qsort – Instruction Cache
Energy Saving =
950000
(6) * 100
The performance penalty is the percentage of increase in execution time when the cache is resized for the lowest energy. The performance penalty is calculated using the following equation (Equation 7):
Clock Cycles (K)
energy _ cache180 _ NTech − energy _ cacheNTech energy _ cache180 _ NTech
1000000
900000
850000
800000
750000 64K
32K
16K
8K
4K
2K
1K
Cache Size
Fig. 7. Clock cycles for Data Cache (qsort)
Performance Penalty = exec _ time _ cacheNTech − exec _ time _ cache180 *100 exec _ time _ cache180
static
120
(7)
dynamic
where the exec_time_cache180 is the execution time of cache with minimum energy for 180nm and exec_time_cacheNTech is the execution time of cache with minimum energy for 100nm or 70nm.
Total Energy (mJ) - 180nm
100
80
60
40
20
4.2
Studying the effects on the data cache
0 64K
32K
16K
8K
4K
2K
1K
Cache Size
Fig. 8. Total energy – 180nm – qsort – Data Cache static
600
dynamic
Total Energy (mJ) - 100nm
500
400
300
200
100
0 64K
32K
16K
8K
4K
2K
1K
Cache Size
Fig. 9. Total energy – 100nm – qsort – Data Cache 2500
static
dynamic
2000 Total Energy (mJ) - 70nm
We did similar experiments for data cache for qsort. Fig.7 depicts number of clock cycles for qsort when the size of data cache varies from 64K to 1K. It has been assumed that data cache is 2-way set-associative with 16byte line size. Fig.8, 9 and 10 show the total energy (divided into dynamic energy and static energy) for different data cache sizes for qsort, respectively. As in Fig. 4, 5 and 6 in which the curves of dynamic energy are similar to the curve in Fig. 3 (number of executed clock cycles), the curve of dynamic energy in Fig. 8, 9 and 10 are also similar to the curve of Fig. 7. However, we do not see similar changes in static energy of data cache as we saw for instruction cache. Comparing Fig. 3 and Fig. 7 shows that changes in instruction cache size affects execution time (clock cycles) much more than changes in data cache size. The execution time varies from 800 million to 17200 million clock cycles (2031% increase) for different instruction cache size while for different data cache size it ranges from 800 million to 1000 million cycles (25% increase). These big differences in execution time for different instruction cache sizes highly impact the static energy, unlike data cache. According to the results 32K, 2K and 1K are minimumenergy data cache sizes for 180nm, 100nm and 70nm, respectively. In 70nm, the total energy for big caches is dominated by static energy and for small caches the contribution of dynamic energy becomes more.
1500
1000
500
0 64K
32K
16K
8K
4K
2K
1K
Cache Size
Fig. 10. Total energy – 70nm – qsort – Data Cache
The minimum-energy caches for 100nm (2KB) and 70nm (1KB) technologies respectively consume 88% and 56% less energy compared to the minimum-energy cache of 180nm process (i.e. 32KB). The corresponding performance penalty is only 9% and 14% respectively. Again note the reversal of the traditional trend in the relation between cache size and total energy: in 180nm technology, the optimal cache size (32KB) consumes 28% and 40% less energy than 2KB and 1KB caches, but this relation is reversed, with increasing significance, in 100nm and 70nm technologies. Table 2 contains more examined applications from Mibench. The data cache configuration is 2-way with 16 bytes for the cache line size.
4.3
The effect of miss rate on optimal cache size for different technologies
As another application we analyzed basicmath. Fig. 11 shows the number of misses for this application when the instructions cache is once direct-mapped and once more 2-way set associative; Fig. 12 and Fig. 13 show the total consumed energy for each case. The line size is 16 bytes. 1-way
60000
2-way
Number of Misses (K)
50000
40000
30000
According to Fig. 12, for direct mapped cache, the minimum-energy cache size for three technologies is 32K; however in Fig. 13, optimal size changes for different technologies. Fig. 13 depicts that 32K, 16K and 16K are good candidate for 180nm, 100nm and 70nm. From these results we conclude that when the slope of miss rate is very sharp, as for direct mapped cache in Fig. 11 (from 32K to 4K), dynamic energy becomes dominant compared to static energy, and therefore, for any technology we will reach to the same cache size. However when a 2-way set associative cache is used, the sharpness in miss rate diagram flattens and again the static energy becomes more important. That is why in 100nm and 70nm we have a different optimal point compared to 180nm in the 2-way cache. Thus, as the miss ratio variations become softer, the optimal cache sizes for different technologies get farther. The results for instruction cache and data cache of qsort confirm this observation as well; for the instruction cache, where execution clock cycles changes from 800 M to 17000 M (~21 times more—see Fig. 3), the optimal cache sizes are 64K, 16K and 16K, whereas for data cache with softer variation, from 800 M to 1000 M (only 1.2 times more— see Fig. 7 and compare it to Fig. 3), the minimum-energy cache sizes are 32K, 2K and 1K. Consequently, depending on the behavior of the application with respect to smaller cache-sizes, nanometer technologies may, or may not, affect the optimal cache size; intuitively, if the application is not very sensitive to the cache size (due to the application itself, or the cache organization, or both), then the manufacturing technology is more influential.
20000
180nm
1600
100nm
70nm
1400
10000
64K
32K
16K
8K
4K
2K
1K
Cache Size
Fig. 11. Number of misses for 1-way and 2-way Instruction Cache (basicmath) 180nm
1400
100nm
Total Energy (mJ)
1200
0
1000 800 600 400 200 0
70nm
64K
32K
16K
8K
4K
2K
1K
Cache Size
1200
Total Energy (mJ)
1000
Fig. 13. Total energy for 2-way I-Cache (basicmath)
800
600
400
200
0 64K
32K
16K
8K
4K
2K
1K
Cache Size
Fig. 12. Total energy for 1-way Instruction Cache (basicmath)
In the case of the 2-way cache, the optimal cache size for 100nm and 70nm processes (16KB in both of them) respectively consumes 9% and 29% less energy compared to the 180nm optimal cache (32KB) with 25% performance loss. Note again the increasing energy reduction in finer technologies. Furthermore, note that unlike 100 and 70nm technologies, in 180nm technology the bigger (32KB) cache consumes 44% less energy than the smaller one (16KB) over the entire application run. Table 3 contains more examined applications from Mibench for the 2-way instruction cache with 16 bytes for the cache line size.
5
Conclusions and future work
In this paper we studied the effects of different nanometer technologies (three technologies: 180nm, 100nm and 70nm) as yet another factor affecting cache size for different applications targeting low energy embedded computing systems. The results show that for reimplementing low energy embedded systems in a new technology the cache may need to be re-selected. Our study showed that the sharper the slope of miss rate for different cache sizes, the less variation in optimal cache size for different technologies. Consequently when the slope is very sharp, there is only one optimal point for all three technologies whereas when it is getting softer, the optimal cache sizes for the three technologies get farther. The reason is that when the miss rate is sharply increasing, the dynamic energy becomes dominant, due to increase in energy-hungry off-chip memory accesses, however when the miss-rate-increase becomes softer, the static energy dominates the total energy. The experiments showed that in all cases, the optimal cache size decreases in finer technologies despite the increase in misses and dynamic energy. This is due to high impact of static energy in future technologies and confirms that, unlike micrometer-scale technologies, simply adding more cache does not reduce total system energy in future; cache size must be reduced to minimize total system energy in future nanometer technologies. In data cache to due the less cache accesses (less dynamic energy) compared to the instruction cache, this fact is magnified. This is an important conclusion of this paper that highlights the need to new techniques to compensate for the lost performance due to smaller cache. Since the smaller caches are more suitable for low energy systems in finer technologies, finding an optimal cache configuration that simultaneously optimizes performance and energy is increasingly more difficult in future. As one such solution, we are working on optimal combination of a small victim cache and a shrunk ordinary cache so as to reduce the total cache area, and hence, the static power while maintaining the performance of the original cache. The results of our study showed the need to either reanalyze the embedded systems for tuning the cache size or employ a configurable cache to be tunable based on the process technology requirements in addition to other factors affecting optimal cache size.
6
Acknowledgment
This research was supported in part by the Grant-in-Aid for Creative Basic Research, 14GS0218, Encouragement of Young Scientists (A), 17680005, and the 21st Century COE Program. The second author is supported by Core Research for Evolutional Science and Technology (CREST) project of Japan Science and Technology Corporation (JST). We are grateful for their support.
7
References
[1] D. Tarjan, Sh. Thoziyoor, N. P. Jouppi, Cacti 4.0, HP Laboratories, Technical Report, 2006. [2] C. Zhang, F. Vahid, and W. Najjar, “A Highly Configurable Cache Architecture for Embedded Systems,” ACM Transactions on Embedded Computing Systems, Vol. 4, No. 2, May 2005. [3] V.G. Moshnyaga, K. Inoue, “Low-Power Cache Design,” in Low-Power Electronics Design, C. Piguet Eds., CRC Press, 2005. [4] D. H. Albonesi, “Selective cache ways: On-demand cache resource allocation,” 32nd Annual ACM/IEEE International Symposium on Microarchitecture, 1999. [5] C. Zhang, F. Vahid and R. Lysecky, “A self-Tuning Cache Architecture for Embedded Systems”, in Proc. of DATE, 2004. [6] Y. Cai, M. T. Schmitz, A. Ejlali, B. M. Al-Hashimi, and S. M. Reddy, “Cache Size Selection for Performance, Energy and Reliability of TimeConstrained Systems”, ASP-DAC 2006. [7] K. Inoue, T. Ishihara, and K. Murakami, “Waypredictive set-associative cache for high performance and low energy consumption,” International Symposium on Low Power Electronic Design, 1999. [8] M. D. Powell, A. Agarwal, T. N. Vijaykumar, B. Falsafi, and K. Roy, “Reducing set-associative cache energy via way-prediction and selective directmapping,” In the 34th International Symposium on Microarchitecture, 2001. [9] B. Batson, and T. N. Vijaykumar, “Reactiveassociative caches,” International Conference on Parallel Architectures and Compilation Techniques, 2001. [10] B. Calder, D. Grunwall, and J. Emer, “Predictive sequential associative cache,” International Symposium on High Performance Computer Architecture, 1996. [11] S. Kaxiras, Z. Hu, and M. Martonosi, “Cache decay: Exploiting generational behavior to reduce cache leakage power,” 28th Annual International Symposium on Computer Architecture, 2001. [12] H. Zhou, M. C. Toburen, E. Rotenberg, and T. M. Cont, “Adaptive mode-control: A static powerefficient cache design,” 10th International Conference on Parallel Architectures and Compilation Techniques, 2001. [13] K. Flautner, et al. “Drowsy caches: Simple techniques for reducing leakage power,” 35th Annual ACM/IEEE International Symposium on Microarchitecture, 2002. [14] H. Kim, A. Somani, and A. Tyagi, “A reconfigurable multi-function computing cache architecture,” IEEE Transactions on VLSI Systems 9, 4, 509–523, 2001. [15] A. C. Nacul and T. Givargis, “Dynamic Voltage and Cache Reconfiguration for Low Power”, Proc. of DATE 04, 2004.
[16] S. Cotterell and F. Vahid, “Tuning of Loop Cache Architectures to Programs in Embedded System Design,” IEEE/ACM International Symposium on System Synthesis, pp. 8-13, 2002. [17] C. Zhang and F. Vahid, “Using a Victim Buffer in an Application-Specific Memory Hierarchy,” Design Automation and Test in Europe Conference (DATE), 2004. [18] SimpleScalar http://www.simplescalar.com/ [19] Mibench http://www.eecs.umich.edu/mibench/
[20] R. Bai, N. S. Kim, T. H. Kgil, D. Sylvester, and T. Mudge, “Power-Performance Trade-offs in Nanometer-Scale Multi-Level Caches Considering Total Leakage”, Design Automation and Test in Europe (DATE’05), 2005. [21] S. Kaxira, P. Xekalakis, and G. Keramidas, “A Simple Mechanism to Adapt Leakage-Control Policies to Temperature”, International Symposium on Low Power Electronics and Design (ISLPED), 2005.
Table 1. The effect of temperature on the 1-way instruction cache size selection 180nm
basicmath bitcounts Cjpeg Djpeg Lame dijkstra patricia blowfish rijndael average
32K 2K 16K 16K 32K 16K 32K 32K 32K
Cache Size 100nm
32K 2K 16K 16K 8K 16K 32K 32K 32K
70nm
Energy saving
32K 2K 4K 4K 8K 1K 32K 8K 16K
0.0 0.0 0.0 0.0 30.02 0.0 0.0 0.0 0.0 3.33
100nm Performance penalty
0.0 0.0 0.0 0.0 36.39 0.0 0.0 0.0 0.0 4.04
Energy saving
0.0 0.0 3.38 28.12 55.54 14.41 0.0 40.70 8.62 16.75
70nm Performance penalty
0.0 0.0 123.88 79.27 36.39 211.07 0.0 80.40 61.02 65.78
Table 2. The effect of temperature on the 2-way data cache size selection 180nm basicmath susan cjpeg djpeg lame dijkstra patricia blowfish rijndael sha average
4K 8K 32K 32K 32K 32K 32K 32K 32K 32K
Cache Size 100nm 2K 2K 8K 8K 16K 8K 8K 8K 16K 1K
70n m 2K 2K 8K 8K 8K 8K 8K 4K 8K 1K
Energy saving 28.15 34.84 48.13 25.46 21.93 34.44 57.04 57.91 36.61 74.53 41.09
100nm Performanc e penalty 2.73 10.08 12.21 25.96 12.97 35.87 9.85 11.43 9.00 13.7 14.38
Energy saving 43.02 62.20 66.22 58.71 47.52 58.77 77.69 69.28 59.98 91.34 63.47
70nm Performan ce penalty 2.73 10.08 12.21 25.96 53.85 35.87 24.79 52.10 33.89 13.72 26.52
Table 3. The effect of temperature on the 2-way instruction cache size selection 180nm qsort cjpeg djpeg lame dijkstra patricia blowfish rijndael average
32K 8K 32K 32K 8K 32K 32K 32K
Cache Size 100nm 32K 8K 8K 8K 8K 32K 16K 32K
70n m 8K 8K 8K 4K 2K 32K 8K 32K
Energy saving 0.0 0.0 47.49 42.58 0.0 0.0 45.95 0.0 17.0
100nm Performanc e penalty 0.0 0.0 25.07 23.74 0.0 0.0 0.23 0.0 6.13
Energy saving 2.19 0.0 64.25 65.89 23.65 0.0 57.05 0.0 26.62
70nm Performan ce penalty 180.71 0.0 25.07 64.59 55.12 0.0 43.67 0.0 46.14