This is a pre-print of the paper published in the journal of Tribology - Materials, Surfaces & Interfaces, 2014, vol8, no2, pp.98-104. Please access http://dx.doi.org/10.1179/1751584X14Y.0000000066 for the final post-print version.
The effect of test parameters on large particle highspeed slurry erosion testing Niko Ojala1*, Kati Valtonen1, Päivi Kivikytö-Reponen2, Petri Vuorinen2, Pekka Siitonen2 and VeliTapani Kuokkala1
1
Tampere University of Technology, Department of Materials Science, Tampere Wear Center, P.O.Box 589, FI-33101 Tampere, Finland 2 Metso Minerals, Inc., P.O.Box 306, FI-33101 Tampere, Finland *corresponding author, email:
[email protected]
Full contact details: Niko Ojala; Tampere University of Technology, Department of Materials Science, Tampere Wear Center, P.O.Box 589, FI-33101 Tampere, Finland; tel. +358 50 317 4516; email
[email protected] http://www.tut.fi/twc/en Kati Valtonen,; Tampere University of Technology, Department of Materials Science, Tampere Wear Center, http://www.linkedin.com/in/nikoojala P.O.Box 589, FI-33101 Tampere, Finland; tel. +358 40 849 0142; email
[email protected] Twitter.com/Ojala_NJT
Päivi Kivikytö-Reponen; currently employed by VTT Technical Research Center of Finland, P.O. Box 1000, FI-02044 VTT, Finland; tel. +358 40 483 5785; email
[email protected] Petri Vuorinen; currently employed by Patria Land Systems, Naulakatu 3FI-33100 Tampere, Finland; tel. +358 40 869 2081, email
[email protected] Pekka Siitonen; Metso Minerals, Inc., P.O.Box 306, FI-33101 Tampere, Finland; tel. +358 40 537 8840; email
[email protected] Veli-Tapani Kuokkala; Tampere University of Technology, Department of Materials Science, Tampere Wear Center, P.O.Box 589, FI-33101 Tampere, Finland; tel. +358 40 849 0040, email
[email protected]
Abstract: A high speed slurry-pot wear tester was developed for close-to-reality heavy-duty wear testing of materials used in mineral applications. The samples are attached on four levels in a pin mill configuration. The tester and the developed sample rotation test method deliver reproducible results. This study focuses on the effects of testing parameters in large particle slurry testing. Parameters such as the speed, particle size and slurry concentration were varied. Also the effect of test duration was examined. Round steel samples and slurry of water and granite gravel were used for testing. The test parameter variations were 4 to 10 mm for particle size, up to 23 wt% for concentration, and up to 20 m/s for the sample tip speed. The relationships between the parameters are discussed. Also the kinetic energy of the large abrasive particles is considered. Wear surfaces studied with optical and electron microscopy are also presented and discussed.
Key words: Wear testing; Slurry erosion; Slurry-pot; Mining, mineral processing; High speed slurry-pot; Particle size
1. INTRODUCTION Slurry erosion wear can be divided into two main wear mechanisms: abrasion and surface fatigue. With increasing particle size, the wear mechanisms in the slurry systems shift from mild abrasion and surface fatigue towards high stress impact-abrasion for ductile materials. In the mining industry, typically erosion is the major wear mode for example in slurry pumping and mineral transportation and processing. Similar wear mechanisms can also be active in rock drilling and excavation. In mineral handling applications such as slurry transportation the particle size can be as large as several centimetres with slurry speed up to 30 m/s.
A new slurry-pot erosion wear tester was developed at the Tampere Wear Center for slurry erosion testing with high speeds and large particles.1 The tester is based on the pin mill sample configuration that differentiates it from most of the other slurry-pot testers in use. To enable testing also with large size abrasives, the pin mill configuration was chosen because its structure is strong and durable. In the pin mill type slurry-pot wear tester, several samples are attached horizontally to a rotating central shaft on various levels. Other types of slurry-pot test equipment have vertical samples attached to a supporting disc or arms on the same height.2, 3 These are also called whirling disc or whirling arm slurry-pots. The most commonly used slurry-pots are variants of the whirling arm equipment.2
In the published slurry-pot tests,2-4 small abrasive particles have been used, mostly smaller than one millimetre in average size. Moreover, sample speeds have been normally below 10 m/s. Therefore the published studies about the effects of particle size on slurry erosion have been mainly done with particle sizes around one millimetre, such as by Clark et al.4 Only a few studies have been conducted using larger particles, such as the pin mill studies by Jankovic, who used particles up to 5 millimetres in size.5
Possible problems in controlling the test environment and assuring reliable test results due to the nonuniform flow patterns and concentration variations inside the slurry-pot testers during the test have been reported earlier. Gandhi et al. stated that the slurry concentration varies from bottom to top due to the flow patterns.3 In the vertical sample slurry-pots, it is common to use a propeller at the bottom of the pot to circulate the slurry in the pot. In the pin mill type slurry pot, the pin-like samples act as propellers and mix and pump the slurry. In the new high speed slurry-pot erosion wear tester, the challenges with non-uniform flow of the slurry were solved by a sample rotation method.1 By rotating the samples evenly through all sample levels, the overall deviations between the samples are minimised and tests are highly reproducible. With this method, as many as eight materials can be tested simultaneously.
In the present work, the effect of various test parameters, such as sample speed, particle size and slurry concentration, were studied with the novel high speed slurry-pot erosion wear tester. The effect of test duration was also examined. The aim was to obtain a better understanding of the testing conditions and to acquire more knowledge about large particle testing for further development of the method.
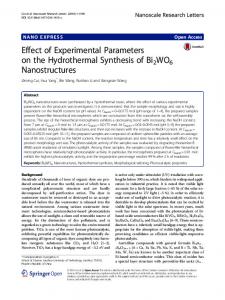
2. MATERIALS AND METHODS A new pin mill type high speed slurry-pot was used to cover various testing conditions in slurry erosion wear with round stainless steel samples. Figure 1 presents a cross-section of the slurry-pot.1 The fins on the inner surface of the pot control the slurry flow and prevent concentration of the abrasives on the walls.
Figure 1. Construction of the pin mill type slurry-pot unit with round samples.
Figure 2 presents the equipment at the Tampere Wear Center. 1 The main shaft is bearing mounted on the lid which seals the pot. The main shaft and the lid are connected to the motor, which enables easy access to
the samples by lifting the shaft out from the pot. Table 1 presents the main characteristics of the equipment.1
Figure 2. The high speed slurry-pot equipment.
Table 1. Main characteristics of the slurry-pot equipment. Pot Diameter 273 mm Height 300 mm Main shaft Diameter 60 mm Motor Power 7.5 kW Sample levels from bottom of pot 4 145 mm 3 110 mm 2 75 mm 1 40 mm
Due to the slurry flow patterns, in the pin mill slurry-pot the samples on different levels are exposed to different slurry concentrations. Therefore, the samples are rotated vertically in the different sample levels.1 Table 2 presents the rotation of the samples in a 4x5 minute test. One test is composed of four parts to have a complete rotation of the samples. The abrasive is changed and the samples are weighted every five minutes, i.e., during the sample level changes. The length of the run time was selected based on the erosion rate and abrasive comminution tests.
Table 2. Sample rotation scheme and run durations used in the tests. Sample levels time [min] One or two samples on each level 0-5 L1 L2 L3 L4 5-10 L4 L1 L2 L3 10-15 L3 L4 L1 L2 15-20 L2 L3 L4 L1
The samples can be either full-length going through the sample holder and the shaft, or half-length so that two separate samples can be used on each level. Therefore, the tests can be done either with four full-length samples or eight half-length samples. Figure 3 presents the dimensions of both sample lengths used in the
current study. In the current tests, both full- and half-length AISI 316 stainless steel samples were used. Hardness of the samples was about 200 HV, and in general the minimum yield strength of the material is 240 MPa and the tensile strength 510 – 770 MPa. This steel was also used in the initial development of the tester and the testing method. The steel was selected firstly because it is rather soft so that the mass loss changes due to the varied testing parameters are easily and reliably detectable, and secondly because of its corrosion resistance so that corrosion effect is minimised, although in large particle slurry erosion corrosion is in a minor role for all metals.
Granite gravel from Sorila quarry in Finland was used as the abrasive. The used particle size distributions were 4/6.3 mm, 6.3/8 mm and 8/10 mm. The maximum abrasive size that can be used with the current sample assembly is limited by the 10 mm space between the samples and the fins shown in Figure 1.
Figure 3. Dimensions of round full-length (upper) and half-length (lower) samples. The 4 mm wide notches in the samples are for fixing them to the sample holder with a set screw.
In the tests, the amount of gravel was varied from one to three kilograms. Thus, the slurry concentration varied from 9 to 23 wt%, when 10 litres of water was added. Moreover, the rotation speed of the main shaft was varied from 1000 to 2000 rpm. In terms of the sample tip speed, the rotation speed varied from 10 to 20 m/s. At the highest slurry concentration the rotation speed had to be reduced by 50 rpm, or 0.5 m/s, due to the power limitations of the motor running the slurry-pot. Due to the pin mill sample configuration the peripheral speed along the sample length varies.1 At 2000 rpm the sample speed is 6 – 20 m/s along the sample length. Table 3 presents the test program. The wear was determined by sample mass loss and the wear surfaces were characterised by optical and scanning electron microscopy (SEM).
Table 3. Testing parameters. Test ‘Weight1’ is the same as ‘Speed3’. Speed Test ID main shaft sample tip Speed1 1000 rpm 10 m/s Speed2 1500 rpm 15 m/s Speed3 2000 rpm 20 m/s Size1 2000 rpm 20 m/s Size2 2000 rpm 20 m/s Size3 2000 rpm 20 m/s Weight1 2000 rpm 20 m/s Weight2 2000 rpm 20 m/s Weight3 1950 rpm 20 m/s
Abrasive Slurry Sample size weight concentration length 8/10 mm 1 kg 9 wt% half 8/10 mm 1 kg 9 wt% half 8/10 mm 1 kg 9 wt% half 4/6.3 mm 1 kg 9 wt% full 6.3/8 mm 1 kg 9 wt% full 8/10 mm 1 kg 9 wt% full 8/10 mm 1 kg 9 wt% half 8/10 mm 2 kg 16 wt% half 8/10 mm 3 kg 23 wt% half
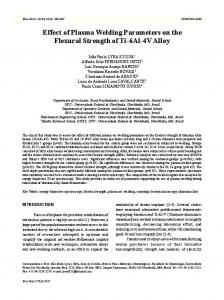
3. RESULTS AND DISCUSSION To determine the best run time for the sample rotation test method, tests with full-length AISI 316 samples, 2000 rpm speed and 9wt% 8/10 mm granite gravel slurry were performed without sample rotation for different run times. Figure 4 presents the average results for the tests. Decrease of the wear rate with longer run times is evident.
1 min
2 min
10 min
15 min
5 min
1.6
Mass loss [g]
1.4 1.2 1 0.8 0.6 0.4 0.2 0 0
5 10 Test time [min]
15
Figure 4. Average mass loss for different run times.
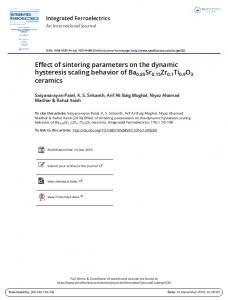
The reason for the decrease in the erosion rate is the comminution of the abrasive particles during testing.1 Figure 5 presents the abrasive size fractions for different run times. The five minute run time was selected to ensure the presence of a sufficient portion of large abrasive particles till the end of the test. Moreover, when the test is repeated four times, the steel samples show a measureable mass loss.
10 min
5 min
1 min
original 8/10 mm
2 min
100
80 60
% 40 20
0 0.1
1 Fraction [mm]
10
Figure 5. Size fractions of the abrasive particles after different run times.
3.1. Sample speed tests According to the test program, three different speeds ranging from 10 to 20 m/s were used with large 8/10 mm granite particles. The same eight half-length samples were used in all three tests. Before the first test the samples were pretested at 2000 rpm for reaching the steady state wear condition. The pretest with fresh samples showed almost 8 percent lower mass loss than the following actual tests with the same sample speed.
Figure 6 presents the average results of eight samples tested at different speeds. The standard deviations of the final results varied from 2 to 4 percent. Also the number of main shaft rotations varied with sample speed as the test time was the same for all tests. Figure 7 shows the results by mass loss per the number of main shaft rotations.
Average mass loss [g]
10 m/s
15 m/s
20 m/s
2 1.5 1 0.5 0 0
5
10
15
20
25
Test time [min]
Figure 6. Test results of the sample speed tests for different sample tip speeds.
Mass loss / number of rotations [µg]
60 50 40 30 20 10 0 0
10
20
30
Sample tip speed [m/s]
Figure 7. Mass loss per the number of main shaft rotations for the tested speeds.
Although the kinetic energy of particles increases with speed, saturation of the mass loss per shaft rotations towards higher speeds can be noticed. This can be explained by abrasive comminution, as at higher sample speeds the abrasives will be crushed faster to a smaller size and therefore particles kinetic energy will be reduced. In addition, the edges of the granite particles become more rounded at higher speeds, which also decrease the wear rate.7 It seems therefore evident that the results are affected by the competition between the kinetic energy and comminution of the abrasives.
3.2. Particle size tests The particle size tests were done with three different particle sizes ranging from 4 to 10 mm. The runningin of the full length samples was done with 8/10 mm particle size at the same speed as the actual tests.
Figure 8 presents the average results after full 20 minute testing in the abrasive size order. The standard deviations within each three-sample sets varied between 0.2 and 0.9 percent. In the results, a slight upward tendency with increasing particle size can be noticed. This is quite expected, as smaller particles with lower impact energy tend to cause less erosion wear in the sample.6 When comparing the particle size test results with the results of the speed and concentration tests, the results have to be divided by two because of the
longer sample length. Figure 9 shows an example how the mass losses develop during a sample rotation test. From the graph it is evident that the wear rate decreases clearly on sample level 3 (L3).
Average mass loss [g]
3.5 3 2.5
2.90
2.94
4/6.3 mm
6.3/8 mm
3.13
2 1.5 1 0.5 0 8/10 mm
Figure 8. Test results for the three different initial particle sizes.
AISI316 (L4-L3-L2-L1)
AISI316 (L3-L2-L1-L4)
AISI316 (L2-L1-L4-L3)
AISI316 (L1-L4-L3-L2)
Cumulative mass loss [g]
3
2.5 2 1.5 1 0.5 0
0
5
10
15
20
Test time [min]
Figure 9. Cumulative mass loss in a sample rotation test with 4/6.3 mm particle size.
Although in these tests the particle size was the varied parameter, it was not the only changing parameter. With an increase in the particle size, the number of particles decreases, as the slurry mass concentration is kept unchanged, i.e. the total weight of the particles is the same. When this is taken into account and the
total mass loss is divided by an estimate of the initial particle count, a strong trend is clearly visible in
Mass loss / initial particle count [µg]
Figure 10, which presents the results as mass loss per particle count. 4000 3500 3000 2500 2000 1500 1000 500 0 0
2
4
6
8
10
Average original particle size [mm]
Figure 10. Mass loss per initial particle count for the tested particle sizes.
3.3. Slurry concentration tests For the slurry concentration tests two tests (‘Weight2’ and ‘Weight3’) were made. The results of test ‘Speed3’ were used as test ‘Weight1’, as denoted in Table 3. The same half-length samples were used as in the speed tests, so no running-in was needed. To study the wear surfaces after the higher concentration tests, i.e. tests with 16 and 23 wt% concentrations, two fresh and untested samples per each test were used and studied with a stereo microscope and SEM after the tests.
Figure 11 presents the average results during the tests. The standard deviations of the final results ranged from 2.6 to 3.8 percent. The results are quite expected, i.e., higher concentration means more particles in the slurry, which again means more mass loss in the sample.
Average mass loss [g]
9 wt%
16 wt%
23 wt%
4 3 2 1 0 0
5
10
15
20
25
Test time [min]
Figure 11. Results of the slurry concentration tests.
Figure 12 presents the final mass loss results as a function of abrasive concentration. The dashed trend line is set to start at the origin of the plot. Although it is not directly evident from the results, it could be expected that with increasing concentration the wear rate stabilises at a certain level when the particles start to collide more with each other than with the samples. 8 Also embedding of the surfaces with abrasive particles is increased when more particles are present, which can decrease the mass loss as they start to
Mass loss [g]
shield the surface. 5 4.5 4 3.5 3 2.5 2 1.5 1 0.5 0 0.00 %
10.00 %
20.00 %
30.00 %
Slurry concentration [wt%]
Figure 12. Mass losses at different slurry concentrations.
3.4. Wear surfaces During testing the sample tips were rounded heavily. Figure 13 presents stereo microscope images of the sample tips after tests with 16 and 23 wt% slurry concentrations. A clear difference in the material removal at the sample tips can be noticed, as higher slurry concentration causes more severe tip rounding. Similar effect was notable in all tests.
Figure 13. Sample tips after the tests with 23 wt% (left) and 16 wt% (right) slurry concentrations.
Figure 14 shows a general view of the wear surface tested with a high slurry concentration. Superficially the wear surfaces looked essentially the same after each test, but the smaller details of slurry erosion wear, such as the depth and number of impact craters, length of the abrasive scars, or amount of embedded abrasive particles varied. Tests with high slurry concentrations left much more embedded particles on the specimen surfaces than the tests with lower concentrations. Also the abrasive wear scars on the surfaces were short and scarce. Clearly more scars were found in specimens tested with lower concentration. Figure 15 presents a more detailed view of the wear surface produced with a high slurry concentration, showing
that the surface is more deformed and rougher due to the higher amount of impacts caused by the higher amount of abrasive particles in the slurry.
Figure 14. Wear surface after a test with a slurry concentration of 23 wt%.
ba
Figure 15. Scanning electron microscope images of the wear surface after a test with 23 wt% slurry concentration, a) secondary electron image showing the surface profile, and b) back-scatter electron image showing the embedded abrasive particles as dark regions. Both images are from the same location. Scale bars 200 µm.
Figure 16 present scars on the samples tested with 16 wt% slurry. In the slurry erosion of ductile steels, abrasion is the major mechanism causing mass losses. Other wear processes such as impacts are mostly deforming the surface, and because of that the abrasion scars are scarce and mostly short. The longer the test time or the higher the concentration, the less the scars are visible.
a
b
Figure 16. Scanning electron microscope images of the wear surface after a test with 16 wt% slurry concentration, a) a long wear scar and an embedded abrasive particle in middle of it, and b) multiple short wear scars. Scale bars 50 µm and 10 µm.
4. CONCLUSIONS
High-speed slurry erosion wear tester can be used to simulate various applications related to mineral handling and processing.
Problems with non-constant test environment inside the slurry-pot are solved by the test method.
Slurry erosion with large particle sizes was studied with three different sample speeds, particle sizes, and slurry concentrations.
At high sample speeds the mass loss is in general higher than at low speeds. However, the wear rate starts to stabilise at higher sample speeds when all other parameters are kept unchanged. The kinetic energy competes with the comminution of the abrasive particles. At higher speeds the kinetic energy of abrasive particles is higher, but because of increasing comminution the energy per particle (impact) decreases faster.
The mass loss increases exponentially with particle size. Larger particles have more kinetic energy and they withstand comminution longer than smaller particles.
With increasing slurry concentration the sample mass losses become higher. At very high concentrations, however, collisions of particles with each other and the amount of embedded particles increase, decreasing the wear rate.
ACKNOWLEDGEMENTS The work has been done within the DEMAPP program of FIMECC Ltd. We gratefully acknowledge the financial support from Tekes and the participating companies. The corresponding author would also like to express his gratitude to Jenny and Antti Wihuri Foundation.
REFERENCES [1] N. Ojala, V-T. Kuokkala, K. Valtonen, P. Kivikytö-Reponen and P. Vuorinen: ‘High Speed Slurry-Pot Type Erosion Wear Tester’, Proc. Symp. The 15th Nordic Symposium on Tribology - NordTrib 2012, Trondheim, Norway, 2012, Paper 35. [2] A.A. Gadhikar, A. Sharma, D.B. Goel and C.P. Sharma: ‘Fabrication and Testing of Slurry Pot Erosion Tester’. Trans. Indian Inst. Met., 2011, DOI 10.1007/s12666-011-0075-8. [3] G.R. Desale, B.K. Gandhi and S.C. Jain: ‘Improvement in the design of a pot tester to simulate erosion wear due to solid-liquid mixture’. Wear 259 (2005) 196-202. [4] H.McI. Clark and R.B. Hartwich: ‘A re-examination of the ‘particle size effect’ in slurry erosion’, Wear 248 (2001) 147–161. [5] A. Jankovic: ‘Variables affecting the fine grinding of minerals using stirred mills’. Minerals Engineering 16 (2003) 337–345. [6] A. Misra and I. Finnie: ‘On the size effect in abrasive and erosive wear’. Wear 65 (1981) 359-373. [7] G.B. Stachowiak and G.W. Stachowiak: ‘The effects of particle characteristics on three-body abrasive wear’. Wear 249 (2001) 201-207. [8] J.E. Miller: ’Friction, Lubrication, and Wear Technology’, ASM Handbook vol 18, Slurry Erosion, p 233–235; 1992, ASM International.