Five assessment tools are used: âScience and Technology Course Attitude ... the following: Applications of the system
THE EFFECTS OF SYSTEM DYNAMICS APPROACH IN SCIENCE EDUCATION IN MIDDLE SCHOOL
Hasret Nuhoglu, Gazi University, Faculty of Education, Science Education Department, Ankara, Turkey Mert Nuhoglu, Bogazici University, Industrial Engineering Department, Istanbul, Turkey
Abstract The aim of this study is to 1) apply system dynamics approach in 7th grade middle school students in science and technology course, 2) determine the problems in field application, 3) improve the students’ attitude against course and some skills such as problem solving, understanding the causal relationship and graphing with analyzing the relationship, 4) provide an effective learning and teaching tools for students and teachers. Another aim of this study is to investigate how system dynamics approach help constructivism. The experimental design with pre-post test with control group is applied in this research. The study was applied with 81 students in middle schools in Istanbul / Turkey. Five assessment tools are used: “Science and Technology Course Attitude Scale”, “Scientific Success Test”, “Cause-Effect Relationship Scale”, “Graphing and Analyzing Skills Scale”, “Problem Solving Skills Inventory”. Improvements due to system dynamics are observed in the tests that measure: scientific success, perceived problem solving skill, ability of understanding graphics, ability of understanding causality relationships. However in the boundaries of the research, no improvements were observed in the following attitudes: perceived understanding of causality relationships perceived graphics drawing and reading ability, perceived interest into science and technology course. Key words: system dynamics approach, constructivist learning, science and technology course.
INTRODUCTION System dynamics has been applied in many diverse fields outside the education. Most popular system dynamics study is the “Limits to Growth” book which was commissioned by the Club of Rome in the 1970’s (Meadows et al, 1972; Forrester, 1973). This study showed that the natural balance in the earth would be broken until the year 2000 if no precautions are taken. The study triggered a lot of controversy but the discovery of the Antarctic ozone hole in 1985 made an effect on the public opinion of the world citizens and political leaders and urged them to take precautions for the problems mentioned in the “Limits to Growth”. As a result of these actions, the many countries around the world started to take decisions to prevent the production of the gases that cause ozone depletion. System dynamics studies caused important changes in the fields of management and economy as well. Having inspired by these successful policy changes in a lot of fields, the system dynamics researchers targeted to apply the system dynamics approach in the educational fields too. First educational applications showed that important improvements can be obtained in this field as well (Forrester, 1996). The students in the schools, where system dynamics approach is used, run voluntary projects in relation with their school courses even after the school time. The students became so enthusiastic with the subjects that they made their parents to take part in the projects too. There is a remarkable increase in the interest and understanding level of the students to the courses. This increase caused an expectation in the practitioners that this approach will enter the general education system in the USA. But in the time that passed, the researches saw that
the level of system dynamics applications have not reached the intended level (Forrester, 1996). There are various opinions on the causes of this gap. Most important reasons among these are the following: Applications of the system dynamics approach in the K-12 education has not focused on the development of the lesson plans and applications that are based on the pedagogical methods that enhance learning. The practicing teachers focused on the rules of system dynamics and they neglected practical principles for the successful applications (Forrester, 1996: Lyneis, 2000). Therefore a few curriculum projects based on the system dynamics have been developed (Stacin, Cc-Stadus, Cc-Sustain, Science Ware). By using these projects, a lot of new ideas and useful models are provided for the practicing teachers to apply system dynamics in the classroom. System dynamics is a communication means between mental models and simulations. Mental models of humans are powerful in terms of knowledge but weak in terms of calculating the behavioral results of the models. Simulation models that are based on the mental models complements the lack of human minds in calculating complex, dynamic behavior (Forrester, 1996). Another benefit of simulation models is that it helps experimentations which improve learning process (Martin, 1997). Using system dynamics approach the modelers produce simulation tools called as micro worlds. The students use these tools to make certain experiments. These tools are actually replacements for the real world. That is why they are called as micro worlds. The experiments in the micro worlds can be repeated easily using varying parameters and alternative scenarios. This allows the student to see how the dynamics of the system works, by experiencing it in the virtual world. Usually, there is no other way of observing the results of the experiments outside of the micro worlds. The experiments are done with the help of certain easy to use simulation software. Dynamo, Powersim, Vensim, Stella, ithink, Extend and Anylogic are some of the system dynamics software (Martin, 1997; Alessi, 2000). Stella is the mostly preferred tool for the K-8 students. (Brown, 1992; Forrester, 1996). System dynamics approach makes it easy for students to focus on the causes of the events. Moreover the students understand that there are usually more than one cause and effect relationships under the complex systems. In addition, students see that the result of the combined interactions of all the cause and effects relationship cannot be analyzed by superficial studies. Undoubtedly the goal of the education is beyond teaching students certain courses. It is not sufficient to reach the goals of the education system, when the students can correctly answer the questions they are asked. Education system also aims that students should be able to construct the problems by themselves. Constructing problems necessitates a deeper look than answering problems. To construct problems, it is necessary to observe the environment. Moreover it is necessary to have a critical view for the issues and see the world from unusual perspectives. The individuals that gained this perspective are more flexible, tolerant, productive and valuable for the society. The reason for these qualifications is that students are aware that there is not a unique truth. They are aware of the fact that truth can change with respect to the conditions and time. The individuals that have these qualifications are more valuable for their societies because they can discover the hidden problems in the life and they can provide effective suggestions to solve the problems. The aim of this study is to 1) apply system dynamics approach in 7th grade middle school students in science and technology course, 2) determine the problems in field application, 3) improve the students’ attitude against course and some skills such as problem solving, understanding the causal relationship and graphing with analyzing the relationship, 4) provide
an effective learning and teaching tools for students and teachers. Another aim of this study is how system dynamics approach could help constructivism.
METHODOLOGY The models of research The experimental design with pre-post test with control group is applied in this research. Independent variable is “system dynamics approach”. Experimental group was taught with system dynamics approach. Control was taught with standard syllabus. The students in experimental and control group were selected randomly. It was investigated whether there was a statistical difference among students’ science and technology course attitude, scientific success, problem solving skills, understanding causeeffect relationship, graphing and analyzing skills. Research sample The study was applied in 2007-2008 semester with a total of 81 students (40 in experimental group, 41 in control group) the 7th grade in middle schools in Istanbul / Turkey.
Assessment tools In order to assess the sub problems of the study, five assessment tools are used: a) “Science and Technology Course Attitude Scale” developed by researchers in order to assess students attitude and interest about science and technology course and science activities. b) “Scientific Success Test” developed by researchers in order to assess students’ success about subject of spring mass systems, work- energy, type of energy and energy conservation. c) “Cause-Effect Relationship Scale” developed by researchers in order to determine how students evaluate the relationship between cause and effect on sample events and learns their attitude about cause and effect relationship. d) “Graphing and Analyzing Skills Scale” developed by researchers in order to evaluate students’ skills of drawing a graphic and commenting this graphic and learn their attitude about drawing and analyzing a graphic. e) “Problem Solving Skills Inventory” developed by Heppner and Petersen (1982) in order to evaluate student’s problem solving skills. Statistics used realibity analysis Cronbach’s Alpha, which is widely used in empirical research, estimates the reliability of a test consisting of parallel items. Kaiser-Meyer-Olkin (KMO) displays the measure of sampling adequacy. KMO takes values between 0 and 1, with small values indicating that overall the variables have too little in common to warrant a factor analysis.
Bartlett’s test is a test of the hypothesis that all factor standard deviations (or equivalently variances) are equal against the alternative that the standard deviations are not all equal. Kuder-Richardson (KR-21) measure inter-item consistency. They are computed by using statistical models which determine what proportion of the total variance on the test scores is contributed by the covariance between the items. a) Attitude Scale of Science and Technology Course The attitude scale of science and technology course measures the attitude and interest of middle school students towards the science course and the activities within the science course. The scale was developed by the researcher. Its Cronbach’s alpha value is 0.87, thus it is assumed to be reliable in statistical sense. The validity of the scale is verified by expert opinions and statistical factor analysis. The scale consists of 20 3-point lickert-type questions where 10 questions are positive and 10 questions are negative. The scale has KMO value 0.86 and Bartlett’s value 28761. These results show that factor analysis is appropriate for the scale and there is a correlation between the variables (questions). Common variance of 20 questions, for which factor analysis is applied, varies in a range between 0.16 and 0.75. The variables are clustered in 5 factors that have an eigenvalue greater than 1. These 5 factors explain 56% of total variance in data. b) Scientific Success Test This test aims to determine the learning levels of the middle school students’ learning levels of some topics contained in the syllabus of the science and technology course. The tested topics are “spring-mass systems” and “work and energy”. The test is developed by the researcher. Its content validity is verified by expert opinions. The test is refined with item analysis to increase the discrimination power of the test and to make it not too difficult or too easy. The reliability analysis is done by statistical methods. The KR-21 value is 0.72 which is generally accepted as reliable. Some of the questions were filtered out because of their difficulty and discrimination levels. The final test includes 20 multiple choice questions. c) Causality Relationship Scale Causality relationship scale measures students’ perceptions of their abilities to understand the causality relationships between events. The scale has been developed by the researcher. The scale consists of two parts. First part of the scale measures the attitudes towards the causality relationships. Its Cronbach’s alpha value is 0.88, thus it is assumed to be reliable in statistical sense. Its validity is verified by expert opinions and statistical factor analysis. The scale consists of 10 5-point lickert-type questions where 5 of the questions are positive and 5 of them are negative. The scale has KMO value 0.86 and Bartlett’s value 543.5. Thus the scale is appropriate for factor analysis. All the questions are cluster in the first factor that has an eigenvalue greater than 1. The explained variance is 50%. Second part of the scale consists of open ended questions on the opinions of the students about exemplary events. d) Scale for the Ability of Graphics Drawing and Analysis The scale has been developed by the researcher. It consists of two parts. First scale measures the attitudes towards graphics drawing and reading. Its Cronbach’s alpha value is 0.85, thus it is assumed to be reliable in statistical sense. Its validity is verified by expert opinions and statistical factor analysis. The scale consists of 8 5-point likert-type questions where 4 of the questions are positive and 4 of them are negative. The scale has KMO value 0.86 and
Bartlett’s value 395.408. Thus the scale is appropriate for factor analysis. All the questions are cluster in the first factor that has an eigenvalue greater than 1. The explained variance is 49%. Second part of the scale consists of open ended questions on the opinions of the students about examplary graphics. e) Problem-Solving Skills Inventory The scale measures the individual’s perception of his problem solving skills. It has been developed by Heppner and Petersen (1982). The scale consists of 35 6-point likert-type questions. The questions are clustered in 3 factors (confidence to solving problems, approach/avoidance, and personal control) the scale has Cronbach’s alpha value 0.90. The scale has been adapted to Turkish by several researchers. Taylan (1990) applied the test to university students and found the reliability index of the test as 0.66 by tckran method. The scale hes been applied to various student groups by a variety of researchers (Şahin, Şahin and Heppner, 1993; Savaşır and Şahin 1997; Korkut 2002). The validity and reliability analyses of the scale were repeated by the researcher in an application to 215 middle school school students. Cronbach’s alpha value is 0.826. The scale consists of 20 questions (13 positive, 7 negative). Factor analysis showed that common variance of the questions vary between 0.43 and 0.71. The factor loadings vary between 0.39 and 0.77. Variance that is explained by the 5 primary factors is 58%.
Application Steps of the Research 1.
Pre-application of the experimental study was done during 2007 spring with a group of 20 students. The aim of pre-application was to discover probable problems that were going to be encountered during the study. Real application was designed by taking the findings obtained during pre-application into account.
2.
Application schools and the experimental and control groups within these schools were determined by random assignment.
3.
In one of the schools control group was taught by the actual teacher. In the other school control group was taught by the researcher. Experimental groups were taught by the researcher in both schools. The teaching was performed during 2007-2008 fall semester as 4 weekly hours in science and technology course.
4.
Pre-tests were done during 15-19 October 2007 where the questions in the scales were answered by all control and experimental groups.
5.
System dynamics approach was introduced to experimental groups in 4 study hours. During the introductory course the students learned the basics of system dynamics approach and they built models presented as exemplary scenarios.
6.
During 29 October-02 November week, the topic of “spring-mass systems” were studied in both schools. During 05-09 November week, the topic of “work and energy”, during 12-16 November week, the topic of “energy types and preservation of energy” were studied in both schools. The teaching of the curriculum material was the same for control and experimental groups. There were 4 study hours available in each week. 2 of them were used for the teaching of curriculum material in both control and experimental groups. Remaining 2 hours were used for exercises in control group whereas these hours were used for system dynamics approach in experimental group. Design of experiment is shown at Table 1.
Table 1 Design of Experiment 1. School (Turkan Sedefoglu) experimental group
control group
2. School (Ibrahim Hakki) experimental group control group
curriculum material
2 hours/week
2 hours/week
2 hours/week
2 hours/week
teached by
researcher
school teacher
school teacher
school teacher
2 hours/week exercises
2 hours/week system dynamics modeling
2 hours/week
teaching method
2 hours/week system dynamics modeling
teached by
researcher
school teacher
researcher
school teacher
supplementary material
exercises
7.
Post-tests were applied during 19-22 November.
8.
Qualitative interviews were done during 26-30 November with the students and teachers that participated in the experimental study.
9.
Total duration of the experimental study was 8 continuous weeks.
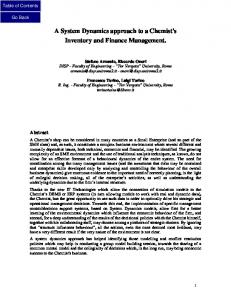
Learning topics with system dynamics approach Experimental group students attended the introductory system dynamics lectures. During these 4 study hour lectures, they learned the relationship between system and dynamics, basic elements of a system (stock and flow, feedback loops, causality relationships). Also they learned using stella program to build and test models and interpret the dynamic behavior of a model. The students built models of spring-mass systems step by step using recently learned concepts and causality relationships between the concepts. They found out what kind of changes happened to the springs after applying force. They decided how the mathematical equations can be applied on the model. They achieved to produce the graphical output of dynamic behavior of the system where more than one variable is shown together in the graphics. At each lecture, students made additions to the model. They discussed the model with their friends. The curriculum material of National Education Ministry (MEB, 2006) in Turkey for 2006 was taught in both control and experimental groups according to the constructivist learning method. Students learned the topics with activities and class discussions. The only difference between the control and experimental groups lies in the supplementary material. Supplementary material of the control group was the exercise problems given in the workbook. This material was replaced with system dynamics modeling activities in the experimental group. The activities and content of the lectures are shown in Table 2. The final model developed by the experimental group is shown in Figure 3.
Table 2 The activities and content of the lectures in two groups Groups Introduction course
1. course (ıntroduction to spring mass systems)
2. course (work energy)
and
Experimental - System and dynamics concept’ meaning - Stock, flows, feedback and cause-effect relationships - Model building with Stella program - Testing and interpreting models - Study with senarious 1. senario: bathtube dynamics 2. senario: skunk number 3. senario: fir tree number 4. senario: changing in city population 5. senario: changing water quantity in reservoir Activities - Playing with springs - Making a spring - Designing a dynamometer Building spring mass system model Testing model Interpreting model Activities - Do we work in which situation - Is there any work?
Control - introduction to constructivist learning - introduction to activities - information about course
Activities - Playing with springs - Making a spring - Designing a dynamometer Engaging, Exploring, Explaining, Elaborating, Evaluating Activities - Do we work in which situation - Is there any work?
Adding work and energy model in spring mass system model Testing model Interpreting model 3. course (types energy)
of
4. course (conservation of energy)
Activities - Velocity, mass and kinetic energy relationships - What is the potantial energy depend on? - What is the spring flexibility potantial energy depend on? Adding kinetic, potantial and spring flexibility energy model in spring mass system model Testing model Interpreting model Activities - How does the energy transfer? Developing last models Testing model Interprating model
Activities - Velocity, mass and kinetic energy relationships - What is the potantial energy depend on? - What is the spring flexibility potantial energy depend on? Activities - How does transfer?
the
energy
Table 3 The final model developed by the experimental group Introduction to spring mass systems
Models of systems position
position change
f orce
v elocity
spring constant v elocity change
Graphics
mass
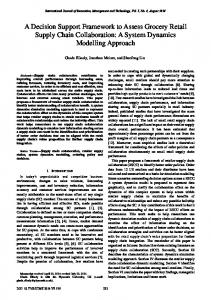
Models of systems
Work and energy Type of energy (kinetic, potantial, spring potantial energy)
position
conversiton of the energy
work
position change
kinetic energy v elocity f orce
v elocity change spring constant potantial energy mass spring potantial energy
grav itation constant
Graphics
Statistical Techniques Used In the Research Collected data are analyzed with 3 statistical methods: •
Descriptive statistics of the means and standard deviations are found for each scale and group.
•
Paired t-tests are applied for comparison of pre and post-tests for each scale and group. Pre-test of the group is compared with the post-test of the same group to see whether there is any change in a group between pre and post study. The aim is to show whether the teaching activities implies an improvement in the skills and attitudes of the students in comparison to doing nothing.
•
Independent t-tests are applied for comparison of two groups for each scale. The aim is to show whether the system dynamics approach implies an improvement in comparison to the traditional supplementary materials.
FINDINGS Statistical Values of mean and standart deviation The result of pre and post test score made on attitude about science and technology course, success, problem solving skills, figuring out the cause and effect relationship, graphing and analyzing skills of students in experimental and control groups are shown on Table 4. Table 4 Statistical Values of Mean and Standard Deviation e1 c1 5.26 4.74 SST 29.0 31.0 Graphic 1 0.5 -0.3 Graphic 2 74.0 75.5 PSSI 38.6 35.2 Causality 1 -0.1 -0.6 Causality 2 12.63 11.07 Attitude e1: experiment pre-test e2: experiment post-test
Mean e2 8.67 30.9 3.7 78.2 40.8 2.2 14.24
c2 7.01 32.0 1.5 72.7 40.8 0.4 10.82
Standard deviation e1 c1 e2 3.2 3.2 4.3 5.8 7.6 7.2 1.4 1.2 1.6 17.4 13.7 11.5 7.7 14.2 7.5 0.9 0.7 1.8 6.36 6.86 5.51 c1: control pre-test c2: control post-test
c2 4.5 6.1 1.4 14.0 7.4 1.1 8.31
When the table 4 is checked, it can be seen that pre-test scores of experimental group and control group is not equal but are quite close. The reason is random selection among both groups. As per post achievement tests, the success score has been increased in both groups. This increase is higher in experimental group. When standard deviation values are considered, in the end of empirical study it is seen that there is an increase in both groups but the increase in experimental group is lower. It means that the difference in the scores of students is lower in experimental group. When the students’ answers for problem-solving skills inventory are evaluated, it is seen that although the score of control group is higher at the beginning, in the end of the empirical study, the mean of experimental group is higher than the mean of control group. A decrease is seen in the standard deviation of experimental group at their post tests When the students’ attitude score of science and technology is examined, in the post tests, it is seen that the attitude score of control group has been decreasing whereas an increase has been seen in the score of experimental group. But this increase is not too much. In the end of the empirical study, the difference between the answers of control groups has been increased.. The understanding scale of cause and effect relationship has two sections. At first section (causality 1) the cause and effect relationship oriented of interest and attitude of the students are evaluated, at second section (causality 2) commenting and confirming of cause and effect relationship skills of the students in some sample cases are evaluated. Taking into the consideration the mean values which were taken from students’ data, at first section the initial scores of experimental and control groups are different at the beginning whereas their mean scores is equal in the end of the empirical study. As per second section, in the end of the empirical study it is obvious that cause and effect relationship skills of the students have been increased. Graphing and analyzing scale has two sections. At first section (graphic 1) graphing and analyzing oriented of interest and attitude of the students are evaluated, at second section (graphic 2) graphing skills and their commenting skills on those graphics of the students are
evaluated. In the end of the empirical study, the increase in mean score of experimental and control groups is very close at graphic 1 scale. But in the end of the empirical study an increase has been seen in the mean of experimental groups’ students’ answers given to graphic 2 scale. An improvement has been seen in graphing and commenting graphics skills whereas the students’ graphing oriented attitude scores did not change. The effects of the system dynamics approach students’scientific success (SST) The result of pre and post test score made on success of students in experimental and control groups are shown on Table 5.
Table 5 Statistical Values of SST Tests
SST
Groups E1 E2 C1 C2 C1 E1 C2 E2
p
t
0.00% 0.00% 23.22% 4.67%
-5.94 -4.49 -0.73 -1.69
is difference SD useful significant? or not? Yes Yes No No Yes
Experiment biased
No
When the table 5 is examined, a significant difference is not seen among the students’ success scores prior to the empirical study and this result indicates that the experiment is not deviate. At the beginning both groups are at the same level. An increase is seen in the success score of both groups’ students. This is an expected result because at control group the subjects are also performed by constructivist learning. Statistically there is significant difference between both groups in the end of the empirical study (t=-1.69; p.05). In the classes where system dynamics approach is performed, it is obvious that there is no an improvement in graphing and analyzing oriented of attitude of the students. At the beginning, the students in experimental and control groups are not at the same level, the students in experimental group are more successful at graphic 2 scale, therefore experiment is deviated. This deviate arises from the random selection of students in both groups. According to the analyze results gaining from graphic 2, there is no a serious difference at both groups in the end of empirical study (t = -6.29; p.05). In the classes where system dynamics approach is performed, it is obvious that ideas of the students about cause and effect relationship did not change. The results gained from causality 2 scale shows that there is an increase in previous and post empirical study in both groups. Cause and effect relationship is understood better by the students in experimental group, according to mean scores. It can be said that the system dynamic provides benefit of understanding and commenting of cause and effect relationship. The effects of the system dynamics approach students’ attitude about science and technology course The result of pre and post test score made on science and technology course attitudes of students in experimental and control groups are shown on Table 9. Table 9 Statistical Values of science and technogy course attitude Tests
Groups E1 E2 C1 C2 C1 E1 ATTITUDE C2 E2
p 85.04% 97.78% 88.78% 44.26%
t
1.0518 2.0748 1.2243 -0.1448
is difference SD useful significant? or not? No No No No No
Experiment biased
No
When the Table 9 is examined, in previous (t = 1.22; p>.05) and post (t = -0.14; p>.05) empirical study, it is seen that there is no serious difference in students’ attitude of science and technology course. In the end of empirical study, initially, although the students having the same scores have a little incremental increase in mean of experimental group, this increase is not meaningful at statistical level. The reason for the outcome “the system dynamics approach does not cause a difference in the student’s attitude of science and technology course” should be further research. Experimental Group Students’ interpretation About System Dynamics Approach The interpretation of the experimental group students’ ideas about system dynamics approach are presented as he following: “I’m glad to study in computer environment. These courses attracted my attention because of differences from the other” “I did not know how to build a model, learning new information was interesting to me”
“I struggle with determined converters after found stock and flows. Sometimes I drew wrong graphic as I did not understand the relationships between concepts truly. I understand that the direction of relationship is more important...” “organizing the mathematical equations was difficult for me. Mathematical equations in first three scenarios in introduction course were easier than other scenarios. I saw that it was not difficult, as I guess, after my teacher helped me...” “at first designing stock and flows, using Stella software was difficult for me. I was bored of redesigning stock and flows but at the end as I learn using Stella I began to feel happy. I began to trust myself...” “I calculated to change how skunk numbers in ten years with curiosity in skunk scenario in introduction course. Estimating about future was very interesting...” “I was always curios how reservoir works. we built a model in system dynamics laboratory with Stella. It was very complex for me but I will examine and think how reservoir works when I go home...” “I couldn’t estimate city population would increase so much, this result was very surprising...” “I did not think that we will build a spring mass system model while we were making empirical activity about spring mass system. I observed that the spring extension when I hang up some weight to spring but I did not think that extension measure will affect velocity. I could understand relationship between position and velocity better...” “I was interested in drawing model’s graphics very much in building models stage. There were several variable points on the graphics and they showed with different color. The graphic was similar to motion of spring mass...” “In the beginning subject of spring mass systems was very boring for me. I wanted to finish this course immediately. But when we started to modeling with Stella I tried to understand what we did. Modeling spring mass systems on my own and then comparing with my friends’ models was very enjoyable...” “I was bored because I had difficulty to decide what the stocks and flows in spring mass systems at the beginning of the modeling. After my teacher give me some clues about stock and flows I found them easier. Sometimes I constructed relationship between concepts wrongly but I enjoyed this study like puzzles...” “I did not construct conceptual relationships correctly because I did not know mathematical equations so much better...” “I couldn’t understand what have we done while doing activity about spring mass system but I learned concepts and tried to find concept relationships with modeling. My model got more complex as adding new concepts but I was glad to struggle with complexity...”
It was observed that students had positive attitudes toward system dynamics approach according to interview results from students. They became more eager to learn subjects because they built models on my own, shared models with friends, studied in computer environment. It was determined that students had difficulty in defining stock and flows, feedback loops and in realize cause- effect relationships and in locate mathematical equations.
DISCUSSION System Dynamics is a well formulated methodology for analyzing a system that includes several causality relationships, time delays, and feedback loops (Forrester, 1973; Senge, 1990; Sterman, 2000). It began in the business and industry world, but is now affecting education and many other disciplines. More experts are willing to use the ability of the System Dynamics methodology to bring order to complex systems. This will help people learn such systems in a more effective way (Forrester, 1996; Alessi, 2005). System dynamics has been applied in a lot of diverse fields such as engineering, physics, economics and social sciences. Having inspired by successful policy changes in many fields, the system dynamics researchers targeted to apply the system dynamics approach in the educational fields too. First educational applications showed that important improvements can be obtained in this field as well (Forrester, 1996). The students in the schools, where system dynamics approach is used, run voluntary projects in relation with their school courses even after the school time. The students became so enthusiastic with the subjects that they made their parents to take part in the projects too. There is a remarkable increase in the interest and understanding level of the students to the courses. This increase caused an expectation in the practitioners that this approach will enter the general education system in the USA. But in the time that passed, the researches saw that the level of system dynamics applications have not reached the intended level (Forrester, 1996). This situation means that system dynamics approach was fail to apply practically. The improvements gained in the schools in USA, Germany, Scandinavia, China, Japan and other countries where system dynamics approach is applied in the education were so high that it is worth to do further study to solve the related problems. If the curriculum and techniques that simplify the application of system dynamics approach in the education can be developed, we believe that significant improvements in the education levels of the students will be gained. A few curriculum projects based on the system dynamics have been developed (Stacin, CcStadus, Cc-Sustain, Science Ware) in order to apply system dynamics approach easily in courses. By using these projects, lots of new ideas and useful models are provided for the practicing teachers to apply system dynamics in the classroom (Alessi, 2005). Many researchers and teachers (Clauset, 1982; Hassell, 1987; Evans, 1988; Webb, 1988; Draper and Swanson, 1990; Hopkins, 1992; Davidsen, Bjurklo, Wikström, 1993; Ossimitz, 1996; Zaraza and Fisher, 1997; Coffin, 1999; Ticotsky, Quaden and Lyneis, 1999; Alessi, 2000; Lyneis and Fox-Melanson, 2001; Shaffer, 2006; Cruz and et al., 2007) applied system dynamics approach in their classes or experimental studies and attained positive results. A common finding of these teachers is that by using system dynamics tools learning becomes more learner-centered and cooperative. System dynamics lead students to discover problems by putting puzzle pieces together, looking for similar patterns and working with their friends to actively generate questions in various disciplines. All these activities are coherent and make a great benefit for children. The work is interdisciplinary in primary and middle school. Students can learn the basics of system dynamics very efficiently (Lyneis, 2000). In this research it was determined that students developed some skills like realizing and interpreting cause-effect relationship, gaining problem solving competence, drawing and analyzing graphics competence by using system dynamics approach. These results from investigation are similar to literature findings. Everyone who teaches System Dynamics modeling has reported how difficult it is, even though the benefits are great (Forrester, 1992, 1996; Lyneis, 2000, Alessi, 2005). There are some common difficulties when applying system dynamics in school. Students are hard to
distinguish stocks from flows. Instead of understanding the system under study, they try to fit the mathematical formulas that they have in mind without thinking deeply. When simulation doesn’t produce expected behavior, they include so called fudge factors. Fudge factors are variables specifically designed to fix the problem artificially. They are not representation of any real thing. Students don’t test their models well. Therefore the models don’t work under different conditions. They build unnecessarily complex models. They try to build imitations of textbook models. The teachers don’t realize that building a realistic model requires really long time. Patience is a pre-condition for students and teachers when building system dynamics models (Forrester, 1996; Alessi, 2005). In this research, middle school students learned various topics of science and technology course with supplementary activities of system dynamics approach. The topics taught are spring-mass systems, work and energy, energy conversion. The students learned basic concepts (stock-flow, causality relationships and feedback loops) of system dynamics in applying in those science topics. Students had difficulties at first on what the stock and flow variables were, when they were modeling spring-mass systems. Reminding them the stock flow relationship in the bath tube example helped them to build the model of spring-mass system. Adding causal feedback loops to the model was another difficulty for students. Teachers have to be patient in order for the students to build better models with time. The students who learned this approach will be able to use this problem definition and solution tool for their whole life because system dynamics is a general approach for defining and solving problems (Forrester, 1961, 1973; Sterman, 2000). This approach helps students to get the discipline and sensitivity of a scientist. In this way students can have abilities to actively observe their environment, discover new problems, model and investigate these problems in a scientific way (Forrester, 1992, 1996). In this research, results show that students improved their competence of determining and solving problems have supported literature results. RESULTS AND SUGGESTIONS Analysis results show that system dynamics approach has some benefits in learning science topics. In the boundaries of this research, system dynamics approach had no effect in the following attitudes: perceived understanding causality relationships (causality 1 scale), perceived graphics drawing and reading ability (graphics 1 scale), perceived interest into science and technology course. Since the study was done in a setting of 4 weeks, these results seem as expected. According to the researcher’s observations the interests and attitudes of the students towards the system dynamics approach increased steadily during the study. However according to the pre and post-tests of the attitude scale there was no detection of perceived attitude towards science and technology course. This is not surprising since the attitude towards a subject depends on more than one factor. Therefore in order to increase the positive attitude, these factors should be studied in detail. Scientific success tests show that students had a higher success when supplementary material is taught with system dynamics approach. Control group’s post-tests show an increase as well in comparison to their pre-tests. Curriculum material in control and experimental groups was taught according to the constructivist method. System dynamics approach is consistent with constructivist method and is an effective supplementary method to reinforce constructivist learning.
Perceived problem solving skills improved with system dynamics approach. The experimental group had a significant increase in this scale. Second part of causality relationship scale consists of open-ended questions. These questions help us to assess whether the students have the ability to determine the relationships between causes and effects correctly. The answers of the questions were evaluated as true or false. After the study both control and experimental groups had an increase in comparison to their pre study levels. The increase in the mean of the experimental group was higher than control group. Therefore it is reasonable to conclude that system dynamics approach has a positive impact on the ability of understanding causality relationships for students although the perceived attitude towards causality did not increase in the experimental group. The steadiness of attitude may be due to external factors that are not handled in the research. Second part of the scale for the ability of graphics drawing and analysis measures objective success rate of the students in solving graphics related problems. The experiment showed that system dynamics approach has a significant improvement in this ability. Nevertheless the perceived attitude did not change in the first part of the graphics scale. A spring-mass system is an ideal topic to apply system dynamics approach in science course. Before starting with modeling of the spring-mass system, the students need to be introduced to the Stella software and basics of model building. Basic concepts like stock-flow, feedback loop, causality relationships and graphics drawing and reading abilities need to be introduced as well to the students with exemplary scenarios. An ideal learning environment would include discussion of a topic, student-directed research, laboratory experimentation, model building and exploration, and computer simulation to verify the link between model behavior and experimental observations. The overall goal is to teach students critical thinking skills and a methodology for dealing with complex problems that they can use later in life as managers, company presidents, journalists, generals, pilots, and engineers (Martin, 1997). The use of computers in the classroom in contrast to computer lab has important results. Students learn and build simulation models in parallel. They work in groups. This helps communication between students (Brown, 1990). System dynamics approach consists of two parts: building the model and testing it. Both parts employ mathematical equations. The relationships between the elements are established through the mathematical relations. New curriculum does not contain as much mathematical relations as the older one. But a student that does not know the mathematical relation between the concepts cannot build the model of the system.
REFERENCES Alessi, S. M. (2000). Designing Educational Support In System-Dynamics-Based Interactive Learning Environments. Simulation&Gaming. 31(2), 178-196. Alessi, S. (2005). The Application of System Dynamics Modeling in Elementary and Secondary School Curricula. http://web.archive.org/web/20060304015136/http://www.c5.cl/ieinvestiga/actas/ribie200 0/charlas/alessi.htm Brown, G. S. (1990). The Genisis of the System Thinking Program at the Orange Grove Middle School, Tucson, Arizona . Personal report.
Brown, G. S. (1992). Improving Education in Public Schools: Innovative Teachers to the Rescue. System Dynamics Review, 8(1), 83-89. Clauset, K. H. (1982). Effective schooling: a system dynamics policy study. Unpublished Ed D. Boston university school of education. Coffin, S. (1999). Getting Started with Systems Thinking in the Primary Grades. www.clexchange.org/ftp/documents/ Implementation/IM1999-03GettingStartedST.pdf Cruz M., González M. T., Restrepo M. P., ve Zuluaga M. L. (2007). Colombian Classroom Experiments: A Preliminary Report. CLE Newsletters, 16 (1). Davidsen, Bjurklo, Wikström (1993). Introducing System Dynamics in Schools: The Nordic Experience. Draper, F. Ve Swanson, M. (1990). Learner-directed systems education: a successful example System Dynamics Review. 6 (2), 209-213. Evans, J. K. (1988). Application of system dynamics as a strategy for teaching management concepts. Unpublished Ed D. Boston University. Forrester, J. W. (1961). Industrial Dynamics. Waltham, MA: Pegasus Communications. Forrester, J. W. (1973). World Dynamics (2 ed.). Waltham, MA: Pegasus Communications, 144. Forrester, J. W. (1992). Road Map 1: System Dynamics and Learner-Centered-Learning in Kindergarten through 12th Grade Education. MIT System Dynamics in Education Project. Forrester, J. W. (1996). Road Map 1: System Dynamics and K-12 Teachers. MIT System Dynamics in Education Project. http://web.archive.org/web/20060430061546/http://sysdyn.clexchange.org/sdep/papers/ D-4665-4.pdf Hassell, D.J. (1987). The Role Of Modelling Activities in The Humanities Curriculum, With Special Reference To Geography: An Đnvestigate Study. London: King‘s College. Heppner ve Petersen (1982). The Development and Implications of a Personal ProblemSolving Inventory. Journal of Counseling Psychology. 29, (1), 66-75. Hopkins, P. L. (1992). Simulating Hamlet in the Classroom. System Dynamics Review, 8 (1), 91-98. Korkut, F. (2002). Lise Ögrencilerinin Problem Çözme Becerileri. Hacettepe Üniversitesi Eğitim Fakültesi dergisi, 22: 177-184. Lyneis, D. A. ve Fox-Melanson, D. (2001). The Challenges of Infusing System Dynamics into a K-8 Curriculum. International System Dynamics Society Conference, Atlanta, Georgia. Lyneis D. A. (2000). Bringing System Dynamics To A School Near You Suggestions For Introducing And Sustaining System Dynamics In K-12 Education. International System Dynamics Society Conference Bergen, Norway.
Martin, L. A. (1997). Road Map 2: The First Step. MIT System Dynamics in Education Project. http://sysdyn.clexchange.org/sdep/Roadmaps/RM2/D-4694.pdf Meadows D. H., Meadows D. L., Randers J., & Behrens W. W. III., (1972). The Limits to Growth. New York: University Books. ISBN 0-87663-165-0 MEB, (2006). New Curriculum Program in Turkey. http://ttkb.meb.gov.tr/ogretmen/modules.php?name=Downloads&d_op=viewdownload &cid=48 Ossimitz, G. (1996). Projekt "Entwicklung vernetzten Denkens" (Endbericht an die Forschungskommission ). Translated from Germany; Ossimitz, G. (2000). Teaching System Dynamics and Systems Thinking in Austria and Germany. System Dynamics Conference in Bergen, Norway. Shaffer, C., S., (2006). Toward a System Dynamics Model of Teaching Computer Programming Via Distance Education. Unpublished PhD dissertation. The Pennsylvania State University. Senge, P. M., (1990). The Fifth discipline: The Art and Practice of the Learning Organization. New York: Doubleday Currency. Sterman, J. D., (2000). Business Dnamics: Systems Thinking and Modelling for a Complex World. Boston, MA: Irwin McGraw- Hill. Savaşır, I. ve Şahin, N.H. (1997) Bilişsel-Davranışçı Terapilerde Değerlendirme: Sık Kullanılan Ölçekler, Türk Psikologlar Derneği Yayınları. Ankara. Şahin, N., Şahin, N.H., ve Hepner, P. P., (1993). Psychometric Properties of the Problem Solving Inventory in a Group of Turkish University Students. Cognitive Therapy and Reseaarch, 17 (4): 379-396. Taylan S. (1990). "Heppner'in problem çözme envanterinin uyarlama, güvenirlik ve geçerlik çalışmalan". Yayınlanmamış Yüksek Lisans Tezi. A.Ü. Sosyal Bilimler Enstitüsü. Ticotsky, A., Quaden, R. ve Lyneis, D. (1999). The In And Out Game: A Preliminary System Dynamics Modeling Lesson. http://sysdyn.mit.edu/cle/ Webb, M.E. 1988. An investigation of the opportunities for computer based modelling and the possible contributions to children‘s learning, in secondary school science. London: King‘s College. Zaraza, R. Ve Fisher, D. (1997). Introducıng system dynamıcs ınto the tradıtıonal Secondary currıculum: the cc-stadus project's search for Leverage poınts. www.clexchange.org/ftp/documents/ Implementation/IM1997-07SDLeveragePoints.pdf -