With the proliferation of cloud computing and the Soft- ware as a Service model the ... to increase the utilization of servers in a data center is to use virtualization. ... VM layer and call into the hypervisor are of importance. For our experiments we ...
The Effects of Virtualization on Main Memory Systems Martin Grund, Jan Schaffner, Jens Krueger, Jan Brunnert, Alexander Zeier Hasso-Plattner-Institute at the University of Potsdam August-Bebel-Str. 88 Potsdam, Germany
{martin.grund, jan.schaffner, jens.krueger, jan.brunnert, alexander.zeier}@hpi.uni-potsdam.de ABSTRACT Virtualization is mainly employed for increasing the utilization of a lightly-loaded system by consolidation, but also to ease the administration based on the possibility to rapidly provision or migrate virtual machines. These facilities are crucial for efficiently managing large data centers. At the same time, modern hardware — such as Intel’s Nehalem microarchitecure — change critical assumptions about performance bottlenecks and software systems explicitly exploiting the underlying hardware — such as main memory databases — gain increasing momentum. In this paper, we address the question of how these specialized software systems perform in a virtualized environment. To do so, we present a set of experiments looking at several different variants of in-memory databases: The MonetDB Calibrator, a fine-grained hybrid row/column inmemory database running an OLTP workload, and an inmemory column store database running a multi-user OLAP workload. We examine how memory management in virtual machine monitors affects these three classes of applications. For the multi-user OLAP experiment we also experimentally compare a virtualized Nehalem server to one of its predecessors. We show that saturation of the memory bus is a major limiting factor but is much less impactful on the new architecture.
1.
INTRODUCTION
With the proliferation of cloud computing and the Software as a Service model the sharing of computing resources has become increasingly important. A widespread technique to increase the utilization of servers in a data center is to use virtualization. In this paper, we analyze the impact of virtualization on main memory database performance. While at first thought one would expect significant cache trashing due to the fact that the design of modern main-memory databases often directly exploits specific concepts of the underlying hardware (e.g. prefetching, vectorization) [14], we
Permission to make digital or hard copies of all or part of this work for personal or classroom use is granted without fee provided that copies are not made or distributed for profit or commercial advantage and that copies bear this notice and the full citation on the first page. To copy otherwise, to republish, to post on servers or to redistribute to lists, requires prior specific permission and/or a fee. DAMON’10 Indianapolis, Indiana USA Copyright 2010 ACM 978-1-4503-0189-3 ...$10.00.
show that virtualization does in fact not inhibit these optimizations. The reason is that main memory databases essentially eliminate one layer in the storage hierarchy since data that is being operated upon is kept in DRAM. When solely reading memory pages the hypervisor must often not be called, which limits the overhead incurred by virtualization. We address the question of how these specialized main memory database systems perform when used in conjunction with virtualization. To do so, we present a set of experiments looking at several different variants of in-memory databases: The MonetDB Calibrator, a fine-grained hybrid row/column in-memory database running an OLTP workload, and an inmemory column database running a multi-user workload. Our experiments with the calibrator show TLB misses which are invisible in a physical system because they are hidden between L2 cache misses are visible in a virtualized environment. Thus, there is a quantifiable overhead for memory address translation in virtual machines. HYRISE, our hybrid row/column in memory database, exhibits very similar patterns of behavior when run natively compared to running in a virtualized environment. The relatively modest overhead increases with the amount of data being read by a query. The in-memory column store database running a multi-user variant of the TPC-H benchmark exhibits a constant throughput degradation of 7% when run in a virtualized environment at normal utilization. When increasing the utilization by running the benchmark in multiple VMs on the same physical host at the same time, response time degrades up to 60%, although more than sufficient CPU resources and main memory are a available for handling the workload. We identify the bottleneck to be the main memory bus and show that this degradation in response time is largely alleviated when the VMs are run on servers based on Intel’s Nehalem platform, where each CPU has a private memory controller.
2.
CHALLENGES IN MEASURING VIRTUALIZED SYSTEMS
The common approach to observe the performance of a main memory system is to use hardware performance counters available in modern CPUs. Those performance counters can be read by platform independent software layers such as PAPI [13]. The advantage of such performance counters is that they provide very precise information about the state of the system. This and other approaches that fall into the category of sample based profiling work very well as long as such performance counters are available.
In virtualized systems, however, such performance counters are typically not available. Even though with paravirtualization the hypervisor is only a very thin layer on top of the actual virtual machine (VM), virtualization of such performance counters is complex. Since each virtual machine has an “own” view of the available CPUs, each virtual machine sees a different state of the available performance counters. When virtualizing such counters, for each context switch of the scheduler the state of the VM has to be preserved and restored. Due to this complex behavior, it is not precisely quantifiable how big the performance overhead of performance counter virtualization is. Furthermore not only the VM is of interest for performance measurements but also the hypervisor. In this case metrics of how often the running process has to leave the VM layer and call into the hypervisor are of importance. For our experiments we tried different approaches: on the one hand we evaluated the performance of the system in a non-virtualized (“‘physical”’) environment and compared to a virtualized system, on the other hand we used Xenoprof[6] for profiling performance counters in the virtual environment in addition to simple time based measuring. As a last point it is important to mention that due to the additional hypervisor layer choosing the right memory allocator becomes important. Since memory management is handed down to the hypervisor by the VM operating system and thus uses calls that exit the VM using a hypervisor with a thread local storage is of great importance to avoid leaving the VM for each malloc call.
3.
EXPERIMENTS
The goal of our evaluation was to test the complete stack in different ways by increasing the complexity of the tested system step by step. The first level of our test is simply testing size and latency of the caches of the underlaying hardware. The next level tests the performance of a fine-grained main memory database with single-threaded workload, and as a last step evaluate the performance of a multi-tenant setup optimized for hosted scenarios.
3.1
Hardware Setup
In this section we describe the test setup we used during our experiments. The main component for our test is one IBM series blade with an Intel XEON E5450 CPU running at 3.0 Ghz. The blade server is equipped with 4 × 16 GB of memory (64G B in total). The base system for all experiments is a recent Debian distribution running a 2.6.21 Linux kernel. For virtualization we use a Xen 3.4 hypervisor, the virtualized systems are the same Debian systems with a kernel that has Xen capabilities. The advantage of our approach is that the virtualized systems are equal to the physical systems in terms of kernel version and installed software. The Xen installation supports two different virtualization approaches: paravirtualization and full virtualization. Paravirtualization requires a modified version of the operating system to call the hypervisor API instead of native resources, while full virtualization in contrast does not require a modified operating system but usually requires complete emulation of system components by the virtualization software. We left full virtualization out of scope since it requires to emulate all system resources and would therefore induce additional virtualization overhead. An initial test confirmed that full virtualization yielded significantly lower
Description L1 Size L1 Miss Latency L1 Replace-Time L2 Size L2 Miss Latency L2 Replace-Time TLB Miss-Latency
Physical System 32kb 10 cycles 12 6MB 197 cycles 334 cycles -
Virtualized System 32kb 10 cycles 12 6MB 196 cycles 333 cycles 23 cycles
Table 1: Calibrator Results Physical vs. Virtualized System performance.
3.2
MonetDB Calibrator
The Calibrator as presented in [5] is a small software tool written in C to determine the systems properties about the cache sizes and access latency of the different memory hierarchy levels. In our set of experiments the Calibrator represents the lowest possible level for measurements. It only accesses local memory and performs a well defined set of operations. Comparing the access latency in a virtualized and physical environment should give a first hint on possible performance penalties. The tests are executed without the help of any of the hardware performance counters available and thus rely only on time based measurements. Table 3.2 shows the results of a measurement run on both the physical and virtual test systems. In both cases we used a data region of 1 GB. From the result of the test run we can derive an interesting fact: In both cases the detected sizes for L1 and L2 cache are identical, as are the times for the latency. The only observed difference between both systems is the cost for TLB misses. While on the physical system no TLB — even though the TLB exists — could be detected, the Calibrator detects a TLB on the virtualized system. The reason for this behavior is that the latency of the TLB is hidden behind the latency of an L2 cache miss. However, in a virtualized system address translation is handed down to the hypervisor and thus creates additional overhead. Even though this micro-benchmark shows that the absolute memory access performance in a virtualized system is equivalent to the physical system the additional overhead for address translation can become a problem, since it becomes more important when more data is being read.
3.3
HYRISE — A Hybrid Main Memory Storage Engine
In the second series of experiments we wanted to evaluate the performance impact of virtualization when using our fine grained hybrid main memory database prototype called HYRISE. A hybrid main memory database system allows to store data both using a columnar and row-oriented representation. A course grained hybrid system allows to choose the storage representation for each relation, while in our finegrained prototype we allow arbitrary vertical partitioning of any relation into groups of attributes. The goal of this vertical partitioning is to create the best possible layout for one relation in terms of performance for a given workload. Using two experiments from our original layouter to determine the influence parameters for row and column storage we compare the performance for virtualized and physical systems.
3.3.1
Experiments Overview
Performance Gain for other Allocators
1.3 1.25 1.2 1.15 1.1 1.05 1 0.95 0.9 0.85
Accelerator, for our experiments. We are interested in understanding the effects of virtualizing the CPU and the physical system’s main memory in the case of a main memory column store. For this purpose, we run a multi-user version of the TPC-H benchmark1 , which will be described in the next paragraph. Afterwards, we will discuss our findings.
3.4.1
Google Allocator Intel TBB Allocator 0
10
20
30
40
50
60
70
80
90
100
Columns in Projection
Figure 3: Comparing Different Memory Allocators 1. Projectivity — In this experiment we load two tables: one with 100 single column groups and another table with one group of 100 columns. During the experiment we increase the number of projected attributes. The goal of this benchmark is to observe the impact of partial projections in different setups.
1. The TPC-H tables lineitem and orders are combined into one table called lineorders. This change transforms the TPC-H data model from 3rd Normal Form (3NF) into a star schema, which is common practice for data warehousing applications. 2. The TPC-H table partsupp is dropped because it contains data on the granularity of a periodic snapshot, while the lineorder table contains data on the finest possible granularity: the individual line items. It is sufficient to store the data on the most fine-grained level available and to obtain numbers on a more coarse granularity by aggregation.
2. Selectivity — In this experiment we load two tables: one with 16 single column groups and one table with one group spanning 16 attributes. We now execute a query that reads the complete width of the table while varying selectivity from 0 to 1.
3.3.2
Evaluation
The general observation from Figure 1(a) is that the virtualized system behaves just as the physical system. The observations from Figure 1(b) and 1(c) show that the performance of the virtualized system depends on the amount of data read. This assumption can be verified when looking at the results of the selectivity experiment. The setup of the experiment is as follows: For row-wise attribute storage a table is loaded that is 16 integer values wide, for the column-wise storage a table with 16 groups of one integer attribute each is loaded. A list of randomly uniform distributed positions is generated at which the data shall be read. This generates a probable cache miss pattern as shown for e.g. in [5]. For each column a distinct memory location has to be read, requiring to load a complete cache line even though only a fraction of it is used. Contrary when reading selective data from the row store only the requested cache line is touched and read completely. TLB from the previous experiment. On the physical system the latency of the TLB is hidden by the L2 miss and thus cannot be measured, while the address translation on the virtual system is more expensive and the latency of the TLB becomes measurable. As a last step we evaluated the performance gain when using a different allocator for the experiments. The advantage of other allocators such as the Intel TBB Allocator is that they use thread local memory storage to avoid heap contention and memory reuse. For the projectivity experiment in row-wise storage using those allocators improves the performance by approx. 10% as can be seen in Figure 3.3.2.
3.4
Virtualizing OLAP Workloads
In the following, we will discuss how the use of virtualization affects OLAP workloads. Column-oriented databases are well known to be suitable for analytic workloads [12, 15]. Since this paper focuses on main memory databases, we use SAP’s in memory column database TREX [9, 10, 4], the database engine underlying SAP’s Business Warehouse
Experiment Setup
For the experiments presented in this paper we adapted the Star Schema Benchmark [8], a modified version of the TPC-H benchmark which has been adjusted for OLAP workloads. At the level of the data model, the most important differences between TPC-H and SSB are the following:
While TPC-H has 22 independent data warehousing queries, SSB has four query flights with three to four queries each. A query flight models a drill-down, i.e. all queries compute the same aggregate measure but use different filter criteria on the dimensions. This structure models the exploratory interactions of users with business intelligence applications. We modified SSB so all queries within a flight are performed against the same TREX transaction ID to ensure that a consistent snapshot is used. We also extended SSB with the notion of tenants and users. While multi-tenancy can be implemented on multiple levels (i.e. shared machine, shared process, and shared tables [3]), we chose the shared machine variant for the experiments presented here. With shared machine multi-tenancy, every tenant either gets their own database process or a distinct virtual machine. Since this paper is focused on virtualization, we chose the latter. For our multi-tenant OLAP use case, the use of independent virtual machines is desirable when high isolation among the tenants is required. In our particular setup, each tenant has the same number of rows in the fact table.
3.4.2
Basic Overhead of Virtualization Compared To a Physical System
As a first simple experiment, we ran the workload with one single tenant natively on the machine and increased the number of parallel users for our tenant from 1 to 12. We then ran the same experiment inside a Xen virtual machine on the same server which was configured such that it can use all the resources available on the physical system (CPU and main memory). Please note that size of the tenant in compressed columns was significantly smaller than the 32 GB available on the machine, so that no paging occurred even with the additional RAM consumed by the Xen processes enabling the virtualization. 1
http://www.tpc.org/tpch/
1 x 100 attributes physical 1 x 100 attributes virtual
1.6e+06 Time in ms
1.5e+06 1.4e+06 1.3e+06 1.2e+06 1.1e+06 1e+06 0
10
20
30
40
50
60
70
80
1.3
Overhead - 1 is Physical System
Overhead - 1 is Physical System
1.7e+06
100 x 1 attributes Physical System Trendline
1.25 1.2 1.15 1.1 1.05 1 0.95 0.9
90 100
0
10
20
30
Columns in Projection
40
50
60
70
80
90
100
1.3 1.25 1.2 1.15 1.1 1.05 1 0.95 0.9 0.85
1 x 100 attributes Physical System Trendline
0
10
20
Columns in Projection
(a) Row Storage
30
40
50
60
70
80
90
100
Columns in Projection
(b) Column Storage
(c) Row Storage
Overhead - 1 is Physical System
2
Overhead - 1 is Physical System
Figure 1: Projectivity comparison (a) and by overhead for column-wise (b) and row-wise (c) attribute storage Overhead for 16 x 1 attribute Physical System Trendline
1.8 1.6 1.4 1.2 1 0.8 0
0.1
0.2
0.3
0.4
0.5
0.6
0.7
0.8
0.9
1
2
Overhead for 1 x 16 attribute Physical System Trendline
1.8 1.6 1.4 1.2 1 0.8 0
Selectivity 0..1
0.1
0.2
0.3
0.4
0.5
0.6
0.7
0.8
0.9
1
Selectivity 0..1
(a) Column Storage
(b) Row Storage
Figure 2: Overhead of selectivity comparison for column (a) and row (b) wise attribute storage 5.5
CPU’s memory-management unit and thus needs to call the hypervisor, which Xen circumvents in the read-only case [2].
5 Queries per second
4.5 4
3.4.3
3.5 3 2.5 2 1.5 virtual
1 0
2
4
6
physical 8
10
12
Client Threads
Figure 4: Basic Overhead of Virtualization for InMemory OLAP Figure 4 shows that the throughput in terms of queries per second is 7% lower on average in a Xen-virtualized environment. We believe that this overhead is largely due to the fact that TREX needs to allocate main memory to materialize intermediate results during query processing. While read access to main memory is cheap in Xen, the hypervisor must be called when allocating memory. Additionally, the a column scan is not guaranteed to result in a scan of a contiguous region in main memory since Xen uses shadow page tables to give the guest OS the illusion of a contiguous address space, even though the underlying hardware memory is sparse [2]. The hypothesis that the overhead can be largely attributed to the handling of intermediate results is supported by our observation that the physical configuration spends 5.6% of the CPU cycles in the kernel (switch to kernel mode triggered by the TREX process), while the virtual configuration spends 6.2% cycles plus additional 3.5% cycles in the Xen layer. The function names called in those Xen modules suggest that they are concerned with memory management tasks. Although we only tested on the Xen virtualization platform, the 7% overhead is somewhat a best case since with other virtualization platforms such as VMWare the guest operating system cannot directly use the
Response Time Degradation With Concurrently Active VMs
A widespread reason for the use of virtualization is to increase the utilization of otherwise lightly loaded servers by consolidation. This increase in utilization does, however, not come for free. After quantifying the basic overhead incurred by virtualization, we looked into the “background noise” which results from running multiple virtual machines concurrently on the same physical host. We configured the Xen host system such that the physical machine was split into 4 VMs. Each VM was configured with two virtual CPU cores which Xen dynamically schedules across the 8 CPU cores of the physical machime. Since the OLAP workload under investigation is CPU-bound given that enough bandwidth is available so that the CPUs never stall, we believe it makes sense to slice the physical machine into VMs by distributing the CPU cores across the VMs. We are interested in understanding how the performance changes from the perspective of an individual VM when increasing the number of guest systems on the physical host running the same computation intensive workload. We discuss the usefulness of consolidating multiple OLAP tenants onto the same virtual machine in [11] since this discussion is beyond the scope of this paper. Table 2 shows our averaged results across the multiple VM configurations that we have examined. Since each VM is assigned 2 virtual cores we consider a VM to be exposed to a “normal” load when 2 simultaneously active clients are permanently issuing scan queries against the VM. The reported values for average response times and throughput are averages across all client threads of all VMs which are concurrently running the benchmark at a particular point in
Config name 1 VM normal 1 VM high 1 VM overload 2 VMs normal 2 VMs normal + 1 VM burn 2 VMs normal + 2 VMs burn 3 VMs normal 4 VMs normal 4 VMs overload
# VMs 1 1 1 2 2 2 3 4 4
# Users / VM 2 3 4 2 2 2 2 2 4
AVG response time 811 ms 1170 ms 1560 ms 917 ms 909 ms 916 ms 1067 ms 1298 ms 2628 ms
Queries / sec. 2.46 2.57 2.56 4.36 4.4 4.37 5.57 6.16 6.09
Table 2: Response Times and Throughput with Concurrent VMs
2 3
http://pages.sbcglobal.net/redelm/ The selectivities for the SSB queries are taken from [8]
160 % Response Time as a Percentage of Response Time with 1 Active Slot
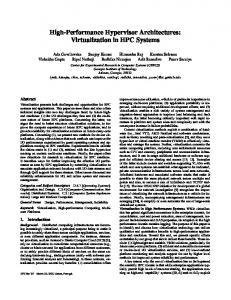
time. When using only 1 out of the 4 available VM slots on the machine the average response time for an OLAP query under normal load conditions is 811 ms. With a load which is slightly more than can be handled by the assigned CPU cores (i.e. 3 client threads) the average response time is 1170 ms and degrades to 1560 ms when the number of clients threads exceeds the number of processor cores by a factor 2 (i.e. 4 client threads). The throughput in terms of queries per second is unaffected by the varying load. Note that we are interested in understanding the impact of concurrently active VMs when a physical system is partitioned into equally sized VMs. Therefore, only 2 cores out of the 8 available ones are used. A virtualized experiment using all available cores has been presented in section 3.4.2. The impact of increasing concurrency in terms of simultaneously active VMs on average response times is also shown in Figure 5. When running the SSB workload concurrently in 2 VMs the average response time is 917 ms across the 4 client threads (2 per VM). In this configuration, 2 out of the 4 available VM slots are unused. An interesting variation of this configuration is to occupy the CPUs in the 2 spare VM slots. To do so, we use a tool burning cycles on all available CPUs 2 . However, this does neither affect the average response time nor the throughput measured across the 2 VM slots running the benchmark. Running the benchmark also in the 3rd and 4th slot at normal load does in contrast negatively impact the average response times (while the throughput increases as expected). Running all 4 slots in parallel at normal load results in an average response time of 1298 ms, which is approximately 60% higher when compared to using only 1 slot at normal load conditions. We examined the 13 different queries in the benchmark in order to estimate how much data is transferred over the memory bus. We combined the average response time per query type with the sizes of the compressed columns of the dimension attributes on which the query has a predicate filter. We then factored in the size in MB of the requested fact table attributes multiplied with the selectivities achieved by the predicate filters3 . We then did a “back of the envelope” calculation indicating that the benchmark requires up two GB per second per active VM with two simultaneous users. All columns were fully compressed, i.e. the delta table was empty (see also [9]). The Intel Xeon E5450 system under investigation has a main-memory bus bandwidth of 8 GB per second. We thus conclude that the above results suggest that the bandwidth of the memory bus is saturated and the CPUs stall on memory read when multiple VMs perform scans across contiguous memory regions at the same time. The Intel Xeon E5450 processor which was used in the
Xeon E5450 150 % Xeon X5650 140 % 130 % 120 % 110 % 100 % 90 % 80 % 1
2
3
4
Concurrently Active VM Slots
Figure 5: Impact of Increasing Concurrency on Response Times previous experiments is connected to a single off-chip memory controller via the system’s front side bus, which has been the prevalent architecture for many years. The Nehalem microarchitecture equips each processor with an integrated memory controller, and thus memory latency and bandwidth scalability are improved [7]. Consequently, we re-ran the experiment using an Intel Xeon X5650 system (Nehalem). Otherwise, the machine was configured exactly the same as the Xeon E5450 model. As depicted in Figure 5, the average response times increase only by up to 6% when all 4 VM slots are concurrently running the benchmark with two simultaneous client threads per VM. Please note that a similar behavior is likely to be observed when running 4 independent TREX processes on a single physical machine or even when running all tables for all tenants within the same TREX process: From the perspective of the memory bus the three alternatives should be similar. The results on the Nehalem platform indicate that when building a data center for multi-tenant analytics using a column store in-memory database it might be more economic to use high-end hardware than commodity machines since more consolidation can be achieved without affecting end-user response times.
4.
RELATED WORK
In the last years main memory DBMS became more and more important, especially column stores [9]. Especially for exploiting modern hardware correct understanding and modeling of such systems is required [5]. Due to the increasing capacity of main memory, larger memory bandwidths and the increasing number of processing units per system, these systems become increasingly important for softwareas-a-service applications. While in traditional server systems the memory bus is saturated with moderate concurrency already, newer systems based e.g. on the Nehalem architecture [7] allow better scaling and makes such systema
even more interesting for virtualization. Even though virtualization always creates an additional overhead [2, 1], main memory databases are less affected since one layer in the storage hierarchy — namely disk I/O — is eliminated. However while profiling in physical systems is assessable, for virtualization another layer of complexity is added and needs to taken care of like shown by Menon et. al [6].
[3]
[4]
5.
CONCLUSION AND OUTLOOK
In this paper we presented three sets of experiments comparing the performance of main memory access in physical and virtual environments. In the first step we used a simple micro-benchmark, in the second step a more complex hybrid main memory database prototype and in the last step we ran the Star Schema Benchmark on a commercial main memory column database. The results of our experiments show that the single access to the different levels of CPU cache and main memory is not slower, but as more data is being read a general performance degradation occurs. From our experiments we see that currently the memory address translation has the biggest impact on performance. The results for the Star Schema Benchmark show that in multi-VM scenarios the available memory bandwidth can be a serious bottleneck. This limits the optimal distribution of available hardware. With the new Intel Nehalem hardware architecture this changes significantly. Due to the vastly increased memory bandwidth the available processing power can be better distributed among virtual machines. Compared to the old architecture where using a 4 VM setup the average response time dropped by 60% using the new Nehalem architecture shows that the performance overhead when using 4 VMs drops to only 6%. With the increasing importance of virtualization optimizations for such systems have to be considered. On the hardware side these are optimizations by the hardware vendors to increase the performance of address translations in virtualized systems like Intel EPT, or to embed special virtual machine instructions into the CPU. On the software side, optimizations for memory access become more and more important. Using special allocators to avoid heap contention with thread-local memory storage are a first possibility. Analyzing the best possible allocation strategies in virtual environments is future work. To summarize, we see that main memory DBMS present a very interesting use case for virtualization. Even though an performance overhead exists it is manageable and has to be compared to the advantages of hardware consolidation and better system balancing for SaaS scenarios.
[5]
[6]
[7]
[8]
[9]
[10]
[11]
[12]
Acknowledgements The authors would like to thank Thomas Willhalm from Intel Corporation for his valuable comments and feedback.
6.
REFERENCES
[1] K. Adams and O. Agesen. A comparison of software and hardware techniques for x86 virtualization. In J. P. Shen and M. Martonosi, editors, ASPLOS, pages 2–13. ACM, 2006. [2] P. Barham, B. Dragovic, K. Fraser, S. Hand, T. L. Harris, A. Ho, R. Neugebauer, I. Pratt, and A. Warfield. Xen and the art of virtualization. In
[13]
[14]
[15]
M. L. Scott and L. L. Peterson, editors, SOSP, pages 164–177. ACM, 2003. D. Jacobs and S. Aulbach. Ruminations on multi-tenant databases. In A. Kemper, H. Sch¨ oning, T. Rose, M. Jarke, T. Seidl, C. Quix, and C. Brochhaus, editors, BTW, volume 103 of LNI, pages 514–521. GI, 2007. B. Jaecksch, W. Lehner, and F. Faerber. A plan for olap. In I. Manolescu, S. Spaccapietra, J. Teubner, M. Kitsuregawa, A. L´eger, F. Naumann, A. Ailamaki, ¨ and F. Ozcan, editors, EDBT, volume 426 of ACM International Conference Proceeding Series, pages 681–686. ACM, 2010. S. Manegold, P. A. Boncz, and M. L. Kersten. Generic database cost models for hierarchical memory systems. In VLDB, pages 191–202. Morgan Kaufmann, 2002. A. Menon, J. R. Santos, Y. Turner, G. J. Janakiraman, and W. Zwaenepoel. Diagnosing performance overheads in the xen virtual machine environment. In M. Hind and J. Vitek, editors, VEE, pages 13–23. ACM, 2005. D. Molka, D. Hackenberg, R. Sch¨ one, and M. S. M¨ uller. Memory performance and cache coherency effects on an intel nehalem multiprocessor system. In PACT, pages 261–270. IEEE Computer Society, 2009. P. E. O’Neil, E. J. O’Neil, X. Chen, and S. Revilak. The star schema benchmark and augmented fact table indexing. In R. O. Nambiar and M. Poess, editors, TPCTC, volume 5895 of Lecture Notes in Computer Science, pages 237–252. Springer, 2009. H. Plattner. A common database approach for oltp and olap using an in-memory column database. In U. Cetintemel, ¸ S. B. Zdonik, D. Kossmann, and N. Tatbul, editors, SIGMOD Conference, pages 1–2. ACM, 2009. J. Schaffner, A. Bog, J. Kr¨ uger, and A. Zeier. A hybrid row-column oltp database architecture for operational reporting. In BIRTE (Informal Proceedings), 2008. J. Schaffner, D. Jacobs, B. Eckart, J. Brunnert, and A. Zeier. Towards enterprise software as a service in the cloud. In Proceedings of the 2nd IEEE Workshop on Information and Software as Services (WISS), 2010. M. Stonebraker, D. J. Abadi, A. Batkin, X. Chen, M. Cherniack, M. Ferreira, E. Lau, A. Lin, S. Madden, E. J. O’Neil, P. E. O’Neil, A. Rasin, N. Tran, and S. B. Zdonik. C-store: A column-oriented dbms. In K. B¨ ohm, C. S. Jensen, L. M. Haas, M. L. Kersten, P.-˚ A. Larson, and B. C. Ooi, editors, VLDB, pages 553–564. ACM, 2005. D. Terpstra, H. Jagode, Y. Haihang, and J. Dongarra. Collecting performance data with papi-c. Proceedings of 3rd Parallel Tools Workshop, Sep 2009. M. Zukowski, S. Heman, N. Nes, and P. Boncz. Super-scalar ram-cpu cache compression. In ICDE ’06, page 59, Washington, DC, USA, 2006. IEEE Computer Society. M. Zukowski, S. H´eman, N. Nes, and P. A. Boncz. Super-scalar ram-cpu cache compression. In L. Liu, A. Reuter, K.-Y. Whang, and J. Zhang, editors, ICDE, page 59. IEEE Computer Society, 2006.