The EU Standards Database: Overview and User Guide Ben Shepherd*, † Groupe d’Économie Mondiale (GEM), Sciences Po, Paris
[email protected] This version dated: 13 February 2006 Abstract: The EU Standards Database collates European standards for agricultural products and textiles/clothing over the period 1995-2003, and maps them to the Harmonised System. For each product-year combination, counts are given both of the number of standards and of the number of pages of standards. In general, rapid growth is observed both in the number and average length of standards. The proportion (roughly 50%) of EU standards implementing ISO standards remains stable over the sample period, suggesting that harmonisation within the Union does not necessarily mean harmonisation with international practice. However, considerable heterogeneity is observed across sectors. Some suggestions for future research are presented, focussing on both the trade impacts of standards and their political economy determinants. Keywords: International trade; product standards; technical regulations; sanitary and phytosanitary measures; European Union. JEL Codes: F13; F14.
*
This database was developed as part of the World Bank’s Africa Trade Standards Project, funded through a USAID Trust Fund. †
The author has greatly benefited from exchanges with Bernard Hoekman, Patrick Messerlin, Johannes Moenius and John Wilson. Sincere thanks to the following for their first-rate research assistance in compiling the database: Jérôme Beaufils, Teresa Bianchi, Françoise Blarez, Anne-Claire Hoyaux, MarkAndré Saucier-Nadeau and Mark Troger. Any errors are of course those of the author alone.
-1-
1
Introduction
The impact of health, safety, environment and technical standards on trade flows has been a question at the centre of the WTO’s agenda since its creation at the end of the Uruguay Round, which saw the adoption of the Agreement on Technical Barriers to Trade (TBT) and the Agreement on Sanitary and Phytosanitary Measures (SPS). While there has been no shortage of high-profile WTO disputes over particular policy measures—EC: Approval and Marketing of Biotech Products is the latest in this line of cases (see WTO, 2006)—they have generally turned on Member States’ respect of the procedural aspects of the relevant agreements rather than on an economic assessment of the extent to which such measures impact international trade. In parallel, however, researchers have been taking important steps towards better understanding the mechanisms at work, and identifying their empirical extent.1 Quantitative analysis has taken a variety of approaches, ranging from global, regional and/or sectoral gravity-type models (Moenius, 2004; Chen & Mattoo, 2004) to micro-analysis of firm-level data on exports or costs (Maskus et al., 2005; Chen et al., 2006). Product specific case studies, both quantitative (Otsuki et al., 2001; Wilson & Otsuki, 2002) and qualitative (Henson & Mitullah, 2004), have also been undertaken. Despite the progress that has been made in recent years, one of the principal difficulties in analysing the trade impact of SPS and TBT measures remains the lack of availability of appropriate and consistent data. Some previous work in this area has relied on the TRAINS database, now part of WITS (see e.g., Fontagné et al., 2001; and more
1
For general reviews see: Maskus et al. (2000); Beghin & Bureau (2001); Josling et al. (2004); WTO (2005); and Ferrantino (2006).
-2-
recently, Essaji, 2005b). TRAINS provides inventories of standards mapped to common product classification schemes, and can be used to produce count or frequency measures of standardisation. However, its coverage is quite patchy both in geographical and chronological terms. To take the EU as an example, TRAINS only has data on nontariff barriers (including standards) for the year 1999, meaning that it is not possible to perform multi-period comparisons or take advantage of panel data econometric techniques. Moreover, TRAINS does not allow the analyst to distinguish between standards that are consistent with international norms (such as ISO) and those that are “idiosyncratic” (i.e., purely national, in the sense of not being consistent with relevant international standards); a priori, it could be expected that the impacts of these two types of norms would be quite different in terms of product or process adaptation costs, and therefore also in terms of trade flows. Finally, there have been suggestions in the literature to the effect that TRAINS provides only incomplete coverage of relevant standards (see e.g., WTO, 2005). A number of papers have used alternative sources. One option is to abandon the inventory approach of TRAINS and to rely on completely different data, such as firm surveys (Maskus et al., 2005; Chen et al., 2006) or estimated price gaps (see Ferrantino, 2006 for a review). For product-specific studies, a less radical alternative is to collect data from national and international regulatory agencies on a very small number of directly relevant standards (Otsuki et al., 2001; Wilson & Otsuki, 2002). In the intraEuropean context, use has been made of data produced by the Commission in analysing the impact of harmonisation and mutual recognition practices (Brenton et al., 2001; Vancauteren, 2002; Vancauteren & Henry de Frahan, 2004). A final strand of the literature has attempted to take a multi-product, multi-country approach using databases
-3-
established by national and international standardisation bodies, such as Perinorm International. The BISTAN database of Moenius (2000, 2004) is one example of such an approach, in which the author uses Perinorm to construct inventories of national and “shared” standards covering 471 SITC industries and 18 countries or regions, over the period 1965-1998. All of these methods have their respective advantages and disadvantages. In part, the net balance of course depends on the precise ends to which the data will be used. The EU Standards Database (EUSDB) described in the present paper is conceived as a relatively general (i.e., multi-product) dataset that seeks to build on previous work—in particular Moenius (2000, 2004). While limited to just one standard-making entity, the European Union, EUSDB applies a single, consistent methodology over the period 1995-2003 to produce inventories of the stock of Community-level standards in each year, mapped to the 4-digit Harmonised System (HS) product classification. The multi-year structure of EUSDB makes it possible to include it in a panel data econometric framework, potentially an important advantage. Cross-checking between the Perinorm and CENorm databases helps to enhance data reliability and completeness. A systematic distinction is drawn between implementations of international (ISO) standards and uniquely European rules, thereby facilitating comparisons of the potentially different economic impacts in these two cases. Given its multi-product nature, EUSDB cannot directly capture the relative restrictiveness of different standards, since that would literally require comparing apples with oranges. However, in capturing information on the number of pages in each standard, EUSDB attempts to give some additional detail on the relative technical complexity of different standards. Finally, the dataset focuses on an export market (the EU) and products (agriculture and textiles/clothing) of special
-4-
interest to many developing countries, for which the trade impact of standardisation is a particularly important question. Against this background, the next Section discusses the data collection methodology used to create EUSDB. Section 3 provides a general overview of the dataset from an end-user’s perspective, while Section 4 presents some initial descriptive results. Section 5 concludes.
2
Data Collection Methodology
EUSDB is built up from information contained in two primary databases: CE-Norm and Perinorm International. The former is a publicly available (www.cenorm.be), searchable database of European standards, maintained by the European Committee for Standardisation (CEN). Perinorm, on the other hand, is a large (1.1 million records) subscription-only database of standards covering 22 countries, in addition to international bodies such as ISO and CEN. This section describes the information captured from those sources and the methodology employed, as well as the various difficulties encountered that require prudence when using EUSDB and interpreting results obtained with it. 2.1
Geographical and Temporal Coverage
In temporal terms, EUSDB’s coverage (1995-2003) is situated between the two extremes of TRAINS, which has only one year’s worth of standards data for the EU, and the BISTAN database of Moenius (2000, 2004), which covers over 30 years. The 1995-2003 period was chosen to coincide with that for which SPS and TBT notifications are available from the WTO, thereby providing an interesting point of comparison for the notification practices of the EU and its Member States.
-5-
As is the case for TRAINS, EUSDB focuses on European product standards at the Community level. (For an overview of standardisation procedures in Europe, see: Delaney & Van de Zande, 2000; Brenton et al., 2001.) At this stage, it does not include data on national standards from individual Member States. There are three main reasons for this. Firstly, a considerable number of such standards in fact constitute implementations of Community-level standards; although, as Vancauteren (2002) and Vancauteren & Henry de Frahan (2004), point out, divergences amongst national standards within Europe remain a question of considerable concern, and are deserving of further research in their own right. Secondly, data availability varies considerably across EU Member States both in terms of years and substance, making it very difficult to obtain a comprehensive dataset covering the full range of Community-level and national standards. Thirdly, Community-level standards are a comparatively recent phenomenon compared with national standardisation, thereby making it much more feasible to obtain accurate stock data for the former than for the latter. While Perinorm contains a very small number of national regulations from as far back as the 19th century—some of which could still be in force—its coverage must be regarded as extremely patchy in this regard (Moenius, 2000). Concretely, EUSDB was constructed by searching both the CE-Norm and Perinorm databases for Community-level (“EN”) standards, and extracting the relevant information from individual records, then cross-checking. Particular care was taken to ensure that the standard count for each year reflects as accurately as possible the total number of standards in force for that year (referred to as the “stock” of standards), regardless of whether individual standards were published prior to or during the EUSDB sample period (1995-2003). (This is discussed in more detail below.)
-6-
2.2
Standard Coverage and International vs. “Idiosyncratic” Standards
As is well known, product-related standards come in numerous different varieties. Perinorm, for instance, recognises 29 overlapping characterisations of standard-type documents (Moenius, 2000). In constructing EUSDB, the following conventions were adopted, in line with the approach in Moenius (2000). Only those documents classified as “standards” in Perinorm are included in count data. An amendment to an existing standard is counted as an additional standard. All draft standards are excluded from the dataset. Some previous studies have differentiated between harmonised (or shared) standards and “idiosyncratic” standards that are unique to a particular country (e.g., Moenius, 2000 & 2004). Since EUSDB deals only with Community-level standards, it does not investigate differences in national standards within the EU. However, it does capture information on whether or not a particular EU standard implements a corresponding ISO standard. A binary dummy variable is use to make this distinction, which is based on the presence or absence of an “equivalent” or “identical” tag in the Perinorm record with reference to an ISO standard. In this context, EU standards are considered to be “idiosyncratic” whenever they are not equivalent or identical to an ISO standard. 2.3
Mapping Standard Classifications to Product Classifications
Given its aim to focus on products of particular interest to developing countries, EUSDB covers only the agriculture and textiles/clothing sectors. These are defined in HS-2002 terms as covering Chapters 1-24 and 50-67. One of the most difficult problems in this area is assigning standards to products in a systematic way. As noted by Moenius (2000), the classification schemes used for
-7-
standards (International Classification for Standards) and goods (HS, SITC, etc.) are based on fundamentally different approaches. The ICS system (IOS, 2001) tends to classify standards according to “fields of activity”, often covering a multitude of product groups in HS terms. For example, ICS heading 67 covers standards relating to food technology, which includes not only standards related to specific types of food but also standards for equipment used in the food industry. The divergent approaches taken by ICS and HS make it extremely difficult to automatically map standards from an ICSbased database like Perinorm or CE-Norm to HS products. It is noteworthy that whereas concordances are easily available for different product classifications, there is currently no concordance mapping from ICS to any product or industry classification system.2 EUSDB deals with this problem in the following way. The verbal description of each individual standard extracted from Perinorm or CE-Norm is used to map each standard to all corresponding HS 4-digit product codes; where the product description is judged too vague to be reasonably confident as to its HS equivalents, the corresponding standard is dropped from the database. This essentially manual approach has the disadvantages of being labour-intensive and leaving considerable room for the exercise of the analyst’s judgment. However, it has the important advantage of using all available information, not just the ICS classification. It is therefore expected to result in a more accurate mapping of standards to products. It is important to note that the verbal description of each standard in Perinorm or CE-Norm generally provides a much finer level of product detail than is apparent from the corresponding ICS identifier.
2
Moenius (2000, Appendix C.2) provides a partial concordance from ICS to SITC 2-digit. However, individual ICS codes generally map to a large number of SITC codes, suggesting that the benefits of this approach—transparency and automation—might be partly offset by costs in the form of lost product-level detail.
-8-
Moreover, the title of the document can sometimes suggest that the nature of the standard (e.g., “vocabulary” or “terminology”) is purely formal, in which case it is dropped from the dataset. 2.4
Stock vs. Flow Inventories
One of the principal aims of EUSDB is to provide an inventory of the “stock” of active standards for a given product-year combination, as distinguished from the net “flow” that results from new standards being published and old ones being withdrawn over a given year. In other words, the primary variable of interest is the total number of standards with which an exporter’s products should comply during a particular year. This is an additional complicating factor in terms of data collection, since the raw data sources are constructed largely in terms of flows (i.e., they focus on currently active standards, and catalogue both active and disused standards by publication date and withdrawal date). Perinorm is of particular use in this regard, since it references both current and withdrawn standards, although multiple searches are required over the full time period for which data are available in order to have the best chance of capturing all historical standards still in force, as well as standards introduced during the EUSDB sample period. The EUSDB summary data file (see further below) contains stock data for each year in the period 1995-2003, according to the following conventions. A standard is considered to be in force for a given year if it was published before or during the year in question, and (if applicable) if it was withdrawn after that same year. Correspondingly, a standard
-9-
is considered not to be in force for a given year if it is withdrawn at any point during that year.3 2.5
Simple Inventories, Relative Restrictiveness and Technical Complexity
The ideal cross-country, multi-product database on standards would find some way not just of tallying individual standards—and implicitly assuming that one standard is just as restrictive and/or costly to satisfy as any other—but also of taking into account their relative restrictiveness in the way that has been done in some single product case studies (Otsuki et al., 2001; Wilson & Otsuki, 2002). However, there are obvious and formidable difficulties standing in the way of such a direct comparison. How can the analyst know a priori whether trade in apples is more or less affected by standard A than is trade in oranges by standard B? EUSDB does not claim to provide a solution to this problem, but rather makes an attempt to look at it from a different angle. What matters to exporters—in particular in developing countries—is not only the objective restrictiveness of the standard, but also its technical or informational complexity, since that will be a relevant factor in determining compliance cost. As a first attempt at analysing this issue, it seems defensible to use the number of pages in a standard as a proxy—albeit a highly imperfect one—for its complexity.4 That is the approach taken in EUSDB, where the
3 There is obviously an element of judgment involved in the use of such conventions. End-users can, if they wish, modify them by building their own summary data tables directly from the EUSDB raw data file (see further below). 4
There do not appear to be any instances in the literature of this approach having been taken. Moenius (2004, p. 14) draws a similar link between the number of pages in a standard and what he terms its “informational content”, but his dataset does not include page counts. Beghin & Bureau (2001) are sceptical as to whether page counts can really capture trade restrictiveness, but do not deal expressly with the possible impacts on exporters in terms of information costs.
- 10 -
number of pages recorded for each standard is based on the original source language (as indicated by Perinorm) whenever multiple translations are available.
3
Overview of the Dataset
EUSDB is contained in two Excel files: eusdb feb2006.xls (“the summary data file”) and eusdb raw feb2006.xls (“the raw data file”). As their names suggest, the second file contains detailed data on individual standards collected using the methodology outlined in the previous Section, while the first one presents count data based on different aggregations of the raw information. The data contained in each file will now be briefly discussed in turn, with further details available in Tables 1 and 2 3.1
Summary Data File
Count data for standards and numbers of pages are presented at two levels of detail, namely the HS-2002 2-digit (chapter) and 4-digit (heading) levels. For each of the two levels, a separate spreadsheet page is used to present tallies of the number of relevant standards for each product, along with the total number of pages accounted for by those standards. Both counts are by year, over the period 1995-2003. Three different count series are provided for each product-year combination: All (counting all EU standards), ISO (counting only those EU standards that implement corresponding ISO standards) and Non-ISO (counting only those EU standards that do not implement corresponding ISO standards). Since EUSDB is constructed at the HS 4-digit level, it is necessary to apply an aggregation procedure in order to produce inventories at the 2-digit level. The convention adopted in creating the summary data file treats a standard as applying to a given HS 2-digit chapter if it applies to at least one HS 4-digit product within that
- 11 -
chapter. End-users are not, however, tied to this convention. Using the EUSDB raw data file, they can create their own summary data tables, using aggregation schemes that apply whatever weightings are most appropriate for their purposes. 3.2
Raw Data File
For applied work estimating the impact of standards on bilateral trade flows or other similar variables, the summary data file will most likely provide the main information required by researchers. The raw data used to create the summary data file is made available primarily for two classes of end-users: researchers interested in applying their particular aggregation schemes to produce individual summary data tables; and researchers (or exporters) interested in accessing information on individual product standards, for example as an input into qualitative or quantitative case-study approaches. The raw data file is therefore structured as a single spreadsheet page, with individual standards stacked vertically. The information captured for each standard includes its unique identifier from the CE-Norm system—which in turn enables users to access the full text through CE-Norm or national agencies—its date of entry into force, its withdrawal date (if any), the number of pages it contains, whether or not it implements an ISO standard and finally a list of the 4-digit HS product codes to which it applies.
4
Descriptive Statistics
This Section provides a first look at the contents of EUSDB. The analysis is kept fairly general—focussing on the global and HS-2 digit levels—and is necessarily impressionistic. In particular, it should be borne in mind that EUSDB deals only with agricultural products and textile/clothing. Although these are important sectors for many
- 12 -
developing countries, there is evidence to the effect that they are by no means the sectors with the largest stocks of product standards in the developed world (WTO, 2005). The discussion in this Section is therefore meant primarily to give an indication of EUSDB’s scope and structure, and to highlight some suggestive areas for further research. 4.1
Analysis at the Global Level
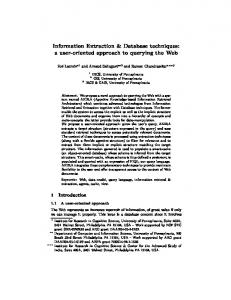
Table 3 and Figure 1 show the overall growth in the stock of Community-level standards as captured in EUSDB. Growth in the corresponding page count is shown in Table 4 and Figure 2. Table 5 combines the information in the preceding two Tables to show the evolution in the average length (in pages) of EU standards over the sample period. In each of these Tables and Figures, a distinction is drawn between international (ISO-consistent) standards and idiosyncratic EU standards, in the sense discussed above. The following stylised facts can be seen to emerge: i.
Community-level standards have undergone consistent and rapid growth over the period 1995-2003. The total stock of active standards has increased by over 300% in that time, at an average annualised growth rate of nearly 20%.
ii.
The stock of ISO-based standards has grown at approximately the same rate as the stock of idiosyncratic EU standards. Although there appeared to be a slight tendency mid-sample towards increasing international harmonisation of EU standards, the 2001-2003 period saw it largely undone. The balance between ISO and idiosyncratic standards was therefore largely unchanged at
- 13 -
the end of the sample (51/49% compared with 48/52%). In other words, the data do not provide any strong indication that harmonisation within the EU—through the adoption of Community-level standards—necessarily equates to harmonisation with international practice. iii.
The average length of EU standards has increased markedly over the sample period, by around 40% on an aggregate basis. Interestingly, idiosyncratic EU standards tended to be considerably longer than ISO standards at the beginning of the sample period, but by the end the two were of approximately equal average length.
4.2
Analysis at the HS-2 Digit Level
The global analysis just presented in fact masks considerable heterogeneity across product groups. Figures 3-5 provide a graphical representation of the HS 2-digit level standard counts presented in the EUSDB summary data file, without for the moment distinguishing between ISO-consistent and idiosyncratic standards. The following stylised facts emerge from those Figures: iv.
Different product groups are subject to very different patterns of standardisation, both in terms of the number of standards and the growth rate over the sample period.
v.
In general, textiles and clothing (HS 50-67) tend to be subject to a larger number of standards than do agricultural products (HS 01-24). Part of this effect is due to the fact that standards relating to textiles/clothing tend to be broad-based, applying to a large number of HS 2-digit product lines.
- 14 -
However, it is important to note that the stock of standards relating to agricultural products has undergone very rapid growth from a low base. vi.
In agriculture, a small number of product groups stand out for the relatively strong concentration of standards observed: dairy goods, starches, oils, fruits and vegetables. In each case, more than 50 different standards were in force at the end of the sample period.
vii.
While the pattern of standardisation is more consistent across the textile/clothing sector, it is nonetheless noteworthy that HS Chapters 56 (non-wovens) and 59 (coated fabrics) appear to have a higher concentration of standards than do other product groups: over 150 and 200 standards respectively were in force in 2003. By contrast, the concentration is noticeably lower for HS Chapters 60-67 (clothing and related articles, as opposed to textiles).
Finally, it is also of interest to examine the pattern of international versus idiosyncratic standardisation across different product groups. Figures 6-7 present a breakdown of standards for each HS 2-digit product into ISO and non-ISO standards, comparing the situation in 1995 with that in 2003. The following stylised facts can be extracted from those Figures: viii.
EU standardisation in textiles and clothing tends to be more closely aligned on ISO standards than does standardisation in agriculture. For most product groups, the latter sector is notable for its strong proportion of idiosyncratic standards.
- 15 -
ix.
The pattern referred to in the previous stylised fact appears to be persistent over time. In other words, increases in the stock of agriculture standards continue to be relatively biased towards idiosyncratic standards.
4.3
Possible Directions for Future Research
The stylised facts noted above are suggestive of a number of lines of inquiry using EUSDB and similar information sources. These can be grouped around two main themes: on the one hand, the external impacts of EU standardisation; and on the other, its internal political economy determinants. There is already a considerable empirical literature that assesses the extra-territorial economic impacts of standardisation (see Section 1 for a selection of general references). But there are a number of ways in which it can be extended and deepened. These are presented in the form of research questions in the following paragraphs. Firstly, to what extent are exporters affected by the rate and frequency of changes in standards (as opposed to their number)? A useful analogy could perhaps be made with the option pricing approach to firm entry and exit decisions (Dixit, 1989), with regulatory changes interpreted as introducing an element of dynamic uncertainty into firms’ fixed and/or marginal costs. Empirically, the impressive rate of growth of EU standards—and correspondingly frequent changes in the substantive requirements faced by exporters—is a feature at least of worthy as study as their sheer number. Secondly, does the technical and informational complexity of standards—as distinguished from their substantive restrictiveness—significantly affect exporters’ costs, and through them trade flows? This question does not appear to have been addressed in the empirical literature, and could be a useful way of abstracting from the
- 16 -
“apples and oranges” restrictiveness problem in the context of multi-country and multiproduct studies. And thirdly, do divergences from international (ISO) practice significantly affect exporters’ cost structures and, in turn, trade flows? Moenius (2004) has provided some partial evidence in response to that question, though focussing on bilaterally-shared standards rather than strictly international ones. There is thus considerable room for new research going in that direction, both at the level of trade flows and firm behaviour. Finally, Essaji (2005a) is a recent study that incorporates standards into the endogenous trade policy literature. The descriptive results in Section 4 of the present paper suggest that there is considerable heterogeneity at the sectoral and product level, both in terms of the number and nature of standards (ISO or idiosyncratic). While that could have many possible causes on a substantive level, there is clearly a potential role for political economy considerations. The determinants of standardisation behaviour could therefore be worthy of study in their own right.
5
Conclusion
This paper has briefly presented EUSDB, a new dataset of EU standards affecting products in the agriculture and textile/clothing sectors, which are of particular export interest to many developing countries. EUSDB is viewed as a complement to existing resources such as TRAINS, and offers the advantages of more detailed coverage of EU standards—drawing on primary material from the Perinorm International and CE-Norm databases—and consistent information for a number of years (1995-2003), as well as the ability to distinguish between ISO-consistent and “idiosyncratic” standards.
- 17 -
The preliminary descriptive results presented in Section 4 suggest a number of interesting avenues for future research. Firstly, the impacts of standards on variables such as trade flows, costs, margins or export propensity are far from fully understood, even though considerable advances have been made in recent years. EUSDB can be expected to feed into the various approaches used to investigate those questions. Secondly, the heterogeneity in standardisation that emerges from EUSDB could be an interesting subject of analysis from a political economy point of view. This is likely to be a particularly fruitful avenue for future research, since it is only relatively recently that the literature has begun to look at the role of standards in models of endogenous trade policy.
- 18 -
References Beghin, John C. & Jean-Christophe Bureau. 2001. “Quantitative Policy Analysis of Sanitary, Phytosanitary and Technical Barriers to Trade,” Économie Internationale, 87, pp. 107-131. Brenton, Paul; John Sheehy & Mark Vancauteren. 2001. “Technical Barriers to Trade in the European Union: Importance for Accession Countries,” Journal of Common Market Studies, 39(2), pp. 265-284. Chen, Maggie X. & Aaditya Mattoo. 2004. “Regionalism in Standards: Good or Bad for Trade?,” Policy Research Working Paper 3458, Washington DC: World Bank. Chen, Maggie X.; Tsunehiro Otsuki & John S. Wilson. 2006. “Do Standards Matter for Export Success?,” Policy Research Working Paper 3809, Washington DC: World Bank. Delaney, Helen, & Rene Van de Zande. 2000. “A Guide to EU Standards and Conformity Assessments,” Special Publication 951, Gaithersburg MD: National Institute of Standards and Technology, http://ts.nist.gov/ts/htdocs/210/gsig/euguides/sp951/sp951.htm. Dixit, Avinash. 1989. “Entry and Exit Decisions Under Uncertainty,” The Journal of Political Economy, 97(3), pp. 620-638. Essaji, Azim. 2005a. “The Political Economy of Technical Regulations,” Mimeo, 20 May 2005, http://www.wlu.ca/documents/6388/pol_econ_tr.pdf. Essaji, Azim. 2005b. “Technical Regulations and Specialisation in International Trade,” Mimeo, 13 July 2005, http://www.wlu.ca/documents/8525/tech_reg_spec2.pdf. Ferrantino, Michael. 2006. “Quantifying the Trade and Economic Effects of Non-Tariff Measures,” OECD Trade Policy Working Papers, No. 28, Paris: OECD. Fontagné, Lionel; Friedrich von Kirchbach & Mondher Mimouni. 2001. “A First Assessment of Environment-Related Trade Barriers,” Working Paper 2001-10, Paris: CEPII. Henson, Spencer & Winnie Matullah. 2004. “Kenyan Exports of Nile Perch: The Impact of Food Safety Standards on an Export Oriented Supply Chain,” Policy Research Working Paper 3349, Washington DC: World Bank. International Organisation for Standardisation. 2001. International Classification for Standards, 5thEdition. Geneva: IOS. Josling, Timothy; David Orden & Donna Roberts. 2004. Food Regulation and Trade: Toward a Safe and Open Global System. Washington DC: Institute for International Economics. Maskus, Keith E.; John S. Wilson & Tsunehiro Otsuki. 2000. “Quantifying the Impact of Technical Barriers to Trade,” Policy Research Working Paper 2512, Washington DC: World Bank. Maskus, Keith E.; Tsunehiro Otsuki & John S. Wilson. 2005. “The Cost of Compliance with Product Standards for Firms in Developing Countries: An Econometric Study,” Policy Research Working Paper 3590, Washington DC: World Bank.
- 19 -
Moenius, Johannes. 2000. “The BISTAN Data Retrieval Reference,” Mimeo, 14 May 2000, University of California at San Diego. Moenius, Johannes. 2004. “Information Versus Product Adaptation: The Role of Standards in International Trade,” Mimeo, February 2004, Kellogg School of Management at Northwestern University. Otsuki, Tsunehiro; John S. Wilson & Mirvat Sewadeh. 2001. “A Race to the Top? A Case Study of Food Safety Standards and African Exports,” Policy Research Working Paper 2563, Washington DC: World Bank. Vancauteren, Mark. 2002. “The Impact of Technical Barriers to Trade on Home Bias: An Application to EU Data,” IRES Discussion Paper, 2002-032, Louvain: Université Catholique de Louvain. Vancauteren, Mark & Bruno Henry de Frahan. 2004. “Harmonisation of Food Regulations and Trade in the Single Market: Evidence from Disaggregated Data,” IRES Discussion Paper, 2004-021, Louvain: Université Catholique de Louvain. Wilson, John S. & Tsunehiro Otsuki. 2002. “To Spray or Not to Spray? Pesticides, Banana Exports and Food Safety,” Policy Research Working Paper 2805, Washington DC: World Bank. WTO. 2005. World Trade Report 2005: Exploring the Links Between Trade, Standards and the WTO. Geneva: WTO. WTO. 2006. “EC – Approval and Marketing of Biotech Products,” Interim Ruling of the Panel, Document No. WT/DS291/Interim, extracts available from http://www.tradeobservatory.org/library.cfm?refid=78475.
- 20 -
Tables Table 1: Structure of the EUSDB summary data file. (Sources: EUSDB, Perinorm International and CE-Norm.)
Field
Description
HS
HS product code at the 2- or 4-digit level
Description
Verbal description of the corresponding HS product code
All_xxxx
Total number of EU standards active for a given HS product in year xxxx Equal to ISO_xxxx + NonISO_xxxx
ISO_xxxx
Total number of EU standards active for a given HS product in year xxxx, and which are “equivalent to” or “identical to” an ISO standard
Total number of EU standards active for a given HS product in year NonISO_xxxx xxxx, and which are neither “equivalent to” nor “identical to” an ISO standard Table 2: Structure of the EUSDB raw data file. (Source: EUSDB, Perinorm International and CENorm.)
Field
Description
ISO
Dummy variable set to 1 if a standard is “equivalent to” or “identical to” an ISO standard, else zero
Wdate
Date on which a standard is withdrawn (if any)
Effdate
Date on which a standard becomes effective
Number
Unique Perinorm and/or CE-Norm identifier for each standard
Pages
Number of pages in a given standard
HSx
Sequential list of 4-digit HS product codes affected by a given standard
- 21 -
Table 3: Total number of EU standards based on an aggregate count, 1995-2003. (Source: EUSDB.)
Year 1995 1996 1997 1998 1999 2000 2001 2002 2003 % change 1995-2003
ISO-Consistent Idiosyncratic Total 78 84 162 102 113 215 140 142 282 172 171 343 222 190 412 258 228 486 295 263 558 313 280 593 342 332 674 338.5
295.2
316.0
Table 4: Total number of EU standards based on an aggregate page count, 1995-2003. (Source: EUSDB.)
Year 1995 1996 1997 1998 1999 2000 2001 2002 2003 % change 1995-2003
ISO-Consistent Idiosyncratic Total 477 619 1096 616 818 1434 863 1012 1875 1140 1263 2403 1705 1365 3070 2143 1966 4109 2541 2419 4960 2788 2554 5342 3258 3147 6405 583.0
408.4
484.4
Table 5: Average length in pages of EU standards based on aggregate counts, 1995-2003. (Source: EUSDB.)
Year 1995 1996 1997 1998 1999 2000 2001 2002 2003 % change 1995-2003
ISO-Consistent Idiosyncratic Total 6.12 7.37 6.77 6.04 7.24 6.67 6.16 7.13 6.65 6.63 7.39 7.01 7.68 7.18 7.45 8.31 8.62 8.45 8.61 9.20 8.89 8.91 9.12 9.01 9.53 9.48 9.50 55.8
28.6
- 22 -
40.5
Figures Figure 1: Breakdown of EU standards based on an aggregate count, 1995-2003. (Source: EUSDB.) Total No. of EU Standards (HS 1-24 & 50-67), 1995-2003 800
700
600
Count
500
Non-ISO ISO
400
300
200
100
0 1995
1996
1997
1998
1999
2000
Year
- 23 -
2001
2002
2003
Figure 2: Breakdown of EU standards based on an aggregate page count, 1995-2003. (Source: EUSDB.)
Total Page Count of EU Standards (HS 1-24 & 50-67), 1995-2003 7000
6000
5000
Pages
4000 Non-ISO ISO 3000
2000
1000
0 1995
1996
1997
1998
1999 Year
- 24 -
2000
2001
2002
2003
Figure 3: Breakdown of EU standards based on a HS 01-11 2-digit count, 1995-2003. (Source: EUSDB.)
Total No. of EU Standards (HS 2-digit level), 1995-2003 250
200
All_1995 All_1996 All_1997 All_1998 All_1999 All_2000 All_2001 All_2002 All_2003
Count
150
100
50
0 01
02
03
04
05
06
07
HS Chapter
- 25 -
08
09
10
11
12
Figure 4: Breakdown of EU standards based on a HS 12-24 2-digit count, 1995-2003. (Source: EUSDB.)
Total No. of EU Standards (HS 2-digit level), 1995-2003 250
200
All_1995 All_1996 All_1997 All_1998 All_1999 All_2000 All_2001 All_2002 All_2003
Count
150
100
50
0 13
14
15
16
17
18
19
HS Chapter
- 26 -
20
21
22
23
24
Figure 5: Breakdown of EU standards based on a HS 50-67 2-digit count, 1995-2003. (Source: EUSDB.)
Total No. of EU Standards (HS 2-digit level), 1995-2003 250
200
All_1995 All_1996 All_1997 All_1998 All_1999 All_2000 All_2001 All_2002 All_2003
Count
150
100
50
0 50
51
52
53
54
55
56
57
58
59
HS Chapter
- 27 -
60
61
62
63
64
65
66
67
Figure 6: Breakdown of EU standards based on a HS 01-24 & 50-67 2-digit count, 1996. (Source: EUSDB.)
Total No. of EU Standards (HS 2-digit level), 1996 250
200
Count
150 NonISO_1996 ISO_1996 100
50
HS Chapter
- 28 -
66
64
62
60
58
56
54
52
50
23
21
19
17
15
13
11
09
07
05
03
01
0
Figure 7: Breakdown of EU standards based on a HS 01-24 & 50-67 2-digit count, 2003. (Source: EUSDB.)
Total No. of EU Standards (HS 2-digit level), 2003 250
200
Count
150 NonISO_2003 ISO_2003 100
50
HS Chapter
- 29 -
66
64
62
60
58
56
54
52
50
23
21
19
17
15
13
11
09
07
05
03
01
0