32 ND I NTERNATIONAL C OSMIC R AY C ONFERENCE , B EIJING 2011
The experimental constraints on the models of cosmic rays origin inferred from the ATIC data and some other recent experiments V.I. Z ATSEPIN1 , A.D. PANOV1 , N.V. S OKOLSKAYA1 Skobeltsyn Institute of Nuclear Physics, Moscow State University, Moscow, Russia
1
[email protected] Abstract: The newly observed features of cosmic ray spectra as measured by the modern spectrometers in ATIC, CREAM, PAMELA and FERMI/LAT experiments, namely: the different spectral shapes of protons and helium nuclei; the hardening of the spectra at rigidities ∼ 250 GV; the steepening in the proton spectrum at rigidity above 10-20 TV – could not be explained within standard diffusive shock acceleration (DSA) models. Constraints on the models of cosmic rays origin inferred from these features and possible explanations are discussed. Constraints on explanation of the cosmic ray electron spectrum excess by dark matter inferred from the recently observed by ATIC fine structure are also mentioned. Keywords: ATIC, cloudy medium, nearby sources, supernovae, pulsars, fine structure, nuclei spectra, dark matter, electron spectrum
1 Introduction The standard model of the Galactic cosmic rays (GCR) origin considers the acceleration of charged particles on the shocks of supernova explosions into the homogeneous interstellar medium to be the main source of GCR [1, 2]. It was also shown that the magnetic field can be amplified non-linearly by the cosmic rays to many times over the preshock value, thus increasing the acceleration rate and facilitating acceleration to energies well above 1015 eV [3, 4]. Such models predict the source spectra of all GCR components to be single power-law on rigidity with universal spectral index close to 2.0 up to the knee region. The observed spectra should be somewhat steeper (index ∼ 2.6) due to the propagation. However, a number of new features in the cosmic ray spectra below energy ∼100 TeV discovered in the data of the modern direct experiments ATIC, CREAM, PAMELA, FERMI/LAT could not be understood within such a model. We consider here these features, the constraints on the models of cosmic rays origin inferred from them, and mention possible models to explain these features.
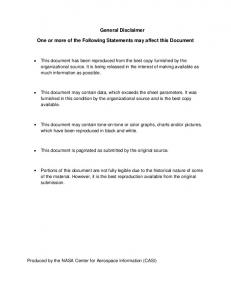
2 Different slopes of proton and helium spectra below 10 TV The difference in the slopes of the proton and helium spectra ∆γ ≈ 0.1 in the energy range 30 GeV/n – 10 TeV/n was established with high statistical accuracy in the ATIC2 experiment in 2004 [5] (see also [6, 7, 8])1 . At a
later time the difference of the proton and helium spectra slopes was confirmed in CREAM-III (400 GeV/n – 10 TeV/n) [10], CREAM-I (800 GeV/n – 10 TeV/n) [11] and PAMELA with the spectra measured by the calorimeter [12] (80 GeV/n – 4 TeV/n) and by the magnetic spectrometer [13] (rigidity of 10 – 1000 GV). The observed difference of the slopes excludes models with the same elemental composition and the same index of the source spectrum for all sources. There are two main possibilities to explain the observed data. The first one is different sources with different elemental composition that produce also different rigidity spectra. The second explanation (and more preferable in our opinion) is the sources, which have formed a heterogeneous environment. It was shown [14] that the maximal energy of particles may be achieved at the beginning of the Sedov-Taylor stage of the acceleration. The density of the stellar wind (consisting mainly of helium) for such supergiant stars as Wolf-Rayet stars is maximal near the star before the supernova explosion and becomes lower as the distance from the star becomes larger. Therefore the intensity of the helium nuclei relative to the hydrogen is maximal at the early stages of the acceleration when the energies are the highest. This means that the helium spectrum should be harder than the proton one. 1. Although in [9] it was reported that in the ATIC-1 experiment the measured spectra of protons and helium had the same slopes, more recently it was proved that the operation of the apparatus during the ATIC-1 flight was incorrect.
14
Flux × R 2.6, m−2s−1ster −1GV 1.6
V.I. Z ATSEPIN et al. T HE EXPERIMENTAL CONSTRAINTS FROM ATIC
ATIC PAMELA CREAM−III (preliminary)
Protons 104
He
103
10
102
3
10
104
5
10
R, GV
Figure 1: Proton and helium spectra of ATIC [8], PAMELA [13], and CREAM [10].
3 Steepening of the proton spectrum above 10 TeV The steepening of the proton spectrum above 10 TeV was observed in 1990-th in the emulsion experiments MUBEE [15] and JACEE [16], but the statistical significance of the data were not high enough, therefore the result was not considered seriously for a long time. In 2004 the ATIC2 experiment had confirmed the result [5, 6] but also with low statistics. Finally, the result has been confirmed again but with higher statistics in CREAM-III [10]. The data of CREAM-I [11] does not contradict the result of CREAMIII but statistics are worse in CREAM-I. It is seen in Fig. 2 that while the statistics are not high above 10 TeV up to now, the steepening of the proton spectrum is reasonably prominent and firm. The majority of contemporary models of acceleration of GCR try to solve the problem of acceleration of particles up to the energies near the knee region 3 × 10⁶ GeV and higher [3, 4, 18]. Such models do not explain steepening of the proton spectrum above 10 TeV, and should be rejected as candidates to explain the bulk of cosmic rays below 50–100 TeV. Some models [18, 19] introduce a division of the whole population of accelerated particles into two sub-populations. The first one describes the high-energy escape particles, the second one corresponds to the particles captured within the supernova remnant and undergoing the adiabatic cooling during the expanding of the remnant. These sub-populations have different spectra with different cut energies, and this difference could produce a dip or steepening in the joint spectrum as it was argued in [19]. However, typically these dip has too low amplitude, and located at too high energies. Therefore the explanation of 10 TeV steepening by two sub-populations is questionable now. It looks more reasonable that the steepening in the proton spectrum above 10 TeV means the energy cutoff for the sources of a special class which are responsible for the bulk of the observed cosmic rays below energies 50–
100 TeV. Such sources may be core-collapsed supernovae exploding in the dense clouds. This idea supported by recent observation of the supernova remnants W44 [20] and RX J1713.7-3946 [21, 22]. Their high-energy gammaspectra are steeper than it is expected from the DSA models. This low-energy steepening is explained in [23] by expanding of shock into the weakly ionized dense gas. It was demonstrated in that paper that strong ion-neutral collisions in the remnant surrounding lead to the steepening of the energy spectrum of accelerated particles by exactly one power. The steepening of the observed spectrum of protons will be less than one, of course, due to a mixing of different sources at least. A strong evidence of the important role of core-collapsed supernovae exploding in dense high-metallicity clouds in superbubbles or OB-associations is the isotopic anomalies in cosmic rays for 22 Ne/20 Ne [24] and for 59 Co/59 Ni [25]. The cosmic ray source ratio 22 Ne/20 Ne is about five times the solar wind ratio, and just this value may be attributed to the Wolf-Rayet stellar wind. To obtain low observed abundance of 59 Ni in cosmic rays one should suppose a long period of time (about 105 years) between the nuclear synthesis of 59 Ni and acceleration of them. The nuclei of 59 Ni must be presented in the form of neutral atoms or low-ionized ions during this time to permit the electron K-capture 59 Ni→59 Co. Therefore the substance of some previous supernova explosion is accelerated by subsequent explosions. The conditions for this exist in OB-associations and superbubbles. Also, in Large Magellanic Cloud, FERMI/LAT experiment observed positive correlation of gamma-emission related to the cosmic ray acceleration with the star formation regions, superbubbles and OB-associations, rather than with interstellar gas density [26].
4 Hardening of the spectra at 200–300 GeV/n It is seen in Fig. 2 that the proton spectrum measured by ATIC becomes harder near the energy of 200–300 GeV: the spectral index below 200 GeV is ≈ 2.78, above 300 GeV is ≈ 2.60, ∆γ ≈ 0.18. Not single-power-law spectrum of protons mesured by ATIC was extensively discussed in the three-component model of cosmic rays spectra [7] in 2006. This hardening is also supported by comparison of the data of the direct magnetic measurements AMS01 [28], CAPRICE [29], BESS-TeV [30] with the ATIC data at higher energies. Recently this effect was confirmed with high energy resolution by the magnetic spectrometer of the PAMELA apparatus [13]. The break of the spectrum occurs at rigidity near 230 GV and is very sharp in the PAMELA data. The spectrum of helium nuclei measured by ATIC also shows spectral hardening near 250–350 GeV/n [27]. This result also has general agreement with all cited above papers [28, 29, 30, 13]. Similar spectral hardening in the spectra of heavy nuclei C,O, Ne, Mg, Si, and in the groups of CNO, NeS, Z¿=3 was observed by ATIC as early as 2007 [27].
15
32 ND I NTERNATIONAL C OSMIC R AY C ONFERENCE , B EIJING 2011
ATIC CREAM−III (preliminary)
Flux × R 2.6, m−2s−1ster −1GV 1.6
AMS BESS−TeV
MUBEE JACEE
CAPRICE
RUNJOB
PAMELA
104
10
102
10
3
104
5
10
6
10 R, GV
Figure 2: Proton spectrum of AMS [28], BESS-TeV [30], CAPRICE [29], ATIC [8], CREAM [10], MUBEE [15], JACEE [16], RUNJOB [17].
The energy of breaking point was about 200–300 GeV/n again. Hardening of the heavy nuclei C–Fe was confirmed recently by CREAM-I+CREAM-II results [31] and the spectral indexes below and above 200 GeV/n for elements heavier than boron measured by CREAM were: γbelow=2.77±0.03 , γabove=2.56±0.04 . This result is close to previous ATIC data for protons. The behavior of different nuclei in the respect of 200 GV spectral hardening is very similar, therefore it is reasonable to consider all nuclei from a joint point of view to explain the phenomenon. One known mechanism of the upturn of the spectra is the cosmic-ray reacceleration due to the second order Fermi acceleration on the magnetic inhomogeneities in the interstellar medium. However, this mechanism does not work until such high rigidity as 200 GV [32]. Similar feature in the spectra appears in models which take into account Alfvenic drift both upstream and downstream of the shock for different types of supernova remnants during their evolution [18]. The realization of this model in that paper does not allow us to fit the experimental data around 200 GV. One more mechanism to explain the observed upturn of the spectra was considered in [33]. All these explanations are questionable yet. It looks reasonable to suppose some additional kind of sources to explain the observed upturn. For example, in [7] novae stars were considered to be such sources. A number of other possibilities may be considered as well.
5 Fine structure in the electron spectrum A strong excess in a form of a wide peak in the energy range of 300–800 GeV was discovered in 2008 in the electron+positron (hereafter electron) spectrum in the energy range from 20 GeV to 3 TeV measured by the ATIC experiment [34]. Later an excess above the expected electron spectrum was confirmed in the FERMI/LAT experiment [35] as well. A possible connection of this “ATIC
excess” with annihilation or decay of dark matter particles provoked a very extensive discussion in the literature starting with the seminal paper [34]. In the paper [36] an independent analysis of the ATIC data was carried out. The “ATIC excess” has been confirmed, however the spectrum has been measured with finer energy binning and a “fine structure” of the ATIC excess has been discovered (see Fig. 3). The balloon flights ATIC-2 and ATIC-4 reproduce this fine structure very well [36]. The statistical significance both of the similarity of the structure in the ATIC-2 and ATIC-4 data and of the χ2 -criterion for the total ATIC2+ATIC-4 statistics was 99.7% [36]. Some “fine structure” in the elctron spectrum was expectable [37]. It was shown in [38] that point-like and instantaneous in time sources of electrons could produce sharp peaks such as observed in the ATIC experiment [36]. The main mechanism that produces sharp peaks in this case is the cooling of electrons due to synchrotron and inverse Compton losses. Unified age of a population of electrons with initial single power-law spectrum is needed to produce one single electron peak by this way. On the contrary, the permanent sources like dark matter clumps would mix such peaks with different energies related to the different moments of the time of emission of electrons and produce wide distributions in the energy spectrum [39], which has little in common with the fine structure observed by ATIC. The fine structure in the ATIC’s electron spectrum is incompatible with the annihilation or decay of the dark matter particles as a source of the ATIC excess. The observed amplitude of the fine structure in the electron spectrum is very high (Fig. 3). The question arises: is it possible in principle to obtain such high-amplitude and sharp structure by a reasonable physical way? To address this question we follow the approach of [38] supposing that the observed structure related mainly to a number of nearby pulsars and associated with them supernova remnants, but we use more recent data for the building of the list of nearby pulsars. Literally, we adopted the list of ten nearby Fermi/LAT pulsars which are expected to contribute significantly to the measured electron flux in the energy range between 100 GeV and 1 TeV compiled in [40]. To obtain reasonable result we have to change the parameters of four pulsars among the list: J1741-2054, J0659+1414, J1057-5226, J2043+2740. We adopted the following special parameters for these four selected pulsars: source spectral index γ = 1.0, Ecut = 20 TeV (instead of γ = 1.7, Ecut = 1 TeV in [40]), the ages were changed to 420, 300, 600, 1100 kyr (instead of 392, 110, 535, 1200) respectively. The parameters for other pulsars were as in the original paper [40]. For all associated supernova remnants the parameters γ = 2.3, Ecut = 5×10⁴ TeV were adopted. For the spectrum of background electrons we adopted the GALPROP conventional spectrum (“model 0” from the paper [41]), but we had to terminate this background near the energy of 200 GeV artificially (see Fig. 3) to obtain sufficiently high relative amplitudes of the pulsar peaks. It is interesting to note that the spectral index
16
V.I. Z ATSEPIN et al. T HE EXPERIMENTAL CONSTRAINTS FROM ATIC Galprop
Flux*E 3, m−2 s−1sr −1GeV 2
10 FERMI SNR’s FERMI/LAT, 2010 HESS ATIC2+ATIC4
Galprop + 10 FERMI SNR’s+Pulsars pulsars fitted to ATIC
102
10
102
3
10
Energy, GeV
Figure 3: Fitting of the electron spectrum fine structure by the FERMI pulsars (see the text for details). The experimental data are: FERMI/LAT [43], HESS [44], ATI2+ATIC4 [36]. of 2.54 in the “model 0” and the cutoff near 200 GeV may be associated with the values for the low-energy type of sources in [7] (see also section 4). It is seen in Fig. 3 that we has obtained a reasonable description of the experimental fine structure of the electron spectrum. Besides, the same model describes the anomaly high fraction of positrons measured by PAMELA [42] and predicts further growth of the positron fraction up to almost 50% of total electron plus positron flux at energies near 300 GeV. This prediction may be tested in future experiments. We do not insist that the proposed model is quite realistic but definitely it proves that the fine structure observed by ATIC in the electron spectrum may be understood within reasonable suppositions. The work was supported by RFBR grant number 11-0200275.
References [1] A.R. Bell, MNRAS, 1978, 182: p. 147–156. [2] W.I. Axford, Proc. 17th International Cosmic Ray Conference, 1981, 12: p. 1155–203. [3] A.R. Bell, S.G. Lucek, MNRAS, 2001, 321: p. 433–438. [4] E.G. Berezhko., Adv. Sp. Res., 1978, 41: p. 429–441. [5] V.I. Zatsepin, J.H. Adams, Jr., H.S. Ahn, et al., Bulletin of the Russian Academy of Sciences. Physics, 2004, 68, p 17801783. [6] J.P. Wefel, J.H. Adams, H.S. Ahn, et al., Proc. 29th International Cosmic Ray Conference, 2005, 3: p. 105–108. [7] V.I. Zatsepin and N.V. Sokolskaya, A&A, 2006, 458: p. 1–5. [8] A.D. Panov, J.H. Adams Jr., H.S. Ahn, et al., Bulletin of the Russian Academy of Sciences: Physics, 2009, 73: p. 564–567. [9] H.S. Ahn, E.S. Seo, J.H. Adams, et al., Adv. Sp. Res., 2006, 37: p. 1950–1954. [10] Y.S. Yoon, H.S. Ahn, T. Anderson, et al., Proc. 31th International Cosmic Ray Conference., 2009, icrc2009.uni.lodz.pl/proc/pdf/icrc0668.pdf. [11] Y.S. Yoon, H.S. Ahn, P.S. Allison, et al., ApJ, 2011, 728:122 (8pp).
[12] A. V. Karelin, S. V. Borisov, A. M. Galper, S. A. Voronov for PAMELA collaboration, Astrophys. Space Sci. Trans., 2011, 7, p. 235–238. [13] O. Adriani, G.C. Barbarino, G.A. Bazilevskaya, et al., Science, 2011, 332, p 69–72. [14] V.S. Ptuskin, V.N Zirakashvili, et al., A&A, 2005, 429, p 755–765. [15] V.I. Zatsepin, T.V. Lazareva, G.P. Sazhina, N.V. Sokolskaya, Physics of Atomic Nuclei, 1994, 57, p 645–650. [16] K. Asakimori, T.H. Burnett, M.L. Cherry, et al., ApJ, 1998, 502, p 278–283. [17] M. Hareyama, V.A. Derbina, V.I. Galkin, et al., ApJ Lett., 2005, 628, p L41–L44. [18] V. Ptuskin, V. Zirakashvili, E.-S. Seo, ApJ, 2010, 718, p 31– 36. [19] D. Caprioli, E. Amato, P. Blasi, Astroparticle Physics, 2010, 33, p 160–168. [20] A.A. Abdo, M. Ackermann, M. Ajello, et al., Science, 2010, 327, p 1103–1106. [21] R. Enomoto, T. Tanimori, T. Naito, et al., Nature, 2002, 416, p 823–826. [22] F. Aharonian, A.G. Akhperjanian, A.R. Bazer-Bachi, et al., A&A, 2006, 449, p 223–242. [23] M.A. Malkov, P.H. Diamond, R.Z. Sagdeev, et al., Nature Communications, 2011, 2, paper 194. [24] J.C. Higdon and R.E. Lingenfelter, et al., ApJ, 2003, 590, p 822–832. [25] M.E. Wiedenbeck, W.R. Binns, E.R. Christian, et al., ApJ Lett, 1999, 523, p L61–L64. [26] A. A. Abdo, M. Ackermann, M. Ajello, et al., 2010, arXiv:1001.3298v1 [astro-ph.HE]. [27] A.D. Panov, J.H. Adams, Jr, H.S. Ahn, et al., Bulletin of the Russian Academy of Sciences: Physics, 2007, 71, p 494–497. [28] J. Alcaraz, B. Alpat, G. Ambrosi, et al., Phys. Lett. B, 2000, 490, p 27–35. [29] M. Boezio, V. Bonvicini, P. Schiavon, et al., Astropart. Phys., 2003, 19, p 583–604. [30] S. Haino, T. Sanuki, K. Abe, et al., Phys. Lett. B, 2004, 594, p 35–46. [31] H.S. Ahn, P. Allison, M.G. Bagliesi, et al., ApJ. Lett., 2010, 714, p L89–L93. [32] J.L. Osborn, V.S. Ptuskin, et al., Sov. Astron. Lett., 1988, 14, p 132–134. [33] P.L. Biermann, J.K. Becker, J. Dreyer, et al, ApJ, 2010, 725, p 184–187. [34] J. Chang, J.H. Adams, Jr, H.S. Ahn, et al., Nature, 2008, 456, p 362–365. [35] A.A. Abdo, M. Ackermann, M. Ajello, et al., Phys.Rev.Lett., 2009, 102, paper 181101. [36] A.D. Panov, V. I. Zatsepin, N. V. Sokolskaya, et al., Astrophys. Space Sci. Trans, 2011, 7, p 119–124. [37] A.D. Erlykin, A.W. Wolfendale, J. Phys. G: Nucl. Part. Phys., 2002, 28, p 359–378. [38] D. Malyshev, I. Cholis, J. Gelfand, Phys. Rev. D, 2009, 80, paper 063005. [39] M. Kuhlen, D. Malyshev, Phys. Rev. D, 2009, 79, paper 123517. [40] L. Gendelev, S. Profumo, M. Dormody, J. of Cosmology and Astroparticle Physics, 2010, 02, p 016. [41] D. Grasso, S. Profumo, A.W. Strong, et al., Astroparticle Physics, 2009, 32, p 140-151. [42] O. Adriani, G. C. Barbarino, G. A. Bazilevskaya, et al., Nature, 2009, 458, p 607–609. [43] M. Ackermann, M. Ajello, W.B. Atwood, et al., Phys.Rev.D, 2010, 82, p 092004. [44] F. Aharonian, A.G. Akhperjanian, G. Anton, et al., A&A, 2009, 508, p 561–564.
17