Asian Social Science; Vol. 13, No. 3; 2017 ISSN 1911-2017 E-ISSN 1911-2025 Published by Canadian Center of Science and Education
The Gap between the Returns that Calculated by Capital Asset Pricing Model and the Actual Returns in Abu Dhabi Securities Exchange (ADX): Evidence from the United Arab Emirates Anas Ali Al-Qudah1 1
Emirates College of Technology, BAF Dept, Abu Dhabi, UAE
Correspondence: Anas Ali Al-Qudah, Emirates College of Technology, BAF Dept, Abu Dhabi, UAE Millennium Tower, Sheikh Hamdan Street, P. O. Box: 41009, Abu Dhabi, United Arab Emirates. E-mail:
[email protected] Received: January 10, 2017
Accepted: January 19, 2017
Online Published: February 15, 2017
doi:10.5539/ass.v13n3p126 URL: http://dx.doi.org/10.5539/ass.v13n3p126 orcid.org/0000-0003-3609-1541 Abstract This study aimed to compare the Historical Returns (Rit) in companies listed in Abu Dhabi Securities Exchange (ADX) with the return which calculated by Capital Asset Pricing Model (E(Rit)) for the same companies and periods, and trying to figure out the level of dispersion, distortions and differences between them, and trying to figure out the strengths and weaknesses for the CAPM to explain the variances which happened in the Annual Return. The researcher used the time series analysis to achieve the target of this study, using Microsoft Office Excel software to introduce some figure and graphs which considered as output from Scatter charts, which are often used to find out if there's a relationship between variable X and Y to make judgment on the gap between the variables mentioned before. The researcher found that in the most of the study sample firms the capital asset pricing model could not to predict the returns were generated by companies in Abu Dhabi Securities Exchange (ADX), except in the banking sector, the result was amazing because the graphs which output from the time series analysis show the ability of CAPM to predict the Historical Returns, they were very closed and they Walking in the same direction without volatility. After the results appear in the time-series analysis researcher can says that there are weaknesses in the ability of CAPM to predict the returns in the financial markets which consistent with the (Fama & French, 1992) and with most studies conducted in this regard, but the model shows high ability to predict the returns in the banking sector. Therefore, the researchers can generalization this result on the financial markets in the United Arab Emirates. Keywords: Abu Dhabi Securities Exchange (ADX), Capital Asset Pricing Model (CAPM), Expected Return (E(Rit), Historical Returns (Rit), Risk (β). JEL classification: G20, G21, G24, G30, G31 1. Introduction The capital asset pricing model (CAPM) is a mathematical model which describes the hypothetical relationship between risk and expected return for financial assets, especially stocks, it extensively used in finance management field for the estimation of securities that include risk, therefore, this model takes into account the risks involved on capital which used in the investment in securities. CAPM, introduced a theoretical exemplification of the conduct of securities, it can be used in assess a firm's cost of equity capital. In spite of restriction, this model can be an advantageous supplement to several parties like financial managers, investors, Prospective shareholders, Creditors and Potential lenders. The charisma of the CAPM is that it offering strong satisfactory prognostications for how to measurement involved risk and the relationship between the most important items in the finance field expected return and risk. Unluckily, the experimental record in this model is inferior enough to decline the method it is used in implementations. The CAPM’s experimental troubles might reflect theoretical weakness, because of many 126
ass.ccsenet..org
Asiann Social Science
Vol. 13, No. 3; 2017
simplify assumptions, buut some of theese reasons maaybe also appeear by difficultties in achieveement valid tessts of this modell. The CAPM M constructs on the model off portfolio seleect progressed by Harry Marrkowitz (1959)). In this model, the choice of investors to chhoose portfolio at period t-11 that generatees a random reeturn at t. Thee Markowitz model m suppose alll investors aree risk aversionn and, when theey have many choices to sellect between portfolios, they only concern abbout the (meann, variance) off their (t) periood investment return, especiially for one tiime investmen nt, so, the Markoowitz model is often called a (mean-variancce) model. The CAPM M was introduuced by Jack T Treynor (1961, 1962), Williaam F. Sharpe (1964), John L Lintner (1965)) and Jan Mossiin (1966) sepaarately. In thee regarding off the CAPM’ss assumptions, the scholars mentioned before agreed on a number of assumptions, a thhe most imporrtant of these aassumptions thhat all participaants in the fina ancial market havve the same taarget mainly iss to maximize wealth, and thhe investors raational in addiition to risk-av verse, and their iinvestment aree widely diverrsified, in adddition that all investors are pprice takers w which is mean they cannot effe fect in securitiees prices, the pprocesses of lend and borrow w will be done under the inteerest equal risk k free rate, all traansactions devvoid of taxatioon costs, all seecurities are coompletely capaable of being divided and liquid, all investoors have identiccal expectationns, and the lasst assumption ffor this model perfectly linkked with the market m efficiency especially thhe strong form m efficiency m market where this model assumes that aall information n are available ttimely to all innvestors at the ssame degree oof accuracy.
Figure 1. Capital Asset Pricing Model & the relatioonship betweeen Risk & Retuurn. Many of eexperimental tests t show maarket distortionns like the efffect of size annd value of firrms that canno ot be demonstraate and explainned by the cappital asset priciing model.(Fam ma & French, 1992) in the tthree-factor model. m Through thhis idea, the reesearcher will try in this studdy to figure ouut the possibilitty of predictinng the returns in the Abu Dhabbi Securities Exchange E (ADX X), by compaaring the returnns calculated bby the CAPM M and the histo orical returns forr the same firm ms & periods, to find out thhe extent of thhe differences and distortions that occur in n this financial m market which is i classified as an emerging m market. 2. Literatu ure Review A many L Literatures havve shown thatt non varied sskewness and kurtosis show ws a significaant role in sec curity estimationn. (Fang & Laai, 1997) derivved a four-mooment CAPM M and it was sshown that meethodical variance, methodicaal skewness annd methodical kurtosis engaage to the risk premium of ssecurities. (Chhristie & Chaudhry, 2001) theyy display thatt the third andd fourth mom ments explain the return-prooducing proceess in the fina ancial markets w well. All Investoors are mostlyy recompensedd for taking riskk as assessing by high methoodical variance e and methodicaal kurtosis. Thhey also keep the expected returns E(Rit)) for taking thhe profit of a positively ske ewed market (A Arditti, 1971). It also has beeen documentted that skewnness and kurtoosis cannot bee various awa ay by growing thhe magnitude of o portfolios. Accordingg to the (Fersonn & Harvey, 11991) study off US bond and stocks returnss, they discoveered that the timing of variatioon in the risk premium p is moore significant than the changges in the betaas. That’s why equity premiu um of risk was seet to modify with w market situuation and business cycles. (Schwert, 1989) imputeed differential risk premium m between up aand down marrkets to varyinng methodicall risk over the buusiness rotatioon. (Friend andd Blume, 19700) and (Black, Jensen and Sccholes, 1972) sstudy the portffolios behavior, nnot only the individual i secuurities. Expectted returns annd market betaas collect in thhe same metho od in portfolios, if the CAPM M demonstratess securities retu turns it can demonstrates poortfolio returnss. (Fama & Fre ench, 1992) in thhis paper they discuss the reelationship bettween beta andd expected retuurn may be evven adulate than the 127
ass.ccsenet..org
Asiann Social Science
Vol. 13, No. 3; 2017
one reportted by the earlly experimentaal literature. T That idea was hhowever defy in 1995 by K Kothari et al. (F Fama and Frenchh, 2004) that thhe reported efffects sound to lack a theoretiical base. 3. The stu udy objective This studyy aims to comppare the historrical returns in companies lissted in Abu Dhhabi Securitiess Exchange (A ADX) with the rreturn calculated by Capital Asset Pricingg Model for thhe same comppanies and thee same period, and trying to fi figure out the level of disperssion, distortionns and differennces between tthem, and tryinng to figure ou ut the strengths aand weaknessees for the CAP PM to explain the variances which happenned in the Annnual Return. At A the local levell, this study iss the first attem mpt to discusss the differencces between thhe historical reeturns & the return calculated by CAPM. 4. The Stu udy Model Figure 2 bbelow shows thhe virtual moddel for this stuudy to achieve the object of this research, which explain n two main variaable of this stuudy the 1st onee is the historiccal return (Acttual return), annd the 2nd is thhe return calcu ulated by CAPM, for the same companies andd the same perriods:
Figure 2. The viirtual model off the study, Souurce: made byy researcher make comparisoon between thhe (Rit: The Actual A From the Figure 2 abovve, it's clear thhat this study llooking for m Return) annd (E(Rit): thee Return calcuulated by CAP PM) for the saample will takke randomly frrom the companies listed in thhe ADX. 5. The Pop pulation & Saample of the S Study 5.1 The Stuudy Populationn The Popullation of this sttudy is the com mpanies listed in Abu Dhabii Securities excchange, this finnancial markett was establishedd in Novemberr 15, 2000 for trading sharess and bonds of local and foreign companiess. 5.2 The Stuudy Sample The Sampple of this studdy includes raandom compaanies taken froom listed com mpanies in Abuu Dhabi Securities exchange. There are manny sectors in thhe Abu Dhabi Securities Exchange (ADX), But it considder a small number companiess in this financial market coompared to otther markets, sso the researchher takes apprroximately 48% as random saample from thee a whole comppanies listed inn (ADX). The table1 below iincludes the stuudy sample: Table 1. Thhe Study Sampple SR 1 2 3 4 5 6 7 8
Sectoor Servicces Insurannce Servicces Insurannce Industrrial Consumer Staples Bankks Bankks
Symbool ADAVIAT TION ABNIC C ADNH H ADNIC C ADSB B AGTHIIA ADCB B ADIB B
Company Abbu Dhabi Aviatioon Co. Al Buuhaira National IInsurance Abuu Dhabi Nationall Hotels Abu Dhhabi National Inssurance Co. Abu D Dhabi Ship Buildding PJSC AG GTHIA GROUP P PJSC Abu D Dhabi Commerccial Bank Abbu Dhabi Islamicc Bank
Source: made by researccher 6. The Stu udy Method The researrcher used the time series annalysis to achieve the target of this study; he found it thhe most approp priate way for thhis type of research, below thhe steps that thee researcher gooes through it in the next secctions: 6.1 The firrst step: Colleect the historiccal return from m the secondarry resources off data, which ppublished from m the 128
ass.ccsenet.org
Asian Social Science
Vol. 13, No. 3; 2017
Abu Dhabi Security Exchange (ADX), these monthly data collected for the study sample that includes eight companies listed in ADX for the period (2008-2015). 6.2 The second step: calculate the Annual return from the monthly return that collected in the first step, for the study sample using the Holding Period Return (HPR). 6.3 The third step: calculate the Beta (systematic Risk) for the companies in the study sample, for the same period above, using the covariance of the return of an asset and the return of the industry index divided by the variance of the return of the industry index over a study period. 6.4 The fourth step: getting the risk free rate (Rf) from the Central Bank in Abu Dhabi for the years including in this study (2008-2015), it equals the Interest Rate for the Treasury Bills that issued from the CB in Abu Dhabi. 6.5 The fifth step: getting the industry index for each sector used in this study as shown in Table (1) from the ADX for the years including in sample (2008-2015). 6.6 The sixth step: calculate the E(Rit) Expected Return for each company in the study sample using the CAPM. Because the Variables that need to use CAPM equation become existed in the previous steps 6.7 The seventh step: the researcher will use the output in the previous steps especially the Historical Return (Rit) and the Expected Return E(Rit) to achieve the time series analysis, by insert the output these information to the Microsoft Office Excel software, and from the result of the Graphics which produced by Excel software then the researcher can make the comparison between the variables above. 7. The Study Variables The variables of this study as following: 7.1 The Historical Return: the returns which actually earned by investors in the study period, in this regard the researcher used the HPR equation to calculate this variable: 1
Rit
1
1
Whereas, Rit: return on acquisition period representing return on stock P (t): stock price at the end of year P (t-1): stock price at the beginning year 7.2 The Systematic Risk (Beta): to calculate the Beta for the companies in the study sample the researcher used the covariance equation as following:
,
2
Whereas, β: Systematic Risk Covariance (Rit, Rm): the covariance of the return of an asset and the return of the industry index Variance of Market: the variance of the return of the industry index 7.3 The Expected Return: after the researcher get the Beta (β), Risk free rate (Rf) and the industry index (Rm), he used the CAPM to calculate the Expected Return for the study period for all companies in the study sample as following: ∗
Where, E(Rit): Expected Return for the Company (i), Period (t) Rf: Risk free rate Rm: industry index é∶ Random Error
129
é 3
ass.ccsenet..org
Asiann Social Science
Vol. 13, No. 3; 2017
8. Discusssion the Resullts After usingg the Softwaree Excel to draw w the disparityy between the H Historical Retuurn in the ADX X and the Expe ected Return callculated by CA APM in the sam me market forr the same com mpanies whichh include in thee study sample e, the researcherr divide resultss discussion too be each com mpany separateely, the followiing figures shoow the Differe ences between thhe actual valuees of return andd the values caalculated for thhe return usingg CAPM for eaach company in i the study sampple: 8.1 The 1sst Company: ADAVIATION
Figuure 3. Scatter chhart output froom Microsoft O Office Excel sooftware for thee ADAVIATIO ON Company ADAVIAT TION: this Syymbol indicates to the Abu D Dhabi Aviationn Co. it is onee of the Abu D Dhabi companiies in the Services sector, afterr calculate the E(Rit) using CAPM and caalculate (Rit) uusing HPR andd make comparison between thhem using Exxcel software especially Sccatter charts w which are ofteen used to finnd out if therre's a relationshiip between vaariable X and Y to make juddgment on thee gap betweenn the variabless mentioned before which are governed by TIME T SERIES S. r fouund that the tim me series can bbe divided intoo two main periods the first from Given the figure above researcher 2008 to 20012 and the seecond from 2012 to 2015. Inn the first periood the gap bettween the (Ritt) and E(Rit) itt was very high aand the Historrical Return (R Rit) exceed the Expected Retuurn E(Rit). This case shows the weeakness of CAPM to predictt the return in the ADX, butt in the secondd period the E(Rit) E exceed thee (Rit) but theey were very cclosed to each, the researcheer can say in tthe second perriod the gap in n not significantt. Which meanns the CAPM w was able to preedict the returnns in period of (2012-2015). 8.2 The 2nnd company: ABNIC A
F Figure 4. Scattter chart outpuut from Microsoft Office Exccel software for the ABNIC C Company ABNIC: thhis Symbol inddicates to the A Al Buhaira Naational Insurannce it is one off the Abu Dhabbi companies in the Insurance sector, given the figure abbove researcheer found that tthe time series can be dividded into two main periods thee first from 20008 to 2013 annd the secondd from 2013 too 2015. In the first period thhe gap between the (Rit) and E E(Rit) it was very v high and tthe Expected R Return E(Rit) exceed Historrical Return (R Rit) this case sh hows 130
ass.ccsenet..org
Asiann Social Science
Vol. 13, No. 3; 2017
the weakness of CAPM to predict the return in the A ADX, but in thhe second periood the (Rit) exxceed E(Rit), which w shows the weakness of CAPM too. T That means thee CAPM wasnn’t able to preddict the returns in period of time series (20008-2015). 8.3 The 3rrd company: AD DNH
F Figure 5. Scattter chart outpuut from Microssoft Office Exccel software foor the ADNH C Company ADNH: thhis Symbol inddicates to the Abu Dhabi N National Hotelss it is one of tthe Abu Dhabbi companies in n the Services seector, given thhe figure abovee researcher found that the tim me series can be divided intoo two main periods the first frrom 2009 to 20012 and the seecond from 20013 to 2015. Inn the first periood the gap bettween the (Rit) and E(Rit) it w was very high and the Histoorical Return (Rit) exceed thhe Expected R Return E(Rit) tthis case show ws the weakness of CAPM to predict p the retuurn in the ADX X, and in the seecond period thhe (Rit) exceedd E(Rit) too, which w also showss the weakness of CAPM. T That means thee CAPM wasnn’t able to preddict the returnns in period of time series (20008-2015). It is good to say thhat the (Rit) annd E(Rit) were very closed inn the (2008-20009) & (2012-2 2013) but in the time series annalysis it is not considered a one period sttatistically signnificant, so thee researcher ig gnore these two yyears. 8.4 The 4thh company: AD DNIC
F Figure 6. Scatteer chart outputt from Microsooft Office Exceel software forr the ADNIC C Company ADNIC: thhis Symbol inddicates to the A Abu Dhabi Naational Insurannce Co. it is onne of the Abu D Dhabi companiies in the Insurannce sector, givven the figure above researccher found thaat the time seriies can be diviided into two main periods thee first from 20008 to 2010 annd the secondd from 2010 too 2015. In the first period thhe gap between the (Rit) and E E(Rit) it was very high andd there was veery volatility iin the result, tthis case show ws the weakness of CAPM to predict the reeturn in the A ADX, but in thhe second periiod they weree very closed tto each with some s differencess but they go hand in the saame direction. Which meanss the CAPM w was able to preedict the returrns in period of ((2010-2015). 131
ass.ccsenet..org
Asiann Social Science
Vol. 13, No. 3; 2017
8.5 The 5thh company: AD DSB
Figure 7. Scattter chart outpuut from Microssoft Office Exccel software foor the ADSB C Company ADSB: thiis Symbol indiicates to the A Abu Dhabi Shipp Building PJS SC. It is one off the Abu Dhabbi companies in the Industrial sector, given the figure above researcheer found that tthe time series can be dividded into two main periods thee first from 20009 to 2012 annd the secondd from 2012 too 2015. In the first period thhe gap between the (Rit) and E E(Rit) it was very v high andd the Historicaal Return (Rit)) exceed the E Expected Returrn E(Rit), this case shows the weakness of CAPM C to preddict the return in the ADX, but in the secoond period thee E(Rit) exceed the (Rit) but tthey were veryy closed to eacch, the researccher can say inn the second pperiod the gapp in not signifiicant. Which meeans the CAPM M was able to ppredict the retuurns in period of (2012-20155). From the saame figure abo ove it appears that there is notiiceable result iin the years (20014-2015) it allmost equal in returns. 8.6 The 6thh company: AGTHIA
Figure 8. Scatteer chart output from Microsooft Office Exceel software forr the AGTHIA Company GROUP PJSC. It is one of tthe Abu Dhabbi companies in n the AGTHIA: this Symbol indicates to thhe AGTHIA G Consumerr Staples sectorr, given the figgure above ressearcher foundd that the time series from 22008 to 2015, when w make com mparison betweeen the (Rit) and E(Rit) it was very higgh gap and thee Historical R Return (Rit) allmost exceed thee Expected Retturn E(Rit), thhis case shows the weakness of CAPM to ppredict the retuurn in the ADX X for a whole peeriod of study.
132
ass.ccsenet..org
Asiann Social Science
Vol. 13, No. 3; 2017
8.7 The 7thh company: AD DCB
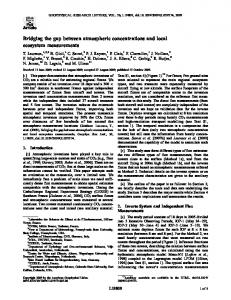
F Figure 9. Scatteer chart outputt from Microsooft Office Exceel software forr the ADCB Coompany ADCB: thhis Symbol inddicates to the A Abu Dhabi Com mmercial Bannk. It is one of the Abu Dhabbi companies in the bank sectoor, given the figure above researcher foound that the time series fr from 2008 to 2015, when make m comparisoon between thee (Rit) and E(R Rit) it was veryy small gap and the Historicaal Return (Rit)) almost exceed the Expected R Return E(Rit), this case show ws the strong aability of CAPM to predict thhe return in the ADX for a whole w period of sstudy. Actuallyy this is interessting result. 8.8 The 8thh company: AD DIB
F Figure 10. Scattter chart outpuut from Microssoft Office Exccel software foor the ADIB Coompany ADIB: this Symbol indicates to the A Abu Dhabi Islam mic Bank. It iss one of the A Abu Dhabi com mpanies in the bank sector; it iss interesting reesult too like thhe result in thee previous bannk, given the fiigure above researcher found d that the time seeries from 20008 to 2015, whhen make com mparison between the (Rit) aand E(Rit) it w was very small gap and the Exxpected Returnn E(Rit) exceedd the Historicaal Return (Rit),, this case show ws the strong aability of CAP PM to predict thee return in thee ADX for a whole periodd of study. Thhe Returns (E((Rit) & (Rit)) went in the same direction w without havingg fluctuated or volatility betw ween them. 9. Conclussion This studyy is the first off its kind whicch conducted oon the Abu Dhhabi Securities Exchange (A ADX) where it dealt with differrences between the actual reeturns and thee expected retuurns calculatedd by capital assset pricing model, m includes m many sectors: Insurance, Services, Indusstrial, Consum mer Staples annd Banks, by using time series s analysis thhat showed thhat the capital asset pricing model could not to predicct the returns were generate ed by companiess in Abu Dhabbi Securities E Exchange (AD DX), except inn the banking sector, it shoowed the ability of CAPM to predict the Hisstorical Returnns. Referencees Arditti, F F. (1967). Risk R and thhe required return on equity. Journnal of Finaance, 22, 19-36. doi:100.1111/j.1540--6261.1967.tb001651.x 133
ass.ccsenet.org
Asian Social Science
Vol. 13, No. 3; 2017
Arnold, G. (2005). Corporate financial management (3rd ed.). Harlow: Financial Times/Prentice Hall. p. 354 Brigham, E. F., & Honston, J. F. (2001). Fundamentals of financial management. Harconrt. Inc.U.S.A. Campbell, J., & Viceira, L. (2005). the Term Structure of the Risk-Return Tradeoff. National Bureau of Economic Research Working Paper No. 11119. DOI: 10.3386/w11119 Carhart, M. M. (1997). On Persistence in Mutual Fund Performance. The Journal of Finance. 52, 57–82. doi:10.1111/j.1540-6261.1997.tb03808.x. JSTOR 2329556 Christie-David, R., & Chaudhry, M. (2001). Coskewness and cokurtosis in futures markets. Journal of Empirical Finance, 8, 55-81. DOI: 10.1016/S0927-5398(01)00020-2. DeAngelo, H., & Masulis, R. W. (1980). Optimal Capital Structure under Corporate and Personal Taxation. Journal of Financial Economics, 8, 3-29. Doi:10.1016/0304405X(80)90019–7 Fama, E. F., & French, K. R. (1992). The Cross-Section of Expected Stock Returns. Journal of Finance, 47(2), 427–465. DOI: 10.1111/j.1540-6261.1992.tb04398.x Fama, E. F., & French, K. R. (1993). Common risk factors in the returns on stocks and bonds. Journal of Financial Economics, 33(3). Doi: 10.1016/0304-405X (93)90023-5 Fama, E. F., & French, K. R. (1993). Common Risk Factors in the Returns on Stocks and Bonds. Journal of Financial Economics, 33(1), 3–56 Fattoh, B. (2005). Capital structure in South Korea: a quintile regression approach. Journal of Development Economics, 76, 231-250. doi:10.1016/j.jdeveco.2003.12.014 French, C. W. (2003). The Treynor Capital Asset Pricing Model. Journal of Investment Management. 1(2), 60-72. Gibbons, M., Ross, S., & Shanken, J. (September 1989). A test of the efficiency of a given portfolio. Econometrica, 57(5), 1121–1152. Doi: 10.2307/1913625.JSTOR 1913625. Graham, J. R., & Harvey, C. R. (2001). The theory and practice of corporate finance: evidence from the field. Journal of Financial Economics, 60(2-3), 187-243. Gul, F. A., & Tsui, J. S. (1997). A test of the free cash flow and debt monitoring hypotheses: Evidence from audit pricing. Journal of Accounting and Economics, 24(2), 219-237. Hanauer, M. X., & Linhart, M. (2015). Size, Value, and Momentum in Emerging Market Stock Returns: Integrated or Segmented Pricing? Asia-Pacific Journal of Financial Studies, 44(2), 175–214. doi:10.1111/ajfs.12086. Islami Bigdeli, G., & Bidgolo, M. (2006). The Contrast between Return and Risk of Alternative Investment Opportunities in Iran. Accounting and Auditing Investigations, 1(44), 149- 175 Lamberson, M. (1995). Changes in Working Capital of Small Firms in Relation to Changes in Economic Activity, University of Central Arkansas. American Journal of Business, 10(2), 45-50. http://dx.doi.org/10.1108/19355181199500015 Michael Schmidt, 2014 (Copyright © 2009 Investopedia.com) Mullins, D. W. (1982) Does the Capital Asset Pricing Model Work? David W. Mullins, Jr., FROM THE JANUARY 1982 ISSUE, Harvard business review. Steven Nicholas, July 6, 2015, (Copyright © 2009 Investopedia.com) Copyrights Copyright for this article is retained by the author(s), with first publication rights granted to the journal. This is an open-access article distributed under the terms and conditions of the Creative Commons Attribution license (http://creativecommons.org/licenses/by/4.0/).
134