The genome-wide dynamics of the binding of Ldb1 complexes during erythroid differentiation Eric Soler,1,7,9 Charlotte Andrieu-Soler,1,7 Ernie de Boer,1,7 Jan Christian Bryne,2,8 Supat Thongjuea,2,8 Ralph Stadhouders,1 Robert-Jan Palstra,1 Mary Stevens,1 Christel Kockx,3 Wilfred van IJcken,3 Jun Hou,1 Christine Steinhoff,4 Erikjan Rijkers,5 Boris Lenhard,2,11 and Frank Grosveld1,6,10 1 Department of Cell Biology, Erasmus Medical Center, 3015GE Rotterdam, The Netherlands; 2Computational Biology UnitBergen Center for Computational Science and Sars Centre for Marine Molecular Biology, University of Bergen, N-5008 Bergen, Norway; 3Biomics Department, Erasmus Medical Center, 3015GE Rotterdam, The Netherlands; 4Department of Computational Biology, Max Planck Institute for Molecular Genetics, 14195 Berlin, Germany; 5Department of Biochemistry, Erasmus Medical Center, 3015GE Rotterdam, The Netherlands; 6Center for Biomedical Genetics and Cancer Genomics Center, Erasmus Medical Center, 3015GE Rotterdam, The Netherlands
One of the complexes formed by the hematopoietic transcription factor Gata1 is a complex with the Ldb1 (LIM domain-binding protein 1) and Tal1 proteins. It is known to be important for the development and differentiation of the erythroid cell lineage and is thought to be implicated in long-range interactions. Here, the dynamics of the composition of the complex—in particular, the binding of the negative regulators Eto2 and Mtgr1—are studied, in the context of their genome-wide targets. This shows that the complex acts almost exclusively as an activator, binding a very specific combination of sequences, with a positioning relative to transcription start site, depending on the type of the core promoter. The activation is accompanied by a net decrease in the relative binding of Eto2 and Mtgr1. A Chromosome Conformation Capture sequencing (3C-seq) assay also shows that the binding of the Ldb1 complex marks genomic interaction sites in vivo. This establishes the Ldb1 complex as a positive regulator of the final steps of erythroid differentiation that acts through the shedding of negative regulators and the active interaction between regulatory sequences. [Keywords: ChIP sequencing; transcription factor complexes; development; differentiation; erythropoiesis; long-range interactions] Supplemental material is available at http://www.genesdev.org. Received August 5, 2009; revised version accepted December 4, 2009.
Hematopoietic stem cell differentiation to the erythroid lineage involves coordinated changes in transcription, often by functionally conserved genes such as Gata2, Tal1, Lmo2, Gata1, and Runx1 (Cantor and Orkin 2001). These factors can form different complexes, but also interact with each other in a transcription complex known as the Ldb1 complex. The nuclear protein Ldb1 (LIM domain-binding protein 1) has no DNA-binding or enzymatic activities. Its main functional domains are the LIM interaction domain (LID) in the C-terminal part of the 7
These authors contributed equally to this work. These authors contributed equally to this work. Corresponding authors. 9 E-MAIL
[email protected]; FAX 31-10-7044743. 10 E-MAIL
[email protected]; FAX 31-10-7044743. 11 Corresponding author for informatics. E-MAIL
[email protected]; FAX 47-555-84295. Article is online at http://www.genesdev.org/cgi/doi/10.1101/gad.551810. Freely available online through the Genes & Development Open Access option. 8
protein, interacting with LIM-only protein (LMO) and LIM homeodomain (LIM-HD) factors; the dimerization domain in the N-terminal part of the protein; the Ldb1/ Chip conserved domain (LCCD) domain, which interacts with the Ssbp proteins; and the NLS (nuclear localization signal) (Jurata and Gill 1997; Breen et al. 1998; Matthews and Visvader 2003; Xu et al. 2007). Studies in Xenopus have shown that LID and dimerization domains are important for its function in vivo (Breen et al. 1998). In murine erythroid cells, Ldb1 was originally described as part of a complex composed of the transcription factors Tal1, Gata1, and E2A, and the non-DNA-binding Lmo2 functions as a bridging molecule, together with the assistance of Ldb1, between the DNA-binding factors (Wadman et al. 1997). The complex binds to a GATA–E-box motif and is thought to bind to a number of genes that are upregulated in erythroid differentiation (Brand et al. 2004), including the b-globin locus control region (LCR) and the b-globin gene promoter, where it is thought to be
GENES & DEVELOPMENT 24:277–289 Ó 2010 by Cold Spring Harbor Laboratory Press ISSN 0890-9369/10; www.genesdev.org
277
Soler et al.
important for looping of the LCR to the promoter (Song et al. 2007). A recent proteomics study (Meier et al. 2006) in mouse erythroleukaemic (MEL) cells expanded the number of proteins present in the Ldb1/Lmo2/Tal1/E2A/Gata-1 complex to include HEB, Lmo4, and Lyl1 (closely related to Tal1), and a number of proteins (Ssbp1–4) important for the stability of the Ldb1 protein (Xu et al. 2007). In the proerythroblast-proliferating state, this complex was found to interact with another complex consisting of Gata1/Tal1/ E47/HEB/Mtgr1/Eto2 as well as with the cell cycle regulator Cdk9 and E2-2, with the equilibrium favoring the larger multiprotein complex (Meier et al. 2006). Upon differentiation and cessation of proliferation of the MEL cells, Cdk9 and E2-2 are no longer part of the larger complex, which may favor the dissociation into the two smaller complexes and allow the dimerization of the smaller complex to form loops in the chromatin. The process coincides with a decrease in the level of the suppressive factors Eto2 and Mtgr1 (Davis et al. 2003; Schuh et al. 2005), and an increase in the level of another Lim-only factor, Lmo4 (Grutz et al. 1998; Kenny et al. 1998). Absence of Ldb1 results in early death of the embryo between embryonic day 9.5 (E9.5) and E10.5 with a series of developmental defects, including truncation of the anterior head structure, no heart formation, axis duplication, and absence of hematopoiesis (Mukhopadhyay et al. 2003; M Mylona, JC Bryne, W van IJcken, and F Grosveld, unpubl.). The latter defect resembles the knockout phenotypes of the hematopoietic transcription factors Gata2/Gata1, Lmo2, and Tal1 (Warren et al. 1994; Robb et al. 1995; Shivdasani et al. 1995; Porcher et al. 1996). The early phenotype of these knockouts is explained by the observation that Ldb1, Cdk9, E2A, Lmo2, Gata1, and Eto2 are expressed in the PSp/AGM region of the 9.5-dpost-coitum (dpc) mouse embryo that will later give rise to hematopoietic stem cells (Meier et al. 2006). Differentiation of embryonic stem cells in vitro shows that the number of blast colony-forming cells, the in vitro equivalent of the hemangioblast, is severely reduced, and they have lost the potential to grow and differentiate (M Mylona, JC Bryne, W van IJcken, and F Grosveld, unpubl.). Although a number of target genes of the Ldb1 complex have been described (Anguita et al. 2004; Brand et al. 2004; Lahlil et al. 2004; Tripic et al. 2009) its targets are largely unknown, although a subset of these were reported very recently (Wilson et al. 2009). Here, we report a dynamic picture of the last steps of erythroid differentiation in a model system, through the analysis of the target genes of the Ldb1 complex, by integrating its genome-wide target-binding sequences with the changing gene expression profiles of C88 MEL cells before and after differentiation. This analysis shows a changing binding site profile for the Ldb1 complex during differentiation, for the first time reveals the differences between different classes of core promoters with respect to the preferred relative position of activating complexes, and shows that binding sites of the Ldb1 complex mark positions of longrange interactions.
278
GENES & DEVELOPMENT
Results Analysis of binding sites The basic scheme (Fig. 1A) for the analysis of the Ldb1 complex entails the introduction of a tag into a number of the transcription factors that have been identified previously (Meier et al. 2006). The biotinylation tag, which is biotinylated by the bacterial biotin ligase BirA (Cronan and Reed 2000; de Boer et al. 2003), and the viral V5 tag (Southern et al. 1991) are both insensitive to formaldehyde fixation and, in particular, the biotin tag is excellent in chromatin immunoprecipitations (ChIPs) followed by sequencing (ChIP-seq) (e.g., see Ku et al. 2008; Kolodziej et al. 2009; Soler et al. 2009). The tagged genes are subsequently introduced by stable transfection into C88 MEL cells, and only clones that show expression levels lower than or similar to the endogenous factors (both before and after differentiation of the C88 cells) are used for further analysis to avoid possible phenotypic or other changes due to the overexpression of one of the factors. None of the transfected cell lines showed an aberrant phenotype, and all were fully capable of differentiation (data not shown). Moreover, the tagged proteins are regulated the same as the endogenous factors (Supplemental Fig. 1). After a particular cell line was grown, the ChIP-seq protocol was carried out as described (Soler et al. 2009) for Ldb1, Gata1, Tal1 (Scl), Mtgr1, and Eto2. Typically, the ChIPs of known binding sites show an enrichment of 10fold to 30-fold for either V5 or the biotin tag, whereas sequences that do not bind the complex are not enriched (Supplemental Fig. 2A). The precipitated material was sequenced using the standard Illumina/Solexa protocol, the sequences were mapped back to the genome using the Eland software (Illumina), and peaks were visualized using in-house-developed software (Solex) (Soler et al. 2009; HWJ Rijkers, unpubl.) or the ChIP-seq Visualization Browser based on G-Browse (http://tracc.genereg.net). Between 10 and 60 million sequences were mapped back to the genome for each of the factors. For example, at the comparable noise level (maximal empirical P-value of 5%), we were able to detect 5205 Gata1-binding sites, 4173 Tal1binding sites, and 4982 Ldb1 sites in the induced state in the entire genome (Fig. 1B). The number of actual binding sites is certainly higher than that, as confirmed by a much higher than random co-occurrence of these factors at sites that fall below the 10% false discovery rate (FDR) threshold. We validated the MEL cell data by carrying out the same analysis in primary erythroid cells derived from mouse E13.5 fetal liver, which shows an overlap of 83% of the binding sites (Supplemental Fig. 3). The significance of the data is immediately apparent when the transcription factor-binding sites are compared with the control ChIP-seq (Supplemental Fig. 2B). The analysis of the correlation of binding sites between the factors shows that the large majority of strong Ldb1-binding locations after differentiation is also bound by Gata1 and Tal1, establishing the Ldb1 complex as the most common way of Ldb1-mediated regulation of terminal erythropoiesis (Figs. 1B, 5 [below]). On the other hand, as expected, each of the factors can form
Ldb1 complexes in erythroid differentiation
Figure 1. Analysis of transcription factor-binding sites by ChIP-seq using Solexa Genome Analyzer II. (A) Description of the work flow used for transcription factor analysis. (B) Numbers of different complexes of the five measured factors, estimated using conservative criteria (empirical P-value of 0.05 on the experiment with the weakest signal). The factors were considered part of the same complex if the distance between centers of their binding peaks were within the resolution of the method (200 bp).
complexes with factors other than the ones examined here (Meier et al. 2006). For example, a subset of strong Gata1 sites shows little or no concomitant Tal1 and Ldb1 binding, revealing the existence and positions of different types of Gata1 complexes in the same cell system. Indeed, Gata1 is known to form a number of complexes without Tal1 or the other members of the Ldb1 complex (Hong et al. 2005; Rodriguez et al. 2005). However, even between the different members of the complete complex there are a number of different target sites bound by smaller complexes. For example, the 3.5-kb enhancer of the Gata1 gene binds the entire complex (Fig. 2), whereas the regulatory sequence of the Cdh23 gene binds an Ldb1 complex without Eto2, while the Casp12 gene binds an Eto2 complex but not Ldb1. The list of binding sites contains many of the known target genes (Wilson et al. 2009), but also many more novel ones. In a number of cases, however, it is not clear what the target gene is that may be regulated by the Ldb1 complex;
in particular, in those situations where binding sites are found at a large distance from any gene (see below). Expression analysis to identify target genes Two experiments were carried out in order to identify genome-wide the target genes of the Ldb1 complex. First, the binding sites of the complex were also determined after differentiation of the cells, and the gene expression patterns were determined before and after differentiation. The cells used above were differentiated, and the binding sites of the factors were determined as above (http://tracc.genereg.net/ download). Strikingly, most binding sites were still binding the same complexes, but the ratio of binding of the different factors was changed. Most importantly, the number of binding sites and the peak height of the suppressor factors Eto2 and Mtgr1 decreased after differentiation relative to the other factors, indicating that the Ldb1 complex changes toward an activating state during differentiation.
GENES & DEVELOPMENT
279
Soler et al.
Figure 2. Differences in transcription factor complex composition at selected loci. The number of overlapping sequence reads originating from the different ChIP-seq experiments were plotted relative to chromosomal position using Solex (red bars). Signals obtained from the control ChIP-seq experiment are also shown (green bars). Chromosomal positions as well as sequence conservation (mammalian cons.) are indicated above and below ChIP-seq plots, respectively. The figure shows clustering of all five transcription factors at the Gata1 hematopoietic enhancer (left panel), Ldb1 complex without Eto2 at the Cdh23 locus (middle panel), and Eto2 complex without Ldb1 at the Casp12 gene promoter (right panel).
Figure 3 shows examples of the binding sites of a number of target genes before and after differentiation. All of these genes—Gypa (glycophorin A), Epb4.2 (Band 4.2), Alas2, and Slc22a4—are induced late during erythroid differentiation and show a difference in the ratio of the binding of the different components of the Ldb1 complex. In particular, the level of the negative regulators Eto2 and Mtgr1 (Davis et al. 2003) decreases during differentiation (Meier et al. 2006), whereas levels of Ldb1 and Tal1 increase, which is reflected in a change in the relative ratio of Eto2/Mtgr1 to Ldb1, or Tal1 binding to the regulatory sequences of these genes (Fig. 3E,F). This observation is supported by the genome-wide data analysis; at the same stringency threshold (empirical P-value), there is a significant drop in the Eto2- and Mtgr1-level content of Ldb1 complexes upon the induction of differentiation. We next determined the changes in gene expression pattern before and after differentiation by microarrays to allow the identification of target genes of the Ldb1 complex (Fig. 4; Supplemental Table 1; Supplemental Fig. 4). This showed that many genes in the different pathways— such as heme biosynthesis, cell cycle, apoptosis, and gas transport—that are active in terminal erythroid differentiation are target genes of the Ldb1 complex (e.g., see Supplemental Table 2). This suggests that the function of Eto2/Mtgr1 is to suppress target genes before differentiation. This is confirmed by knocking down Eto2, which shows that direct targets of the complex are derepressed in both MEL cells and primary erythroid cells (Supplemental Fig. 5) without differentiation of the cells.
matches the previously reported consensus WGATAR (Supplemental Fig. 6), and is much better-defined than, e.g., DNA SELEX-derived Gata1 profiles (e.g., MA0035 from JASPAR database) (Bryne et al. 2008). The Tal1binding sites give a different picture: While the published E-box motif consensus is CANNTG (Murre et al. 1991), our motif discovery on the bound sites using MEME (Bailey et al. 2009) revealed a preference for TG dinucleotide upstream of WGATAR, with a preferred consensus (C)TGN7–8WGATAR. Within the first 1284 top sites cooccupied by Gata1 and Tal1, 1045 (81%) show the presence of a TG dinucleotide 7–8 bases upstream of the WGATAR motif (TGN7–8WGATAR), among which 671 sites contain a C upstream of the TG (CTGN7–8WGATAR). The remaining 239 sites show an overrepresentation of E-box motif CWGCTG (with a positional overrepresentation on the 59 side of the GATA sequence) (Supplemental Fig. 6). The separation of Gata1-binding sequences into those that bind Tal1 and those that do not, followed by de novo motif discovery on each set, revealed that this upstream element is strongly overrepresented in Tal1positive sites only (Supplemental Fig. 6). The other surprising observation is that, often, more than one consensus binding site is observed at any given position. For example, one of the binding sites of the Epb4.2 (Band 4.2) gene shows a double site (Supplemental Fig. 7). Multiple sites may serve to increase the efficiency of complex recruitment and/or may allow simultaneous interactions with several distant sites.
Motif analysis of transcription factor-binding sites
Correlation of transcription factor-binding sites with gene expression and promoter type
It is clear that the top of any of the peaks of binding sites points directly at the recognition sequence of the binding site. This provides a consensus sequence of the binding sites as they are used in vivo. The Gata1 site strongly
The genes that were up-regulated or down-regulated were subsequently compared with the positions of experimentally detected binding sites to determine whether they are direct targets of the Ldb1 complex. Supplemental Figure 8
280
GENES & DEVELOPMENT
Ldb1 complexes in erythroid differentiation
Figure 3. Dynamics of the Ldb1 complex components during the course of erythroid differentiation. ChIP-seq data showing binding of Ldb1, Tal1, Gata1, Eto2, and Mtgr1 to the Gypa, Epb4.2, Alas2, and Slc22a4 genes. (A–D) Binding profiles before (uninduced) and after (induced) differentiation. (E) ChIP analysis on nontransfected MEL cells showing enrichments of endogenous factors before (uninduced) and after (induced) differentiation. Data are represented as mean 6 SEM. (F) Ratios of Ldb1 and Tal1 enrichments over Eto2 showing increases of Ldb1 and/or Tal1 after differentiation (ratios before differentiation are set to 1).
shows the example of the top 25 up-regulated or downregulated genes and the target binding sites of the complex within 100 kb of the transcription start site (TSS). It is clear that most of these up-regulated genes are direct targets of the complex (84% have at least one strong Ldb1 complex-binding site within 50 kb of the TSS). On the other hand, most of the 25 most strongly down-regulated
genes (72%) show no evidence of binding of the Ldb1/ Tal1/Gata1 complex, although there are exceptions (Supplemental Fig. 8). Including the top 50 up-regulated and down-regulated genes shows even more dramatic differences, with 96% of the up-regulated genes having binding of the complex versus only 20% for the down-regulated ones, with up-regulated ones typically sporting stronger
GENES & DEVELOPMENT
281
Soler et al.
binding and greater proximity to the TSS (data not shown). Further analysis of these data by separating the binding sites of all the genes that were significantly up-regulated or down-regulated (P < 0.001) showed that the strong
binding sites and the vast majority of binding sites of the Ldb1 complex are on up-regulated genes, but not downregulated genes (P = 0, x2 test) (Fig. 5A,B; Supplemental Fig. 8): Indeed, the significantly down-regulated genes are largely devoid of either Ldb1 or Tal1 binding. In contrast, Gata1 (which is also part of a number of repressive complexes) (Hong et al. 2005; Rodriguez et al. 2005) or a subcomplex of Gata1 with Ldb1 (lacking Tal1 and Eto2/Mtgr1) also shows frequent binding to the regulatory regions of repressed genes (Fig. 5B). Thus, the Ldb1 complexes can be subdivided into two main entities: an Ldb1/Gata1/Tal1/Eto2/Mtgr1-activating complex, and an Ldb1/Gata1 with both activating and repressing activities (Fig. 5B; Supplemental Fig. 8). The analysis also showed that the Ldb1 complex binds in different positions relative to the TSS of the gene, from the proximal promoter region to tens of kilobases away. In a number of recent studies, we and others investigated differences in responsiveness to long-range regulation between different classes of core promoters (Engstrom et al. 2007; Megraw et al. 2009). We therefore also asked the following questions: (1) Where are the binding sites located primarily relative to the TSS? (2) Are there any differences in their distribution between genes with different types of core promoters? Although there were strong complex-binding sites in ‘‘textbook positions’’ upstream of the gene, the highest frequency of sites was found to map to the first intron of genes (Fig. 5C). However, when we classified the corresponding promoters into the CpG and non-CpG classes, a striking difference emerged: The Ldb1 complex-binding sites in proximal promoters of regulatory genes were found almost exclusively in non-CpG island promoters (red bubbles in Fig. 5D; Supplemental Fig. 9). Non-CpG promoters show an overrepresentation of TATA boxes and are associated predominantly with specific expression in terminally differentiated tissues (Carninci et al. 2006). On the other hand, the up-regulated genes with CpG promoters (green bubbles in Fig. 5D) showed Ldb1 complex binding predominantly downstream from the promoter, most in their first intron (Fig. 5C,D; Supplemental Figs. 8, 9). CpG island promoters most often lack TATA boxes, and are associated with either housekeeping genes or developmentally regulated genes. In our recent study (Akalin et al. 2009), a subset of CpG island promoters was shown to be the type that is most responsive to long-range regulation. It is interesting, however, that many of the most up-regulated
Figure 4. Hierarchical clustering of normalized expression levels. The figure summarizes the average of normalized expression levels of gene-specific probes (annotated with the same gene name after normalization) of all samples under study. Genes that showed a significant difference (P-value of Student’s t-test, 150 kb away, but this is unlikely to be a target gene, as we could not detect up-regulation upon differentiation (data not shown). The closest gene that is up-regulated in the differentiated cells is Runx1 (log fold change 0.77; P = 0.005) situated 300 kb away from the binding sites. Interestingly, these binding sites are the only sites within 250 kb of DNA. Both sites have never
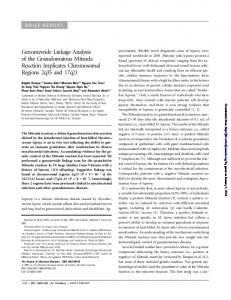
Figure 6. Binding sites in large intergenic regions. The top panel shows two binding sites at ;300 kb upstream of the Runx1 gene in a gene-poor region. The bottom panel shows two binding sites at ;210 kb from the Klf3 gene. The binding profiles of the different transcription factors in uninduced and induced MEL cells are shown.
284
GENES & DEVELOPMENT
Ldb1 complexes in erythroid differentiation
been mapped before as regulatory sites of the Runx1 gene, and both show a relative decrease of Eto2 and Mtgr1 consistent with up-regulation. The second example is similar: The site is several hundred kilobases away from the closest up-regulated gene, Klf3, whereas a number of other genes are much closer to the binding site. Klf3 is an antagonist of Klf1 activated by the same Klf1, a late erythroid activator that is required for the activation of many erythroid genes during the last steps of differentiation. Klf3 is a developmental regulatory gene that is itself regulated by long-range interactions in what is known a genomic regulatory block (GRB) (Kikuta et al. 2007). GRB target genes are often flanked by large intergenic regions spanned by highly conserved and other noncoding elements that act as long-range enhancers (Sandelin et al. 2004; Pennacchio et al. 2006; Kikuta et al. 2007). Other large intergenic regions with Ldb1 complex-binding sites are found around genes such as Ets2, Max, Mef2c, or Pim1, all known to be involved in the regulation of hematopoiesis. These and similar data for many other genes (data not shown) suggest that the Ldb1 complex is involved in longrange interactions. We therefore tested this possibility for chromosome 7 (see below), which has been analyzed previously by Chromosome Conformation Capture-onChip (4C) (Simonis et al. 2006).
Interactions between regulatory regions The Ldb1 complex is thought to be important for longrange interactions. It was clear from the ChIP-seq data that most binding sites of the Ldb1 complex were with up-regulated genes (see above), and that the data identified a number of regions that are thought to interact with each other. The best-documented example is the b-globin locus. The hypersensitive sites 1–4 (HS1–4) of the LCR of the b-globin locus all bind the Ldb1 complex before differentiation (Fig. 7), and the level of binding to HS2–4 increases upon differentiation when the b-globin gene is expressed at high levels. We therefore carried out a Chromosome Conformation Capture sequencing (3C-seq) experiment focusing on chromosome 7, using the b-globin gene (b-major promoter) as the viewpoint to determine whether binding sites of the Ldb1 complex would identify long-range interactions between genes and regulatory regions. In this experiment, 12.5-dpc fetal liver and fetal brain tissues were used, and interacting sequences were identified as HindIII fragments using Illumina paired-end sequencing. Peaks on a genomic location were considered to be fetal liver-specific when the 3C-seq read counts in the fetal brain samples were