Published in: Proceedings 9 th International Symposium on Spatial Data Handling 10-12 August 2000, Beijing, China Revised version for: 'Advances in GIS Research III: Towards Holistic Spatial Data Handling', Springer. The Impacts of Map-Oriented Internet Applications
The Impacts of Map-Oriented Internet Applications on Internet Clients, Map Servers and Spatial Database Systems Thomas Brinkhoff Institute of Applied Photogrammetry and Geoinformatics (IAPG) Fachhochschule Oldenburg/Ostfriesland/Wilhelmshaven (University of Applied Sciences)
[email protected]
1. INTRODUCTION In the last few years, the presentation of spatial data on Internet web sites has become increasingly popular. Because of their simplicity, static raster images are mostly used for the visualization of maps. However, the demand for more sophisticated maps is dramatically increasing by applications like electronic yellow pages, traffic information services, and touristy applications. The appearance of electronic market places will enforce this development. In order to fulfill the requirements of such applications, the presentation of spatial data must support features like the following ones: A sophisticated interaction with the user
The user should be able to interact with the map: operations like zooming and panning must be supported as well as the request of further information about a visualized spatial object. In addition, analysis operations like the computation of distances or shortest paths are often required. The adaptability of the maps
The user (or the application he or she is using) should be able to control the appearance and other properties of the map like the selection of the visualized components. This allows adapting the presentation of the map according to the profile of the user or according to special scenarios: e.g., different representations of the map may be used for visualizing the location of a shop for pedestrians and for car drivers.
1
Advances in GIS Research III : Towards Holistic Spatial Data Handling
Dynamic maps
The data presented on the map may change dynamically. A typical example for such an application is the visualization of the current traffic situation (Brinkhoff, 1999). Simple static raster maps cannot fulfill these requirements. Instead, architectures are required which consist in principle of the following components: The first building block is an (more or less) intelligent client program for processing the user requests and visualizing spatial data. This Internet client is executed on the top of a browser that handles the communication with the web site using the HTTP protocol. The functionality and characteristics of the client depend on the type of the application, of the profile of the user, or of the actual scenario. Second, a map server is used for handling the requests of the clients. In general, this map server is closely linked with an Internet server that handles the HTTP requests of the Internet browser. The map server is independent of the application. The last component is a database system storing spatial data and processing requests of the map server (spatial database system). The database management system is independent of the application but the database (i.e. the data model and the data) must be designed according to the requirements of the applications. Figure 1 depicts the building blocks of this architecture.
map server
Java applet
spatial dbs
HTML page(s)
Internet browser
client site
Internet Internet server
HTTP protocol base: TCP/IP
file system / dbs
server site Figure 1: Three-component architecture.
Many commercial solutions are already available, which allow building up such an architecture; examples are the ArcView Internet Map Server (ESRI, 1999a), ArcIMS 3 (ESRI, 1999b), Autodesk MapGuide (Autodesk, 2000), Intergraph GeoMedia Web Map
2
The Impacts of Map-Oriented Internet Applications (Intergraph 2001), and Smallworld Web (Smallworld, 2000). In distinct solutions, one of the components may miss, e.g. there exist completely HTML-based solutions where no special client program is required. In other cases, a component can be replaced by another system: instead of a spatial database system a geographical information system (GIS) is often used. The architectures of commercial solutions frequently use existing components in large extend in order to minimize the time and cost of development. Based on the experience of some recent Internet projects, important impacts of Internet applications on the three components of the described architecture are derived in the following. Starting point is the client because the requirements of the user should be the center of attention. It is assumed that experts are not the typical user of map-based Internet applications, but that occasional users are predominant. In section 2, we observe that the deployment of interactive or dynamic maps used by Internet applications suffers from several problems. Some solutions can be achieved by improving the client software (section 3) whereas the map server must be considered for other tasks and problems, which are discussed in section 4. The spatial database system is the final component for processing a user request. In section 5, the impacts of Internet applications on spatial database systems are described. The conclusions include a summary and an outlook to future work.
2. SHORTCOMINGS OF INTERNET APPLICATIONS After a short discussion of static raster maps, the typical behavior of Internet clients is presented in this section. 2.1 HTML Pages Depicting Static Raster Images The simplest technique to present spatial data on an Internet web site is to embed a raster image (typically a GIF file) into the HTML page by using the IMG tag (e.g.
). Some interaction with the user can be achieved by using the MAP tag. This tag allows us to define areas of the image where a text (defined by the ALT property) will be shown if the mouse cursor is moved into this area. Furthermore, another HTML page (defined by the HREF property) will be requested if the mouse button is clicked while the mouse cursor is being inside this area. Some further interaction may be achieved by computing the HTML pages on demand by using CGI scripts (CGI = Common Gateway Interface), Active Server Pages (ASP), or Java servlets on the server site.
3
Advances in GIS Research III : Towards Holistic Spatial Data Handling
The advantages of HTML pages with raster images are their simplicity, their low cost, and the ability of almost every web browser to visualize such web pages. However, the interaction with the user is very restricted; for implementing more demanding applications, this technique is not sufficient. 2.2 Working with Client-Server Applications In order to overcome the shortcomings of simple raster images, costlier solutions are required. These solutions are typically based on an architecture consisting of an Internet client, a map server and a spatial database system as it is described in section 1. Let us consider a typical course of a visit of a web site running a map-based Internet client. It is assumed that occasional users are the predominant users of map-based Internet applications. Such an occasional user often does not really know the content of the web site because she or he has found the web site by accident, e.g. using a search engine. Before anything starts, the client program (plug-in, applet, control) must be downloaded; it cannot be assumed that an occasional user has already installed the software. Such a program typically consists of several hundred kilobytes; during this time, the user has to wait. For example, the Autodesk MapGuide Viewer 5 (Autodesk, 2000) requires a download of about 2.2 Mbytes after announcing the name, the country, the “industry”, the “organization”, and the e-mail address of the user as well as the operating system and browser used. If the user is not careful, he or she will periodically receive e-mails by Autodesk in the future. After the download, the user must run a set-up program that also takes several minutes, requires stopping all running programs, and may conflict with user’s rights on the computer. The obvious problem is that the user still does not know whether the content of the map fulfils his or her expectations or not. Then, the download of the spatial data begins which also takes some time. The user is still waiting. After that the visualization starts and the user is able to decide, whether he or she is interested in this information at all. Working with the map means also to be patient because for each operation, data is requested from the server and an operation will not be finished until all data have been transmitted to the user’s browser. The response time will decrease in future by the introduction of Internet connections with a high bandwidth or by mobile telephone standards like UMTS. However, the introduction of such techniques
4
The Impacts of Map-Oriented Internet Applications requires large investments and a significant period before they can be used countrywide or worldwide. Furthermore, the availability of high-speed connections will surely increase the number of users and the transmitted data volume. Therefore, it is reasonable to assume that for a large portion of occasional Internet users or Internet users from lower-developed countries the scenario described above will not change considerably. We can summarize that the use of interactive maps is often not very pleasant for occasional users. There is high probability that he or she becomes frustrated by visiting such web sites and will not profit from the benefits of map-oriented Internet applications.
3. THE INTERNET CLIENT Considering the scenario of section 2, we can derive some important impacts on Internet clients, which are presented in this section. 3.1 The Use of Vector Data In order to improve the response time and the power of the client application, the use of vector data is essential. Solutions, where only raster images are supported, require long transmission times because the amount of data that must be transmitted is in general much larger than for vector data; examples where this statement holds can be found e.g. via (ESRI, 1999a). Furthermore, raster data miss knowledge about the map objects. Therefore, each user request must be executed by the server, which requires two data transmissions and a higher workload on the server. 3.2 Java The support of vector data requires an application running on the top of the Internet browser. Such applications are typically so-called plug-ins, Active-X controls, or Java applets. The assumption of an occasional Internet user requires to consider security aspects and to keep the efforts of the user low. The dependence of Active-X controls on the underlying operating system and security aspects restrict Active-X to Intranet applications (within a company or organization); this recommendation, e.g., is given for Smallworld Web (Smallworld, 2000). In order to install a plug-in, a set-up program must be run. These considerations restrict us - especially
5
Advances in GIS Research III : Towards Holistic Spatial Data Handling
for occasional users - to Java applets, which can be executed by almost every web browser. Also performance issues are not longer a problem (Zaunseder, 1998); the use of just-in-time compilers helps to increase the performance of Java. A future solution may be the use of SVG (Simple Vector Graphics) (WWW Consortium, 2000). 3.3 Customized Class Bundling In order to decrease the time for downloading the client program, one approach is to reduce its size. However, by decreasing the size of the program its functionality is also reduced. The dynamic classloading feature of Java helps to overcome this problem: a Java class file is only downloaded on demand and at the latest moment possible (lazy loading) (Gong, 1998). However, loading many small Java class files also increases the complete transmission time. This effect results from the fact that the time for a transmission consists of the time for the transmission of the request, of the time that the Internet server needs for dealing with the request, and the time for transferring the class file. Whereas the last portion depends on the length of the file (i.e. the number of packets which must be transmitted), the two others are constant (besides of variations of the transmission speed which depends on the traffic in the network). Therefore, it is reasonable to bundle (and compress) several Java class files in so-called Java archive files (JAR files). Typically, the complete applet is bundled by one JAR file or each JAR file bundles related Java classes (so-called packages). In order to reduce the (subjective) response time, it is important to customize the bundling strategy: only those class files should be bundled in the first JAR file that are required for loading and visualizing (important) map data. These functionalities allow the user a first decision whether he or she is interested in the map. In the next step, the user requires the basic functionality of interaction for verifying his or her assessment. Therefore, the classes bundled in the second JAR file should support operations like zooming, panning, and the retrieval of basic object properties. More sophisticated functionality (e.g. the dynamic update of map objects or routing features) and special visualization methods (e.g. the support of alternative presentations) should be shifted to further bundles, which are loaded on demand or triggered by timers. 3.4 Splitting the Loading and Visualization Threads In a single-threaded application, the applet downloads map data from the server site in a first step and visualizes these data in a
6
The Impacts of Map-Oriented Internet Applications second step. This means to the user to wait for the first response until the (first) map data are completely downloaded. This is of course not very stimulating. Therefore, a combined loading and visualization is required. This can be achieved by splitting the loading and the visualization task in two different (light-weighted) processes (so-called threads): the loading thread and the visualization thread. As soon as it is reasonable, the visualization thread displays the objects read by the loading thread starting with the most important objects. This allows the user to perceive an ongoing progress and he or she may be able to decide whether the map fulfils his or her expectations. Furthermore, the user should be able to navigate through the map before the loading process has finished. This demand is motivated by the fact that even few depicted map objects may sufficient for the user to orientate and to change or restrict the map window to the area he or she is interested in. 3.5 Definition of the Order of Significance In the paragraph above, it is demanded that “the most important” objects are visualized first. A continuous loading and visualization process requires that the map objects be transmitted according to an order of significance. Thus, (1) the significance of objects must be defined or derived in respect to orientation and decision purposes and (2) the objects must be ordered by this significance. For a city map, this requirement means to order the objects in a manner like in the following example: 1. the coastlines, 2. important cities evenly distributed over the map window, 3. international boundaries, 4. missing large and middle-sized cities, 5. internal boundaries and large rivers, 6. missing small-sized cities, 7. other topological features like missing river and mountains. The definition of the significance is task of the client application. Thus, the ordering may differ between different applications (or different user profiles or scenarios) using the same map server and the same spatial database system. If a land use map should be visualized by a client application, the order of significance will surely differ from the list above. In contrast to the definition of
7
Advances in GIS Research III : Towards Holistic Spatial Data Handling
significance, the ordering itself must be obviously performed by the map server or the spatial database system (see section 4.2). 3.6 Overlapping Scale Levels Even using vector data, it is not possible to use the same object representation (and also the same set of objects) for all scales required by the client application; the object representation and selection of objects depend on the actual scale. The range of scales where the same objects and object representation are visualized is called scale level in the following. Table 1 depicts the properties of the objects assigned to different scale levels by a map-based home office application (Rossipaul, 1996). The figures show that the scale levels strongly differ in their storage requirements and the number of affiliated objects. scale level
data volume
1 : 50,000,000 – 1 : 150,000,000 1 : 20,000,000 – 1 : 50,000,000 1 : 10,000,000 – 1 : 20,000,000 1 : 3,000,000 – 1 : 10,000,000 1 : 1,000,000 – 1 : 3,000,000 1 : 300,000 – 1 : 1,000,000
0.1 % 0.8 % 1.6 % 6.3 % 15.5 % 75.6 %
# polygons (in thousands) 1.3 18.7 35.4 91.0 209.1 550.9
# lines (in thousands) 0 0.2 0.4 14.6 19.6 328.2
Table 1: Properties of the scale levels of an example database.
A critical phase is the change between two scale levels by performing a zoom operation. The reason is that the objects or object representations of the new scale level must be mostly requested from the map server. Before receiving the objects, nothing happens which is a frustrating situation for the user. To transmit always all object representations of a requested object is no solution because this would unnecessarily increase the amount of transmitted data and would make the situation worse at the time when an object is requested first. In order to avoid this situation, overlapping scale levels can be used: instead of waiting for the objects or object representations of the correct scale level, the known objects of the former scale level are depicted first. This can be done for vector data as well as for raster data. In this case, the quality of the visualization is of course worse compared to the correct scale level but this is in general better for the user than waiting or seeing nothing. After this first
8
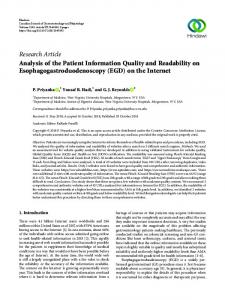
The Impacts of Map-Oriented Internet Applications visualization, the objects and / or object representations of the new scale level are requested by the loading thread and visualized on the fly by the visualization thread. The replacement of objects of the wrong visualization level is a little bit tricky. If there is a one-to-one or one-to-many relationship between the objects or object representations of the involved scale levels, the visualization of an object could be replaced as soon as all corresponding object(s) or object representation(s) are transmitted. In the other case, we have to distinguish between areas and non-area objects. In the first case, we achieve the desired effect by drawing the areas of the less detailed scale level before the areas of the more detailed level. If the double-buffering technique is applied for displaying the map, the user will not perceive the areas of the less detailed scale level. For non-area objects, however, we cannot replace them until all lines or points of the actual window have been transmitted from the server. The use of the overlapping-scale-levels technique may require to reduce the ability of the user to change the scale by arbitrary factors in order to avoid large differences between the involved scales: the more the zooming factor is restricted, the better is the visualization of objects of the wrong scale level. 3.7 Look-ahead Fetching In order to reduce waiting periods of the user, while he or she is working with the client application, it can be reasonable that the client automatically requests data from the server, which the user may require next. Typical user operations are to pan around the current map window and to zoom in. Because the use of overlapping scale levels supports the zoom-in operation, it is reasonable to restrict the discussion to the objects around the current map window. Loading these objects before they are required is called look-ahead fetching in the following. Similar techniques can also be found in a traditional GIS, but in that case, the reduction of transmitted data is less important. The query region used by the look-ahead fetching depends on the windows, which have been loaded and depicted before on the current scale level. Figure 2 shows an example. The query region is constructed from two regions: the first region (A) consists of the areas around the current map window; the second region (B) is the union of the regions requested before. The objects required for the look-ahead fetching are the objects intersected by A but not intersected by B. In the example, the objects x and z should not be
9
Advances in GIS Research III : Towards Holistic Spatial Data Handling
transferred to the client, but object y. Further impacts of the lookahead fetching are discussed in section 4.3 because the computation of the objects to be transmitted can be done best by the map server.
areas requested before union = region B
actually requested region = region A x
y example objects z sequence of the centers of the map windows
Figure 2: Example of the look-ahead fetching.
3.8 The Support of Dynamic Data The data presented on the map may change dynamically. A typical example for such an application is the visualization of the actual traffic situation (Brinkhoff, 1999). In order to support such applications, it is necessary to replace obsolete spatial objects in the map by new objects or to move their position. The technique presented in the overlapping-scale-levels section can also be applied in order to support dynamically changing data. In many cases two data sets must be updated: the map and a corresponding alphanumeric description of the dynamic object, e.g. on an HTML page. 3.9 Routing Another important feature is the support of routing operations. The use of Java and vector data allows in principle a client-based routing. However, the amount of data required to compute, e.g., the shortest path to a destination suggests leaving the routing functionality at the server or at least to transmit the code and data only on user’s demand. Furthermore, the time to build up suitable data structures supporting the computation of shortest paths is not
10
The Impacts of Map-Oriented Internet Applications negligible. Therefore, the computer running the client application requires considerable computing power in the case where the routing functionality is located at the client.
4. THE MAP SERVER The map server handles the requests of the Internet clients. Typically, the map server receives the requests of the client applications via an Internet browser on the client site and an Internet server on the server site. The Internet server handles the HTTP requests of the Internet browser. A request of a client usually triggers one or more queries to be performed by a spatial database system or by a comparable system. The query results of the database system are processed first by the map server and then transmitted to the client application. Considering the client-server paradigm, one important requirement is to reduce the processing costs on the server computer by shifting functionality to the clients. This goal can be achieved by using Java applets (or similar techniques) as presented in section 3.2. However, many state-of-the-art map servers do not fulfill this requirement. For example, they compute raster images from vector data on the server site and transfer them to the clients like (ESRI, 1999a). Such an approach leads to a high load on the server site. In the following, we discuss the impacts of the requirements of an Internet application on the operations, which have to be handled by the map server. 4.1 Coordinate Transformations In order to increase the performance of the clients and to decrease transmission times, it is reasonable that the client works with another coordinate system than the systems on the server site. The basic data type for coordinates used by the database system or by a GIS is generally not suitable for clients. In Oracle Spatial (1999), for example, the coordinates are stored as floating-point numbers. However, for increasing the performance of the client it is better to use integer numbers, see (Zaunseder, 1998). Often, the client does not need the whole data space because the client is restricted to a special part of the database, e.g. a predefined country. In this case, it is reasonable to transform the coordinates in order to reduce their absolute values and as result their space requirements.
11
Advances in GIS Research III : Towards Holistic Spatial Data Handling
The transmission of relative coordinates (especially of polygons and lines) allows also reducing the amount of transmitted data. Therefore, it is necessary to transform the coordinates by the map server before they are transmitted to the client. For establishing such a coordinate transformation, the client has to announce the (maximum) size of a visualized map (in pixels) and the extent of the data space that the client is interested in. The map server must announce the transformation function to the client in order to support the computation of the original coordinates by the client that may be required for special operations and as feedback to the user. Furthermore, the map server must be able to transform query parameters, which the server gets from the client, into the coordinate system of the database. 4.2 Support of Multiple Sorting Rules In section 3.5, it is demanded that the map objects are transmitted according to an order of significance. The significance of the objects depends on the client. However, the ordering must be done before the objects are transmitted, i.e. on the server site. Therefore, the client must announce the significance rules to the map server. Then, the map server can arrange sorting the query results according to their significance. The sorting can be done either by the map server itself or by passing the significance rules to the database system. However, the second option is problematic because flexible sorting rules means to perform an additional join operation, which significantly reduces the performance of the database system. 4.3 Look-ahead Fetching In section 3.7, the look-ahead-fetching technique was proposed. The query region used by this technique depends on the region, which should be read in advance (= region A), and on the map windows loaded before (= region B). The resulting query region has often a complex shape because region A as well as region B themselves consist of several components (see the example in figure 2). The result set QR of the query is defined as follows: QR = { obj | (obj.geometry ∩ A) ∧ ¬ (obj.geometry ∩ B) } Because region B is generally much larger than region A and because region B excludes objects, it is not reasonable to compute
12
The Impacts of Map-Oriented Internet Applications this condition by the database system. Instead, a simplified query retrieving the following objects can be used: Q’R = { obj | (obj.geometry ∩ (A \ B) } Q’R is a superset of QR. In the example of figure 2, object z belongs to Q’R but not to QR. In order to reduce the amount of data transferred to the client, the map server has to determine objects like object z in a so-called refinement step to remove them from the result set. Principal techniques for performing the refinement step for Internet applications are presented in section 5.1.
5. THE SPATIAL DATABASE SYSTEM The last component of the architecture presented in section 1 is the spatial database system. Instead of spatial database systems also geographical information systems (GIS) or special geo-servers (Friebe, 1999; DeWitt et al, 1994; Brinkhoff et al, 1994b) can be used for storing and retrieving spatial data. These systems may use a spatial and/or a relational database system. In order to design a spatial database system, which handles queries from Internet applications efficiently, we have to consider the queries required by the applications and to discuss their impacts on the database system. A query restricts the data space by its query conditions. A spatial query consists at least of one spatial condition. Point queries that retrieve the objects containing a given query point and window queries that determine all objects intersecting a query rectangle are typical examples for such queries. Another characteristic property is the differentiation of a filter and a refinement step (Orenstein, 1989): the filter step determines a superset of candidate objects may fulfilling the query condition(s) whereas the refinement step computes the exact query result using the set of candidates; the candidates not fulfilling the exact query condition are called false hits. Examples for the use of a filter and a refinement step are the multi-step processing of spatial joins (Brinkhoff et al, 1994a) and the two-step look-ahead fetching approach presented in section 4.3. Commercial spatial database systems also follow this paradigm, e.g. Oracle (1999). In the most cases, the formulation of a query determines whether the refinement step should be executed or not.
13
Advances in GIS Research III : Towards Holistic Spatial Data Handling
5.1 The Management of False Hits and Duplicates Let us first consider a conventional environment where the client application is connected to the spatial database system via a local area network (LAN). In this case, the refinement step can be omitted for visualizing maps – which is the most frequently cause of spatial queries – because the set of candidates is not generally much larger than the exact query result (if no further query conditions must be observed). The overhead for determining the objects not fulfilling the window query may be larger than the cost for their transmission to the client. Clipping algorithms, which are part of the window system used by the client application, do a refinement in any case. For the case of Internet applications, the situation is different: we have to reduce the amount of transmitted data. Therefore, the refinement step has to be performed before the data reach the client. Especially, the repeated transfer of an object must be avoided. Such a repeated transmission may happen, for example, by using the lookahead-fetching approach presented in section 4.3. In principle, we can distinguish two techniques for performing such a refinement step. In the first approach, the refinement step excludes the false hits from the set of candidates by evaluating the geometric query condition. In the case of complex query conditions and / or of complex shapes of the involved geometries, this approach is rather time-consuming and complicates the design of the system. The other technique is to use hash tables storing the identifiers of the objects transferred to the client application during a session. This approach is simple to implement, but requires storing the identifiers of the objects requested during a session. A disadvantage is that this method needs connections storing their actual state, which requires a higher overhead than stateless connections that are typically used. The storage can be done persistently by the database system or main-memory based (e.g. by the map server). The first alternative is robust but needs expensive insert and delete operations whereas the main-memory approach is fast but space consuming; the required main memory depends on the number of objects requested during a session and the number of parallel sessions. 5.2 Support of Scale Levels A lot work has been done in order to investigate techniques and data structures supporting spatial query conditions. This work was motivated (1) by the fact that such query conditions are difficult to execute by a standard database system and (2) by the high selectivity
14
The Impacts of Map-Oriented Internet Applications of such queries which is a necessary condition that such techniques are worthwhile. The first fact holds also for Internet applications, however, the second reason should be considered in more detail for such applications. In section 3.6, the technique of overlapping scale levels was introduced. In this case, not only the query window restricts the data space significantly but also the scale level does. However, there has not much work done in supporting the scale dimension by indexing. One of latest publications in this field (Hörhammer and Freeston, 1999) demonstrates that huge performance improvements are possible by indexing the scale dimension. If all objects of a database are divided into the same scale levels, the introduction of a scale dimension into the index structure may be sufficient. However, it is often reasonable to define the scale levels for each object class independently because the object classes differ how they were investigated or how they should be visualized. Furthermore, the assignment of object representations to scale levels may depend on the applications and cannot be determined in the same manner for all cases. Therefore, the treatment of scale levels needs a further investigation. Let us first discuss the introduction of individual scale levels. In this case, there exist an individual minimum and maximum scale describing the range where an object is visible. This scale interval is a property of the object class or even of individual objects. The second alternative allows us to handle the frequent situation where the visibility of an object depends on special characteristics of the object or its neighborhood. An example is the visibility of a city in a city map, which should depend on its number of inhabitants as well as on the (non-) existence of larger cities in the neighborhood of the city. If we assume static scale intervals, a spatial database system could manage them by introducing a third dimension. However, it is not reasonable to assume that the same scale intervals hold for all types of applications. If a map of land use is derived from the same database as a map depicting the cities of a country, the number of depicted cities will differ in the maps at the same scale. That means the scale intervals are application-dependent and that the introduction of a single scale dimension into the index is not sufficient for an efficient access to the objects requested by Internet applications.
15
Advances in GIS Research III : Towards Holistic Spatial Data Handling
6. CONCLUSIONS Based on the experience with some recent Internet projects, the impacts of map-based Internet applications on an architecture consisting of an Internet client for processing the user requests and visualizing the map data, of a map server for handling the requests of the clients, and of a spatial database system have been presented. Especially for the Internet client, it is important to mention that the requirements of an occasional user were the center of attention. We observed that the deployment of interactive or dynamic maps presented on the Internet suffers from several problems. In order to overcome these shortcomings, several techniques were presented: a customized class bundling, the splitting of loading and visualization thread, an application-based definition of the order of significance, the use of overlapping scale levels, and the introduction of the lookahead-fetching technique. These techniques and other requirements, which are essential for using advanced maps in the Internet, have also impacts on the server site where the map server and the spatial database system are working. Those impacts were discussed in the sections 4 and 5. The most important impacts are: the support of multiple sorting rules, an advanced management of false hits and duplicates, and the support of scale levels. Especially, for the support of scale levels many questions are still open. The efficient management of individual, applicationdependent scale intervals needs a further investigation. This statement is reinforced by the fact that huge performance improvements are possible with a suitable support of scales. Both solutions presented for the filtering of duplicates have still drawbacks. Overall, simple and efficient mechanisms are required in order to reduce redundant transmissions from the map server to the client application via the Internet. Another more and more important topic will be the impact of XML-based representations like GML and SVG (Brinkhoff and Weitkämper, 2001). REFERENCES Autodesk Inc. (2000). "Autodesk MapGuide", http://www.autodesk.com/products/mapguide/index.htm Brinkhoff, T. (1999). “Requirements of Traffic Telematics to Spatial Databases”, Proceedings 6th International Symposium on Large Spatial Databases, 1999, Hong Kong, China, in: Lecture Notes in Computer Science, Vol.1651, Springer, 365-369. Brinkhoff, T., Kriegel, H.-P., Schneider, R. and Seeger, B. (1994a). “Multi-Step Processing of Spatial Joins”, Proceedings ACM SIGMOD International Conference on Management of Data, 1994, Minneapolis, Minnesota, 209-220.
16
The Impacts of Map-Oriented Internet Applications Brinkhoff, T., Kriegel, H.-P., Schneider, R. and Seeger, B. (1994b). “GENESYS: A System for Efficient Spatial Query Processing”, Proceedings ACM SIGMOD International Conference on Management of Data, 1994, Minneapolis, Minnesota, 519. Brinkhoff, T. and Weitkämper, J. (2001). „Eine Architektur zur XML-basierten Repräsentation von bewegten Geo-Objekten“, Proceedings GI-Fachtagung Datenbanksysteme in Büro, Technik und Wissenschaft, 2001, Oldenburg, Germany, in: Informatik aktuell, Springer. DeWitt, D.J., Kabra, N., Luo, J., Patel, J.M., and Yu, J.-B. (1994). "Client-Server Paradise", Proceedings 20th International Conference of Very Large Data Bases, 1994, Santiago, Chile, 558-569. ESRI Inc. (1999a). "ArcView Internet Map Server", Nov. 1999, http://www.esri.com/software/arcview/extensions/imsext.html ESRI Inc. (1999b). "ArcIMS 3 Features Powerful Application Services Architecture", July 1999, http://www.esri.com/news/arcnews/summer99articles/02-arcimsv30.html Friebe J. (1999). “Eine GeoServer-Architektur zur Nutzung von GIS-Funktionalität über Internet-Technologie”, Proceedings GI-Fachtagung Datenbanksysteme in Büro, Technik und Wissenschaft, 1999, Freiburg, Germany, in: Informatik aktuell, Springer, 164-184. Gong, L. (1998): "JavaTM Security Architecture (JDK1.2)", http://java.sun.com/ products/jdk/1.2/docs/guide/security/spec/security-spec.doc.html Hörhammer, M. and Freeston, M. (1999). “Spatial Indexing with a Scale Dimension”, Proceedings 6th International Symposium on Large Spatial Databases, 1999, Hong Kong, China, in: Lecture Notes in Computer Science, Vol. 1651, Springer, 52-71. Intergraph Corp. (2001). "GeoMedia Web Map", 2001, http://www.intergraph.com/gis/gmwm/ Oracle Corp. (1999). Oracle8i Spatial User's Guide and Reference, Release 8.1.5. Orenstein, J.A. (1989). “Redundancy in Spatial Databases”, Proceedings ACM SIGMOD International Conference on Management of Data, 1989, Portland, Oregon, 294-305. Rossipaul Medien GmbH (1996). “Der große Weltatlas – Unsere Erde multimedial (CD-ROM Edition)”. Smallworld Systems GmbH (2000). "Smallworld Web", 2000, http://www.smallworld.de/Prospekte/produkte/Web.zip WWW Consortium (2000). "Scalable Vector Graphics (SVG) 1.0 Specification, W3C Candidate Recommendation", Aug. 2000, http://www.w3.org/TR/2000/CR-SVG-20000802/ Zaunseder, S. (1998). “Plattformübergreifend – Machbarkeitsstudie zum Einsatz von Java im GIS-Bereich”, GeoBIT 7/98, Hüthig, 32-35.
17