The Importance of the COBIT Framework IT Processes For Effective Internal Control over the Reliability of Financial Reporting: An International Survey
David S. Kerr University of North Carolina at Charlotte 9201 University City Boulevard Charlotte, NC 28223-0001 Voice: 704-687-4875 Email:
[email protected]
Uday S. Murthy University of South Florida 4202 E. Fowler Ave. BSN3403 Tampa, FL 33620-5500 Voice: 813-974-6523 Email:
[email protected]
To be presented at 2007 University of Waterloo Symposium on Information Systems Assurance October 11-13, 2007
Acknowledgments: We sincerely thank Tom Lamm and Linda Wogelius in the Chicago headquarters of the Information Systems Audit & Control Association (ISACA) for their assistance with this study. We also gratefully acknowledge the assistance of local ISACA chapter presidents in publicizing our survey with their members. We thank Mohammad Gomaa for his excellent Web programming assistance.
The Importance of the COBIT Framework IT Processes For Effective Internal Control over the Reliability of Financial Reporting: An International Survey ABSTRACT This paper presents the results of an international survey of IT professionals exploring the relationships between COBIT’s 34 IT control and security processes and the reliability of financial reporting. One hundred and eighty nine relatively experienced IT professionals responded to the Web-based survey. The respondents, who were on average familiar with COBIT, rated the importance of each of the 34 IT processes from the viewpoint of maintaining effective internal control over the reliability of financial reporting. Respondents also indicated what they felt were the “key” or most important IT processes from the viewpoint of effective internal control over the reliability of financial reporting. Results revealed that five COBIT processes were deemed particularly critical for maintaining effective internal control over the reliability of financial reporting: ensure system security (DS5), manage changes (AI6), assess risk (PO9), assess internal control adequacy (M2), and manage data (DS11). Factor analysis was employed to ascertain logical groupings of related IT processes. We also find interesting patterns of differences in the extent of respondents’ work involving the reviewing and evaluation of IT controls as a function of the respondent’s employment type and country. This large scale survey of IT professionals sheds interesting light on the relevance of the most widely used IT governance framework, i.e., COBIT, specifically from the perspective of effective internal control over the reliability of financial reporting. Key words: COBIT, IT auditing, survey, financial reporting, internal control.
INTRODUCTION Recent events affecting the accounting profession, including accounting scandals in numerous public corporations and the subsequent creation of the Public Company Accounting Oversight Board, have resulted in increased attention to the importance of effective systems of internal control to enhance the reliability of financial reporting. Although public companies in the United States have been required to maintain effective internal controls since the Foreign Corrupt Practices Act of 1977, the term internal control often has different meanings for different people. Many people view an internal control as any policy or action that prevents a loss (Green, 2004), while others think of internal control as a broader concept covering multiple objectives. What constitutes effective internal control is even less clear, and often differs by the type of organization (e.g., service, retail, manufacturing) and even across organizations in the same industry. In today’s business environment, organizations rely heavily on information technology (IT) in their systems of internal control and to improve business performance. With the opportunities provided by revolutionary applications of IT, however, come many risks. Successful organizations in the 21st century must be able to manage these risks while utilizing the full capabilities of IT. Optimal methods of managing IT risks are prescribed in the “Control Objectives for Information and Related Technology” (COBIT) framework, released by the IT Governance Institute of the Information Systems Audit & Control Association. The COBIT framework describes 34 specific IT control and security processes that organizations can use to enhance the organization’s ability to achieve its business goals and to improve internal control. Conformance to these “best practices” should theoretically result in a lowering of the risk associated with IT, including enhanced accuracy and reliability of information.
1
Just as the COSO1 framework recognizes that some controls are more essential than others within the context of the effectiveness of the overall internal control system, some of the IT processes specified by the COBIT framework are likely to be more significant than others in achieving reliable financial reporting (Ramos 2006). However, while much has been written in the professional and academic accounting literatures on the importance of internal control, there is a paucity of research on the effects of information technology on internal control in general and the role of COBIT’s IT control and security processes in particular (IT Governance Institute, 2006). Information regarding the relative importance of each of the 34 IT control and security processes described in the COBIT framework, in the context of improving the reliability of financial information and reporting, should be of immense interest to Chief Information Officers (CIOs) in large organizations who are often charged with the responsibility for IT governance. Additionally, such information should be of interest to corporate Chief Financial Officers (CFOs) and Chief Executive Officers (CEOs), as their responsibilities in today’s business environment now include the implementation and maintenance of effective internal control as well as the reliability and timeliness of financial reporting. This paper presents the results of an international survey of IT professionals2 in which we explore some potential relationships between COBIT’s 34 IT control and security processes and the reliability of financial reporting. The objectives of this study are twofold. First, we investigate IT professionals’ ratings of the importance of each of the 34 IT processes in 1
Committee of Sponsoring Organizations of the Treadway Commission.
2
The vast majority of the IT professionals who responded to the survey are IT auditors. However, many are employed in various capacities within organizations and are involved with reviewing and/or evaluating IT controls although they are not formally designated as “IT auditors.” Consequently, for consistency, we use the term “IT professionals” to refer to the survey respondents throughout the paper.
2
maintaining effective internal control over the reliability of financial reporting. We also elicit IT professionals’ opinions regarding the “key” or most important IT processes from the viewpoint of effective internal control over the reliability of financial reporting. Employing factor analysis, we investigate whether the 34 IT processes fall into natural groupings based on how similarly they are rated across respondents. Second, we examine the extent to which IT professionals’ ratings of the importance of the 34 COBIT IT processes differ by employment type, experience, geographic location, and extent of familiarity with COBIT. The results revealed that of the 34 COBIT processes five stood out as being particularly important for maintaining effective internal control over the reliability of financial reporting. The five most critical processes per the survey results are Ensure System Security (DS5), Manage Changes (AI6), Assess Risk (PO9), Assess Internal Control Adequacy (M2), and Manage Data (DS11). Factor analysis results suggested that the 34 IT processes could be logically grouped into six factors. Of the six factors, however, only one was rated significantly different as a function of the respondent’s country or employment type. The “technology processes” factor was rated significantly higher in importance by respondents in North America and by those employed in public accounting. It was also found that the more experienced respondents were more familiar with COBIT. Also of interest is the finding that respondents from North America and those in public accounting spend a significantly greater percentage of their work hours reviewing and evaluating IT controls than respondents in other countries or in other types of employment. The remainder of the paper is organized as follows. In the next section we discuss some background information and literature pertinent to the study and also presents the research questions. Next, the research method employed to explore the research questions is discussed.
3
The results are then presented along with a discussion of the findings. The final section summarizes the paper and concludes. BACKGROUND AND RESEARCH QUESTIONS Most organizations, including virtually all large public companies, have implemented within the organization a formal system of internal control. Section 404 of the Sarbanes-Oxley Act (the Act) of 2002 requires management of public companies in the U.S. to evaluate the design and test the effectiveness of their internal controls over financial reporting and provide a report, signed by the CEO and CFO, attesting to the effectiveness of those controls as of the end of each fiscal year. SEC rules related to compliance with Section 404 of the Act provide the following definition of internal control over financial reporting: “A process designed by, or under the supervision of, the registrant’s principal executive and principal financial officers, or persons performing similar functions, and effected by the registrant’s board of directors, management and other personnel, to provide reasonable assurance regarding the reliability of financial reporting and the preparation of financial statements for external purposes in accordance with generally accepted accounting principles and includes those policies and procedures that: (1) Pertain to the maintenance of records that in reasonable detail accurately and fairly reflect the transactions and dispositions of the assets of the registrant; and (2) Provide reasonable assurance that transactions are recorded as necessary to permit preparation of financial statements in accordance with generally accepted accounting principles, and that receipts and expenditures of the registrant are being made only in accordance with authorizations of management and directors of the registrant; and (3) Provide reasonable assurance regarding prevention or timely detection of unauthorized acquisition, use or disposition of the registrant’s assets that could have a material effect on the financial statements.” (U.S. Securities and Exchange Commission, 2003) Soon after the passage of the Sarbanes-Oxley Act, the Public Company Accounting Oversight Board (PCAOB) was formed and subsequently issued Auditing Standard No. 2, An Audit of Internal Control Over Financial Reporting Performed in Conjunction With an Audit of Financial Statements. This standard requires external auditors of public companies to perform
4
their own evaluation of their client’s internal controls over financial reporting and issue a report in which the auditor expresses both (1) an opinion as to whether management’s assessment of the effectiveness of internal control is fairly stated and (2) an opinion on the company’s internal control over financial reporting based on his or her audit. To date, the SEC has provided very little specific guidance as to how management’s evaluation and testing of controls are to be performed and has not mandated the use of any particular process of evaluating the effectiveness of controls. The methods used by management to evaluate controls vary across companies, depending on the nature of the company and the controls being evaluated. However, to provide some degree of comparability of internal control reports across companies, SEC rules related to the implementation of Section 404 of the Act require management to use a “suitable evaluation framework” in its evaluation of controls over financial reporting (U.S. Securities and Exchange Commission, 2003). Although several possible frameworks exist, the SEC has not mandated the use of any one particular framework. As an example of a suitable framework, SEC rules refer to the Internal Control— Integrated Framework published by the Committee of Sponsoring Organizations of the Treadway Commission (COSO) in 1992. The COSO framework is currently the most widely used system for structuring management’s evaluation of the design and tests of internal controls over financial reporting (Anand 2006). This framework identifies five components of internal control—the control environment, risk assessment by management, control activities, information and communication, and monitoring of controls—which are intended to provide reasonable assurance of achieving the following three objectives: reliable financial reporting, effective and efficient operations, and compliance with applicable laws and regulations. Thus, the COSO framework’s concept of internal control is broader than that of the SEC, as the former
5
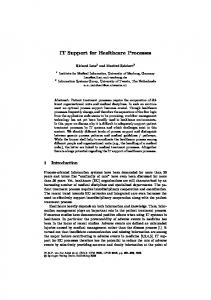
encompasses not only elements related to reliable financial reporting but also includes elements related to the effectiveness and efficiency of a company’s operations and the company’s compliance with laws and regulations. Another system widely used in management’s evaluation of internal control is the Control Objectives for Information and Related Technology (COBIT) framework published by the Information Systems Audit and Control Association (ISACA) (Guldentops and De Haes, 2002). The COBIT framework is used by managers, internal auditors, and external auditors in the context of evaluating IT control systems. COBIT defines internal control as “… the policies, procedures, practices and organizational structures designed to provide reasonable assurance that business objectives will be achieved and undesired events will be prevented or detected and corrected.” The COSO and COBIT frameworks are similar in that they both emphasize the role of control in enabling the company to achieve certain business objectives and manage the company’s risks. However, the focus of the COBIT framework is on the management and control of IT. The framework specifies 34 key IT control and security processes (activities and risks) that must be managed for effective IT governance. As illustrated in Figure 1, the 34 IT processes are grouped into the following four domains (areas of responsibility within IT): Plan and Organize (plan), Acquire and Implement (build), Deliver and Support (run), and Monitor and Evaluate (monitor). [INSERT FIGURE 1 HERE] The first domain—Plan and Organize—deals with identifying strategies and tactics for acquiring and delivering IT solutions that facilitate achievement of business objectives. The Acquire and Implement domain includes the identification and development (or acquisition) of
6
IT solutions and their integration into the company’s business processes. The Deliver and Support domain includes the actual delivery of IT services, including user support, data security and backup, and IT facilities management. Finally, the Monitor and Evaluate domain deals with assessing over time whether IT performance is adequate and in compliance with control requirements (Ramos, 2006; IT Governance Institute, 2007). To what extent has COBIT been adopted by companies? What are the reasons why companies adopt COBIT and what are the ways in which COBIT is being used? Where geographically in the world is COBIT being used and what is the profile of the typical company adopting COBIT? Published data representing answers to these questions are scant. Usage surveys have been conducted by ISACA/ITGI, but only very aggregated data have been reported in the literature. Most recently, Guldentops and De Haes (2002) reported summary statistics from a COBIT usage survey conducted in May 2002. Data from 182 respondents yielded the following insights: (1) almost half of the respondents were from the Americas, (2) the vast majority of respondents were in organizations with over a thousand employees with almost a third of respondents in organizations having more than 10,000 employees, (3) while close to 90% of responding organizations used COBIT, other control methodologies such as COSO, ISO 9000, and COCO were also being used, albeit in fewer organizations, (4) COBIT was used mainly for audit planning and audit program development, to validate current IT controls, to evaluate IT risks, to reduce IT risks, and as a framework for improving IT, and (5) a little over 40% of respondents indicated that their control framework and audit process was partly COBIT-based while less than 5% of respondents indicated that COBIT had been formally adopted and was enforced as corporate policy.
7
Although aggregated data from the COBIT usage surveys are informative, what is missing in the literature is information about the utility of COBIT from the perspective of the reliability of financial reporting. Given regulatory requirements (e.g., Sarbanes-Oxley) and the increased emphasis on internal controls, it is critical to understand the extent to which widely adopted IT governance frameworks such as COBIT contribute to the reliability of financial reporting. In this paper, we address this gap in the literature by focusing specifically on how the 34 IT control and security processes in the four COBIT domains impact the reliability of financial reporting. We pose the following research questions: RQ1: In the context of the reliability of financial reporting, what is the relative importance of each of the 34 IT control and security processes? RQ2: In the context of the reliability of financial reporting, to what extent does the relative importance of each of the 34 IT control and security processes vary as a function of characteristics of the IT professionals within the organization? METHOD We conducted an Internet-based survey of IT professionals to obtain the data necessary to address the research questions described above. Administration of the research instrument over the Internet enabled us to include a number of experimental controls not possible in traditional paper-based instruments. The instrument first elicited demographic data regarding the participants’ geographic location (country), age, gender, education, certifications, audit experience, portion of work involving the review or evaluation of IT controls, and their level of familiarity with COBIT. Participants were then asked to rate, on a five-point Likert scale, the importance of each of the 34 processes in the COBIT framework, in terms of the reliability of financial reporting. In addition, participants were asked to indicate the 10 IT processes they believe are “most important” to reliable financial reporting. Participants were then asked to respond to several additional questions regarding the extent of implementation of COBIT and the
8
degree of success with the implementation for the client on their last audit (for external auditors) or for their company (for those employed in industry). These data regarding COBIT implementation are beyond the scope of the current paper and are not reported herein. Given the nature of the survey, it was deemed necessary to target IT professionals who were familiar with COBIT and who were experienced in the task of reviewing and evaluating IT controls. Accordingly, we determined that the appropriate respondent pool would be members of the Information Systems Audit & Control Association (ISACA), who would not only be familiar with COBIT (which is published by ISACA/ITGI) but would also likely have practical experience with the task of reviewing/evaluating IT controls. The assistance of ISACA headquarters in Chicago was obtained in soliciting the participation of local ISACA chapters in the U.S. and internationally3. Chapter presidents received an e-mail from ISACA encouraging each chapter to participate in the survey. While some chapters chose to publish our solicitation in their local chapter newsletter, others simply forwarded our email to their internal chapter member email list. Usable responses were received from 189 IT professionals from all over the world. Since we cannot determine how many potential respondents received the email but chose not to respond, it is not possible to compute a meaningful response rate. By way of comparison, the Guldentops and De Haes (2002) COBIT usage survey contained data from 182 respondents. Demographic information about the participants is provided in Table 1. [INSERT TABLE 1 HERE] The average age of participants was 40.1 years; 71% were male. Sixty-six percent of the participants reported they work in industry, 18% in public accounting, 16% in government, and 3
We sincerely thank Tom Lamm and Linda Wogelius in the Chicago headquarters of the Information Systems Audit & Control Association (ISACA) for their assistance with this study. We also gratefully acknowledge the assistance of local ISACA chapter presidents in publicizing our survey with their members.
9
less than 1% in consulting. On average, participants had been working for their current employer for 5.8 years. Twenty-one countries were represented by the participants, with half of the participants coming from the USA. Participants were asked to indicate their highest degree earned. One respondent reported holding a Ph.D. degree, 38% had master’s degrees, 57% had bachelor’s degrees, 2% had an Associate’s degree, and 2% did not indicate holding a degree. Regarding participants’ professional certifications, 58% were Certified Information Systems Auditors, 14% were Certified Public Accountants, 11% were Certified Internal Auditors, 5% were Chartered Accountants, and 5% were Certified Fraud Examiners. It is interesting to note that over 40% of respondents were not Certified Information Systems Auditors, yet they belonged to an ISACA chapter (as indicated earlier, the email solicitation for the survey was routed through local ISACA chapters). Thirty-two percent of the participants reported holding certifications other than those listed above, including Certified Information Systems Security Professional (CISSP), Certified Information Systems Manager (CISM), Certified Disaster Recovery Planner (CDRP), Certified Financial Services Auditor (CFSA), Microsoft Certified Systems Administrator (MCSA), Microsoft Certified Systems Engineer (MCSE), Microsoft Certified Professional (MCP), Information Technology Infrastructure Library (ITIL) certification, and ISO 27001 certification. To assess participants’ extent of prior experience with evaluating IT controls, we asked participants to respond to the following question: “In the last two years, what percentage of your work hours related to the task of reviewing/evaluating information technology controls?” Fiftytwo percent of the participants reported spending more than 50% of their work hours reviewing and/or evaluating IT controls. Only 9.5% of the participants reported spending less than 10% of
10
their work hours reviewing IT controls, while 34.4% of the participants reported spending more than 75% of their work hours reviewing IT controls. These data provide support for the notion that, on average, the survey respondents spent a considerable portion of their time reviewing and/or evaluating IT controls. We also asked each participant to rate the extent of their familiarity with COBIT using a five-point scale anchored with 1 (not familiar at all) and 5 (very familiar). Ninety-three percent of the participants rated their familiarity with COBIT as 3 or higher. The median rating was 4.0, and the mean rating was 3.86 (out of 5). Combined with the data regarding their work time involving the review/evaluation of IT controls, these data suggest that the survey respondents can reasonably be deemed “experts,” thereby enhancing the credibility of their ratings regarding the importance of each of the 34 COBIT processes from the viewpoint of the reliability of financial reporting. Next, participants were presented with each of the 34 IT processes, grouped according to their domain (PO, AI, DS, M), and asked to “… indicate your perception of the importance of each IT process to achieving effective internal control over the reliability of financial reporting on a scale from 1 to 5.” The scale was labeled as follows: 1=Not at all important; 2=Relatively unimportant; 3=Somewhat important; 4=Important; 5=Very important. Hyperlinks were attached to each brief process description (e.g., PO1 Define a Strategic IT Plan) to allow participants to refresh their memory. Clicking on the hyperlink for a process brought up a popup window with a more detailed explanation of the process (the business requirement it satisfies, what the process is enabled by, and what the process takes into consideration). Participants were also asked to “… select the 10 processes that you feel are the most important for achieving effective internal control over the reliability of financial reporting.”
11
Controls embedded into the Web-based survey instrument ensured that participants answered all questions and selected exactly 10 IT processes as their “ten most important” processes. The results are presented in the next section.
RESULTS Importance of IT Control Processes in Achieving Reliable Financial Reporting To address our first research question, we examine participants’ ratings of the relative importance of each of the 34 IT control and security processes in the context of achieving effective internal control over the reliability of financial reporting. Participants rated each process on a scale of 1 (not at all important) to 5 (very important). Mean importance ratings are presented in Table 2, ranked from most to least important. [INSERT TABLE 2 HERE] The IT process rated as most important for effective internal control over financial reporting was Ensure System Security (4.66). This was followed closely by Manage Changes (4.49), Assess Risk (4.41), Manage Data (4.33), and Assess Internal Control Adequacy (4.33). Of these top five processes, it appears that two of the five (ensure systems security and manage changes) could be classified as “general controls” while one (manage data) could be classified as “application controls.” However, other processes normally considered within the “general controls” umbrella (e.g., manage operations) were rated considerably lower (see Table 2). In all, 13 of the 34 IT processes received a mean importance rating of 4 or greater. These 13 processes come from all four COBIT domains—three from the “Plan and Organize” domain, five from the “Deliver and Support” domain, two from the “Acquire and Support” domain, and three from the “Monitor” domain. The three processes that ranked the lowest were Determine the Technological Direction (3.55), Identify and Allocate Costs (3.41), and Assist and Advise
12
Consumers (3.24). It is important to recognize, though, that these processes ranked low in terms of their importance for maintaining effective internal control over the reliability of financial reporting. As such, it would be erroneous to conclude that those processes are “unimportant.” In order to provide a second measure of the relative importance of each IT process and to validate the importance ratings discussed above, we asked participants to select the 10 processes they believe are the most important for achieving effective internal control over the reliability of financial reporting. The number of times each of the 34 IT processes was selected as one of the 10 most important processes is presented in Table 3. [INSERT TABLE 3 HERE] As shown in Table 3, Ensure System Security was the IT process most frequently selected, with 143 of our 189 participants selecting it as one of the 10 most important processes in achieving effective control over reliable financial reporting. The processes next most frequently selected were Manage Changes (133), Assess Risk (122), Assess Internal Control Adequacy (98), and Manage Data (97). These selections are strikingly consistent with and hence support the importance ratings discussed previously. The five processes selected most frequently also received the five highest mean importance ratings (see Table 2), albeit in a slightly different order. A hierarchical cluster analysis was performed to ascertain whether the importance ratings resulted in the formation of “clusters” of the 34 processes in terms of their relative closeness to one another. This procedure in SPSS attempts to identify relatively homogeneous groups (i.e., “clusters”) of variables based on selected characteristics, using an algorithm that starts with each variable in a separate cluster and combines clusters until only one is left. Visual output from the hierarchical cluster analysis is a dendrogram, shown in Figure 2. A dendrogram is a visual
13
representation of the steps in a hierarchical clustering solution that shows the clusters being combined and the values of the distance coefficients at each step. Variables that cluster together are designated via connected vertical lines on the dendrogram. [INSERT FIGURE 2 HERE] As shown at the top of the dendrogram, AI6 (Manage Changes) and DS5 (Ensure Systems Security) cluster together. These two processes next cluster with PO9 (Assess Risk), which is followed in sequence by DS11 (Manage Data), M2 (Assess Internal Control Adequacy) and PO8 (Ensure Compliance with External Requirements). Processes AI4 (Develop and Maintain Procedures) and AI5 (Install and Accredit Systems) cluster together, as do DS12 (Manage Facilities) and DS13 (Manage Operations). The remainder of the dendrogram can similarly be interpreted. It is interesting to note that the two processes ranked the lowest (DS6 and DS8) in Table 2 cluster together and are distinct from all other processes, as shown in Figure 2. Relationships Among IT Processes in Reliable Financial Reporting In the COBIT framework, the 34 IT processes are grouped into four domains based on the traditional areas of responsibility within IT: plan, build, run, and monitor. In contrast, the focus of the current study in on the relationship between the IT processes and financial reporting reliability. Accordingly, in order to discern possible relationships among the 34 IT processes in terms of effective internal control over financial reporting, we performed a principal components factor analysis with varimax rotation based on participants’ importance ratings. Results of the factor analysis, which reveals some interesting relationships, are presented in Table 4.
14
[INSERT TABLE 4 HERE] Six groupings of the 34 IT processes were formed based on the factor loadings. The six groupings are as follows: Factor 1—Key processes, including general and application controls (9 of the 10 processes in this factor have mean importance ratings greater than 4 (see Table 2)); Factor 2—Planning and IT management processes; Factor 3—Organization and relationships processes; Factor 4—Technology processes; Factor 5—Operations and facilities processes, and Factor 6—Independent audit processes. Since varimax rotation was employed, these six factors are orthogonal. The main objective of this principal components factor analysis was data reduction—rather than investigating differences as a function of categorical variables such as employment type for each of the 34 processes, we can focus on differences in six factors for a more tractable analysis. Subsequent analyses reported below, which address our second research question, are based on these six factors obtained from the factor analysis. Relationships among Perceived Importance of IT Processes and Characteristics of IT Professionals To address our second research question, in which we explore potential relationships among the 34 COBIT IT processes (reduced to six factors) and characteristics of IT professionals, we used the General Linear Model procedure in SPSS. Separate GLM procedures were run using, as the dependent variables, the means of the COBIT IT processes within each of the six factors identified previously in our factor analysis. Independent variables included participants’ geographic location (country), extent of audit experience, extent of familiarity with COBIT, and employment type (public accounting vs. Industry vs. Government). The “country,” “extent of audit experience” and “extent of familiarity with COBIT” constituted categorical variables formed by recoding the data as follows: (1) country was coded as 1 for USA or Canada, and 2 for all other countries, (2) extent of audit experience was coded as 1 for those with four or
15
less years of experience and 2 for those with more than four years of experience (51.6% of respondents had four or less years of experience), and (3) extent of COBIT familiarity was coded as 1 for those that rated familiarity at ‘3’ or lower (on the 5 point scale) and 2 for those that rated familiarity higher than 3 (i.e., 4 or 5). Only one of the six factors was found to be significantly affected by any of independent variables examined. Factor 4, Technology Processes, was associated with participants’ employment type and with their geographic location. As shown in Table 5, participants employed in public accounting rated the importance of Technology Processes higher, on average, than participants employed in industry or government (4.05 vs 3.66 vs 3.60, respectively, on a 5point scale). This finding can likely be attributed to the fact that respondents in public accounting often encounter an array of technological environments (i.e., for different audit clients) and accordingly feel differently about the importance of technology processes relative to those in industry or government who are most likely familiar with only one technology environment (i.e., their own). [INSERT TABLE 5 HERE] In addition, participants employed in North America (USA and Canada) rated the importance of Technology Processes higher, on average, than participants in other countries (3.82 vs 3.61)—see Table 6. This difference is marginally significant (p=0.08). A possible explanation for this finding is that organizations in North America probably have more sophisticated technology environments relative to organizations in Eastern Europe, the Middle East, Africa, and Asia, all of which are represented in our sample.
16
[INSERT TABLE 6 HERE] Finally, we investigated whether there were significant patterns in the relationships among participants’ characteristics. Three statistically significant relationships were observed. First, the extent of participants’ familiarity with COBIT was significantly associated with their extent of audit experience. Recall that each participant rated their extent of familiarity with COBIT using a five-point scale anchored with 1 (not familiar at all) and 5 (very familiar). As shown in Panel A of Table 7, participants with more than 4 years of audit experience reported greater familiarity with COBIT than participants with audit experience of 4 years or less (4.08 vs 3.65 on the 5-point scale). Results from the GLM procedure revealed that this difference is statistically significant (p=0.003). It is logical that respondents with more audit experience would be significantly more familiar with COBIT, as they likely have encountered COBIT for a longer period of time than those with less audit experience. [INSERT TABLE 7 HERE] Second, there is a significant association between the percentage of participants’ work hours that relate to the task of reviewing/evaluating information technology controls and participants’ geographic location—see Table 8. Participants in North America (USA and Canada) reported spending a greater percentage of time reviewing and evaluation IT controls than participants in other locations (3.69 vs 3.23 on a 5-point scale). Results from the GLM procedure reveal that this difference is statistically significant (p=0.023). This finding dovetails with the finding reported earlier that respondents in North America differed in their importance rating of technology related processes relative to respondents from other countries. It is also possible that respondents in North America are better trained and more attuned to the task of reviewing and evaluating IT controls relative to respondents from other countries.
17
[INSERT TABLE 8 HERE] Finally, we observed a significant relationship between the percentage of work hours related to reviewing/evaluating IT controls and participants’ employment type—see Table 9. As shown in Panel A of Table 9, participants employed in public accounting reported spending a greater percentage of their work hours reviewing and evaluating IT controls (3.94 on a 5-point scale) than participants employed in industry (3.46) or government (3.03). Cross tabulation results in Panel B of Table 9 reveal significant differences between the observed and expected cell counts in each category of “percentage of work relating to the task of reviewing/evaluating IT controls” tabulated by employment type. Chi-square results in Panel C of Table 9 reveal that the pattern of observed to expected cell counts is significantly different (Pearson Chi-Square = 25.49, df=8, p=.001). Again, this finding is not surprising since external auditors are charged with the responsibility of reviewing and evaluating controls. No additional significant relationships were observed among other characteristics of the IT professionals who participated in this study. [INSERT TABLE 9 HERE] SUMMARY AND CONCLUSION The purpose of this study was to investigate the link between COBIT and internal control over the reliability of financial reporting. A Web-based survey was conducted soliciting participation from local chapters of the Information Systems Audit and Control Association from all over the world. A total of 189 respondents from 21 countries provided data for the results reported in this paper. Respondents were relatively experienced and were quite familiar with COBIT. Each of the 34 COBIT IT processes was rated in importance from the perspective of maintaining effective internal control over the reliability of financial reporting. In addition,
18
respondents selected the ten processes they felt were the most important for effective internal control over the reliability of financial reporting. This paper contributes to the IT auditing literature through its presentation of results from a large scale survey of IT professionals regarding the relevance of the most widely used IT governance framework, i.e., COBIT. A key contribution of this study is the specific focus on how the 34 IT processes in COBIT contribute to effective internal control over the reliability of financial reporting. The results revealed that five COBIT processes were deemed particularly critical for maintaining effective internal control over the reliability of financial reporting. These five processes are Ensure System Security (DS5), Manage Changes (AI6), Assess Risk (PO9), Assess Internal Control Adequacy (M2), and Manage Data (DS11). Principle components factor analysis yielded six factors grouped logically together from the 34 total IT processes. Of the six factors, the only one that was rated significantly different as a function of the respondent’s country or employment type was the “technology processes” factor. Not surprisingly, results revealed that the more experienced respondents were more familiar with COBIT. Interestingly, it was found that respondents from North America and those in public accounting tend to spend a significantly greater percentage of their work hours reviewing and evaluating IT controls. There are some limitations to consider in interpreting the results of this study. Given the multiple ways in which local ISACA chapters might have selected to publicize the survey, and assuming that many chapters chose to not participate, the true response rate and hence the extent of non-response bias is unknown. The extent to which the importance ratings were affected by the length of the instrument is unknown; the extended nature of the instrument could have invoked the “fatigue factor” in some respondents. The order of the 34 processes was not randomized and it is unclear whether order effects might account for the observed differences in
19
ratings. Despite the explicit instructions given, it is possible that some respondents were not attuned to the focus on the effect of the COBIT IT processes on the reliability of financial reporting. Finally, it is unknown whether the lack of a reference point or context resulted in biased importance ratings. While the focus of this research was to ascertain the relative importance of the 34 COBIT IT processes from the viewpoint of the reliability of financial reporting, future research could investigate why the five processes emerging as most important were so deemed. Future research could also investigate the extent to which the 34 IT processes contribute to other organizational objectives, such as the efficiency and effectiveness of operations. To conclude, this paper sheds light on the extent to which expert IT professionals judge the COBIT processes in terms of their importance for maintaining effective internal control over the reliability of financial reporting, which should be of significant interest and relevance to executives, managers, and auditors in virtually any organization.
20
REFERENCES
Anand, S. 2006. Sarbanes-Oxley Guide for Finance and Information Technology Professionals. 2nd Edition. John Wiley & Sons, Inc. Hoboken, New Jersey. Green, S. 2004. Manager’s Guide to the Sarbanes-Oxley Act: Improving Internal Controls to Prevent Fraud. John Wiley & Sons, Inc. Hoboken, New Jersey. Guldentops, E. and S. De Haes. 2002. COBIT 3rd Edition Usage Survey: Growing Acceptance of COBIT. Information Systems Control Journal, Volume 6. IT Governance Institute. 2006. IT Control Objectives for Sarbanes-Oxley: The Role of IT in the Design and Implementation of Internal Control over Financial Reporting. 2nd Edition. Rolling Meadows. Illinois. IT Governance Institute. 2007. COBIT 4.1: Framework, Control Objectives, Management Guidelines, Maturity Models. Rolling Meadows, Illinois. Ramos, M. 2006. How to Comply with Sarbanes-Oxley Section 404: Assessing the Effectiveness of Internal Control. 2nd Edition. John Wiley & Sons, Inc. Hoboken, New Jersey. U.S. Securities and Exchange Commission. 2003. Final Rule: Management’s Reports on Internal Control Over Financial Reporting and Certification of Disclosure in Exchange Act Periodic Reports. http://www.sec.gov/rules/final/33-8238.htm.
21
Table 1 Descriptive Statistics
AGE
Frequency
Percent
20-25 26-30 31-35 36-40 41-45 46-50 51-55 56-60 > 60
10 27 32 25 36 29 19 9 2
5.3 14.3 16.9 13.2 19 15.3 10.1 4.8 1.1
GENDER
Frequency
Percent
Male Female
135 54
71.4 28.6
EMPLOYMENT
Frequency
Percent
Industry Public Accounting Government Consulting
124 33 31 1
65.6 17.5 16.4 0.5
COUNTRY
Frequency
Percent
United Arab Emirates Australia Bulgaria Botswana Canada France India Italy Kenya Korea Malta Malaysia Oman Peru Romania Saudi Arabia Sweden Tunisia USA Republic of South Africa Zimbabwe
1 26 5 1 3 1 2 1 6 1 5 1 7 1 14 2 1 1 95 14 1
0.5 13.8 2.6 0.5 1.6 0.5 1.1 0.5 3.2 0.5 2.6 0.5 3.7 0.5 7.4 1.1 0.5 0.5 50.3 7.4 0.5
22
Table 1 Descriptive Statistics (continued) PROFESSIONAL CERTIFICATIONS
Frequency
Percent
CISA CPA CIA CA CFE OTHER
109 27 20 5 5 61
57.7 14.3 10.6 2.6 2.6 32.3
TIME SPENT REVIEWING IT CONTROLS
Frequency
Percent
Less than 10% 10% - 25% 26% - 50% 51% - 75% Greater than 75%
18 39 34 33 65
9.5 20.6 18.0 17.5 34.4
Familiarity with COBIT*
Frequency
Percent
1 2 1.1 2 11 5.8 3 60 31.7 4 55 29.1 5 61 32.3 * 1 = Not at all familiar; 3 = Somewhat familiar; 5 = Very familiar
23
Table 2 COBIT Processes Sorted by Mean Importance Ratings COBIT Process* DS5 AI6 PO9 DS11 M2 PO8 DS10 AI4 M1 PO11 DS4 M4 DS7 PO10 M3 DS9 PO2 DS13 PO1 AI5 PO6 AI3 AI2 DS2 PO4 DS12 DS1 DS3 PO5 PO7 AI1 PO3 DS6 DS8
Description of process Ensure System Security Manage Changes Assess Risk Manage Data Assess Internal Control Adequacy Ensure Compliance with External Requirements Manage Problems and Incidents Develop and Maintain Procedures Monitor the Process Manage Quality Ensure Continuous Service Provide for Independent Audit Educate and Train Users Manage Projects Obtain Independent Assurance Manage the Configuration Define the Information Architecture Manage Operations Define a strategic IT plan Install and Accredit Systems Communicate Management Aims and Directions Acquire and Maintain Technology Infrastructure Acquire and Maintain Application Software Manage Third-party Services Define the IT Organization and Relationship Manage Facilities Define and Manage Service Levels Manage Performance and Capacity Manage the Information Technology and Relationships Manage Human Resources Identify Automated Solutions Determine the Technological Direction Identify and Allocate Costs Assist and Advise Consumers
Mean importance rating 4.661 4.487 4.413 4.333 4.328 4.222 4.101 4.085 4.079 4.074 4.048 4.021 4.005 3.952 3.947 3.931 3.884 3.884 3.878 3.873 3.825 3.815 3.799 3.783 3.746 3.730 3.714 3.714 3.709 3.640 3.566 3.545 3.407 3.238
* PO=Plan and Organize; AI=Acquire and Implement; DS=Deliver and Support; M=Monitor.
24
Table 3 Number of times each IT process was selected as a “Top 10” process COBIT process DS5 AI6 PO9 M2 DS11 PO1 M1 AI4 DS10 DS7 PO8 M4 M3 DS4 DS9 PO10 PO2 AI2 PO11 PO6 AI3 PO4 DS1 DS13 PO5 AI5 PO7 DS2 DS3 PO3 DS6 AI1 DS12 DS8
Description of process Ensure System Security Manage Changes Assess Risk Assess Internal Control Adequacy Manage Data Define a strategic IT plan Monitor the Process Develop and Maintain Procedures Manage Problems and Incidents Educate and Train Users Ensure Compliance with External Requirements Provide for Independent Audit Obtain Independent Assurance Ensure Continuous Service Manage the Configuration Manage Projects Define the Information Architecture Acquire and Maintain Application Software Manage Quality Communicate Management Aims and Directions Acquire and Maintain Technology Infrastructure Define the IT Organization and Relationship Define and Manage Service Levels Manage Operations Manage the Information Technology and Relationships Install and Accredit Systems Manage Human Resources Manage Third-party Services Manage Performance and Capacity Determine the Technological Direction Identify and Allocate Costs Identify Automated Solutions Manage Facilities Assist and Advise Consumers
Top 10 count 147 133 122 98 97 91 81 74 70 66 64 58 55 51 50 49 48 46 45 44 39 38 38 36 35 35 34 31 29 24 20 19 17 6
* PO=Plan and Organize; AI=Acquire and Implement; DS=Deliver and Support; M=Monitor.
25
Table 4 Factor Analysis Results: Rotated Component Matrix
COBIT process AI6: Manage Changes DS5: Ensure System Security DS11: Manage Data M2: Assess Internal Control Adequacy AI4: Develop and Maintain Procedures PO9: Assess Risk DS10: Manage Problems and Incidents M1: Monitor the Process DS7: Educate and Train Users AI5: Install and Accredit Systems DS4: Ensure Continuous Service DS3: Manage Performance and Capacity DS1: Define and Manage Service Levels PO3: Determine the Technological Direction PO1: Define a strategic IT plan DS8: Assist and Advise Consumers DS6: Identify and Allocate Costs PO10: Manage Projects PO11: Manage Quality
Factor 1
Factor 2
Factor 3
Factor 4
Factor 5
Factor 6
Key processes: General & application controls
Planning and IT mgmt processes
Organization and relationships processes
Technology processes
Operations and facilities processes
Independent audit processes
.787
.121
.104
.120
.117
.098
.755
.196
.145
.175
.130
.114
.734
.197
-.050
.153
.294
.033
.673
.067
.239
-.011
.056
.390
.643
.041
.176
.348
.050
.143
.624
.092
.417
.093
.138
.221
.584
.431
.166
.000
.354
.074
.551
.254
.244
-.056
.245
.318
.533
.326
.171
.274
.102
.081
.497
.083
.057
.458
.262
.165
.280
.764
-.002
.149
.178
-.023
.186
.711
.249
.132
.269
.131
.202
.693
.242
.066
.235
.197
-.011
.649
.511
.251
-.011
-.004
.158
.648
.428
-.011
.036
.040
-.010
.616
.210
.177
.343
.263
-.015
.590
.252
.148
.217
.478
.282 .484
.543 .485
.181 .164
.300 .159
.019 -.064
.039 .063
Extraction Method: Principal Component Analysis. Rotation Method: Varimax.
26
Table 4 (continued) Factor Analysis Results: Rotated Component Matrix
COBIT process PO4: Define the IT Organization and Relationship PO5: Manage the Information Technology and Relationships PO6: Communicate Management Aims and Directions PO7: Manage Human Resources PO2: Define the Information Architecture PO8: Ensure Compliance with External Requirements AI2: Acquire and Maintain Application Software AI3: Acquire and Maintain Technology Infrastructure AI1: Identify Automated Solutions DS13: Manage Operations DS2: Manage Third-party Services DS12: Manage Facilities DS9: Manage the Configuration M3: Obtain Independent Assurance M4: Provide for Independent Audit
Factor 1
Factor 2
Factor 3
Factor 4
Factor 5
Factor 6
Key processes: General & application controls
Planning and IT mgmt processes
Organization and relationships processes
Technology processes
Operations and facilities processes
Independent audit processes
.138
.285
.759
.063
.147
.131
.148
.209
.711
.091
.171
.180
.133
.510
.587
.071
.083
.086
.167
.280
.572
.165
.245
.134
.266
.454
.566
.148
-.095
-.067
.388
.032
.520
.179
.263
-.002
.283
.126
.188
.800
.131
-.023
.140
.242
.256
.707
.306
-.012
.160
.408
-.008
.656
-.085
.285
.444
.185
.272
.185
.606
.252
.247
.351
.223
.084
.577
-.043
.293
.338
.109
.167
.570
.315
.409
.042
.393
.277
.546
.075
.441
.109
.158
.086
.048
.765
.458
.156
.086
.086
.163
.672
Extraction Method: Principal Component Analysis. Rotation Method: Varimax.
27
Table 5 Ratings of Technology Processes by Employment Type Panel A: Descriptive Statistics Employment type Mean* Std. Deviation Public accounting 4.0505 .67762 Industry 3.6640 .83671 Government 3.6022 .65783 Total 3.7216 .79507
N 33 124 31 188
* 1=Not at all important; 5=Very important.
Panel B: Tests of Between-Subjects Effects Type III Sum of Source Squares df Mean Square Corrected 4.424(a) 2 2.212 Model Intercept 1813.311 1 1813.311 Employment 4.424 2 2.212 Error 113.786 185 .615 Total 2722.111 188 Corrected 118.210 187 Total a R Squared = .037 (Adjusted R Squared = .027)
28
F
Sig.
3.596
.029
2948.191 3.596
.000 .029
Table 6 Ratings of Technology Processes: North America vs. Rest of the World Panel A: Descriptive Statistics Country Mean* Std. Deviation USA or Canada 3.8197 .80259 All other 3.6148 .77719 countries Total 3.7216 .79507
N 98 90 188
* 1=Not at all important; 5=Very important.
Panel B: Tests of Between-Subjects Effects Type III Sum of Source Squares df Mean Square Corrected 1.970(a) 1 1.970 Model Intercept 2593.100 1 2593.100 Country 1.970 1 1.970 Error 116.240 186 .625 Total 2722.111 188 Corrected Total 118.210 187 a R Squared = .017 (Adjusted R Squared = .011)
29
F
Sig.
3.152
.077
4149.321 3.152
.000 .077
Table 7 Extent of COBIT familiarity by Audit Experience Panel A: Descriptive Statistics Extent of audit Std. experience Mean* Deviation Relatively less (four 3.65 .902 years or less) Relatively more (more 4.08 1.014 than 4 years) Total 3.86 .979
N 97 91 188
* 1=Not familiar at all with COBIT; 5=Very familiar with COBIT.
Panel B: Tests of Between-Subjects Effects Type III Sum of Mean Source Squares df Square Corrected Model 8.578(a) 1 8.578 Intercept 2802.919 1 2802.919 Audit Exp 8.578 1 8.578 Error 170.544 186 .917 Total 2975.000 188 Corrected Total 179.122 187 a R Squared = .048 (Adjusted R Squared = .043)
30
F 9.356 3056.940 9.356
Sig. .003 .000 .003
Table 8 Extent of work relating to task of reviewing/evaluating IT controls: North America vs. Rest of the World Panel A: Descriptive Statistics Country USA or Canada All other countries Total +
Std. Mean Deviation 3.69 1.380 3.23 1.366 3.47 1.389 +
N 98 90 188
Scale 1 = less than 10%; 2 = 10% - 25%; 3 = 26% - 50%; 4 = 51% - 75%; 5 = greater than 75%
Panel B: Tests of Between-Subjects Effects Type III Sum of Source Squares df Mean Square Corrected 9.951(a) 1 9.951 Model Intercept 2251.270 1 2251.270 Country 9.951 1 9.951 Error 350.916 186 1.887 Total 2629.000 188 Corrected Total 360.867 187 a R Squared = .028 (Adjusted R Squared = .022)
31
F
Sig.
5.274
.023
1193.265 5.274
.000 .023
Table 9 Extent of Work Relating to Task of Reviewing/Evaluating IT Controls by Employment Type Panel A: Descriptive Statistics +
Employment type Public accounting Industry Government Total +
Mean 3.94 3.46 3.03 3.47
Std. Deviation 1.345 1.428 1.140 1.390
N 33 124 31 188
Scale 1 = less than 10%; 2 = 10% - 25%; 3 = 26% - 50%; 4 = 51% - 75%; 5 = greater than 75%
Panel B: Crosstabulation
Employment type Public accounting
Count Expected Count
Percentage of work relating to task of reviewing/evaluating IT controls Less than 10% 26% 51% Greater 10% 25% 50% 75% than 75% 2 4 6 3 18 3.2 6.7 6.0 5.8 11.4
Industry
Count Expected Count
14 11.9
26 25.1
15 22.4
27 21.8
42 42.9
124 124.0
Government
Count Expected Count
2 3.0
8 6.3
13 5.6
3 5.4
5 10.7
31 31.0
Total
Count Expected Count
18 18.0
38 38.0
34 34.0
33 33.0
65 65.0
188 188.0
Panel C: Chi-Square Tests
Pearson Chi-Square Likelihood Ratio Linear-by-Linear Association N of Valid Cases
Value 25.491(a) 23.976 6.837 188
df 8 8 1
Asymp. Sig. (2-sided) .001 .002 .009
a 2 cells (13.3%) have expected count less than 5. The minimum expected count is 2.97.
Total 33 33.0
32
Figure 1: The COBIT Framework (Source: IT Governance Institute, 2007)
33
Figure 2: Dendrogram from Hierarchical Cluster Analysis of Importance Ratings Rescaled Distance Cluster Combine C A S E Label Num
AI6_imp DS5_Imp PO9_imp DS11_Imp M2_imp PO8_imp AI4_imp AI5_imp DS12_Imp DS13_Imp DS9_Imp DS10_Imp M1_imp DS7_Imp M3_imp M4_imp AI2_imp AI3_imp AI1_imp PO2_imp PO3_imp PO4_imp PO5_imp PO7_imp
17 22 9 28 32 8 15 16 29 30 26 27 31 24 33 34 13 14 12 2 3 4 5 7
PO6_imp DS1_Imp DS3_Imp DS2_Imp PO10_imp PO11_imp DS4_Imp PO1_imp
6 18 20 19 10 11 21 1
DS6_Imp
23
DS8_Imp
25
0 5 10 15 20 25 +---------+---------+---------+---------+---------+
34