The Influence of Hubness on Nearest-Neighbor Methods in Object Recognition Nenad Tomaˇsev∗, Raluca Brehar† , Dunja Mladeni´c∗ and Sergiu Nedevschi† ∗ Artificial
Intelligence Laboratory Joˇzef Stefan Institute Ljubljana, Slovenia Email:
[email protected],
[email protected] † Image Processing and Pattern Recognition Group Technical University of Cluj-Napoca, Romania Email:
[email protected],
[email protected] Abstract—Object recognition from images is one of the essential problems in automatic image processing. In this paper we focus specifically on nearest neighbor methods, which are widely used in many practical applications, not necessarily related to image data. It has recently come to attention that high dimensional data also exhibit high hubness, which essentially means that some very influential data points appear and these points are referred to as hubs. Unsurprisingly, hubs play a very important role in the nearest neighbor classification. We examine the hubness of various image data sets, under several different feature representations. We also show that it is possible to exploit the observed hubness and improve the recognition accuracy.
I. I NTRODUCTION With the advance of digital image capturing devices, the amount of available digital image data has increased manyfold. Automatic image processing is becoming more and more important, as the number of applications is constantly rising. One of the most central tasks in automated image analysis is object detection and recognition. This is usually the first step in any semantic interpretation of images. We will focus on object recognition, for which many existing machine learning classification algorithms can be used. For an image segment to be analyzed, a proper representation must be chosen, depending on the task at hand. This usually involves extracting information from color, texture, edges, or any property which we feel might be worth capturing. All such features can be divided in two groups - local and global image features. Global image features are used to summarize the average properties of an observed segment, while the local features represent information extracted from neighborhoods of some sampling points [40]. These points may simply define a grid over an image, but local features can also be computed at some informative points, according to some optimization criterion, as is often the case with extracting SIFT features [21]. There are many different types of local image features and we have decided to limit our discussion to SIFT, Histogram of oriented features and Haar features, for practical reasons.
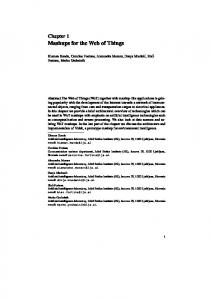
A. Feature Types Several feature types can be extracted from image data. For the purpose of this paper we have extracted three types of features that all have been successfully applied in generic object recognition algorithms. 1) Haar features: Haar filters, derived from Haar wavelets have been introduced by [26] that used the wavelet representation for recognition of two classes of objects: faces and persons. The representation has been exploited and extended by [16] and [20] that completed the set of features and improved the detection algorithm. Haar filters operate on gray level images and their value is represented by the difference of sums computed over rectangular regions. The regions have the same size and shape and are horizontally or vertically adjacent. We have used the two types of features: two-rectangular and three-rectangular as shown in Figure 1:
Fig. 1.
Example of Haar filters
The value of a two-rectangular feature is the difference between the sums of the pixels within two rectangular regions (the white and black regions). The regions have the same size and shape and are horizontally or vertically adjacent. A three-rectangular feature computes the sum within two outside rectangles subtracted from the sum in center rectangle. The integral image representation has been used for a fast computation of feature values. 2) Histogram of oriented gradient features: The histograms of oriented gradients (HoG) were used successfully for pedestrian classification in [36] and extended to generic object recognition [9].
The process of constructing the histograms of oriented gradients comprises the following steps: • gradient computation • spatial/orientation binning • normalization and descriptor blocks Figure 2 represents the above mentioned steps. The parameters
Fig. 2. Basic steps in Hog Extraction a) original image; b) gradient computation c) spatial orientation binning and histogram computation within each cell; d) normalization and descriptor values
of the features have been kept as in [36]; 3) SIFT features: The scale invariant feature transform approach for object recognition or scene matching has been introduced by [22] and extended by [23] that applied a fast nearest-neighbor algorithm to invariant keypoints and obtained a robust object recognition scheme. The main steps of the algorithm comprise: • Difference of Gaussians used to find candidate interest points that have the property of being invariant to scale and orientation. • Stability measure of candidate interest point and selection of keypoint locations. • Rotation invariant representation by representing each keypoint descriptor relative to a consistent orientation. • Final keypoint representation, considering shape distortion and change in illumination invariance. B. k-Nearest Neighbor classification 1) The basic algorithm: k-nearest neighbor algorithm (kNN) is a widely used classification method. It is a very simple, yet powerful approach. It is based on an intuitive notion that similar instances often share the same label, i.e. belong to the same object class. Since real world data is often noisy and sparse and there is also a possibility of overlap between different categories, this is usually generalized to observing not one but k nearest neighbors to the point of interest, according to some meaningful similarity measure. The final decision is made by taking a majority vote. This algorithm was first introduced in [10]. Some very strong results have been proven pertaining to the asymptotic behavior of NN algorithms. For instance, when there is no overlap between the classes, 1-nearest neighbor is asymptotically optimal [32] [6]. As for the kNN rule, it has been shown to be universally consistent under some strong assumptions, namely k → ∞ and k/n → 0 [5] [18]. In the hypothetical case of an infinite data sample, the probability of a nearest neighbor of xi having label c is asymptotically
equal to the posterior class probability in point xi , namely p(c|xi ) = limn→∞ p(c|NN(xi )). 2) Related work on kNN: In practical applications, none of these conditions are met. They do, however, give some theoretical justification to all nearest neighbor approaches. Many improvements over the initial algorithm have been proposed over the years. These improvements have been aimed at various practical shortcomings of the algorithm. Some of them were more general and some domain-specific. For instance, attribute weighting was proposed in [13] and adaptive distances in [37] [31]. Fuzzy labels were also considered [17] [15] [30]. Some advanced algorithms have been proposed recently, including the large margin kNN classifier which learns the Mahalanobis distance matrices via semidefinite programming [39] [24]. 3) Hubs, frequent nearest neighbors: Sometimes, in kNN classification, points emerge which appear very frequently in k-neighbor sets, much more frequently than we would naturally assume. In other words, the distribution of k-occurrences becomes highly skewed. We will refer to these influential points as hubs. Recently, methods which exploit the hubness phenomenon by learning from past occurrences [34] [33] have been proposed, but this will be discussed in more detail in Section II-B. Hub points are more likely to appear in highdimensional data, as will be explained in Section II. They were first noticed in music collections [3] [2]. The researchers discovered that there were some songs which were similar to many other songs. This conceptual similarity, however, did not reflect the perceptual similarity. In other words, these hubsongs were an artefact of the underlying high-dimensional song representation. Images are also inherently high dimensional, so hubs are likely to appear in image collections as well. 4) Nearest Neighbor Methods in Image Classification: It has recently been suggested [4] that certain nearest neighbor approaches may perform as well as state-of-the-art algorithms for object recognition. One point which was made is that some discriminative power is usually lost if local feature quantization is performed. Quantizing features into visual words is a very convenient and widely used approach, which makes the observation even more important. The paper suggests calculating image-to-class distances instead of image-to-image distances, but more usual kNN approaches have also been successfully applied to object detection/recognition, as in [38] [12]. C. The goal In this paper we wish to explore how the emergence of hubs affects image classification. We examined the hubness in many image data sets under various feature representations, both quantized as bags of visual words as well as the non-quantized representations. Also, we performed an evaluation of several recently developed kNN algorithms which take hubness into account, by testing them in the context of object recognition.
II. T HE HUBNESS
PHENOMENON
As stated before, hubness denotes high skewness in the distribution of k-occurrences (occurrences in k-neighbor sets) and, consequently, emergence of hubs as influential points, similar to many other data points. This phenomenon was studied in detail in [27] [29] [28]. It was shown that hubness is not merely a peculiarity found in some arbitrary data, nor is it related to the employed distance measure. In fact, it is a direct consequence of inherently high dimensionality of some data representations. Naturally, not all such data contain hubs - but they are expected to appear in many high dimensional distributions, such as the Gaussian distribution. Many realworld data can be observed as a mixture of Gaussians, which is why this usually implies high hubness. A. Why do the hubs appear? The phenomenon of hubness is closely related to what is usually referred to as concentration of distances, which is yet another interesting property of high dimensional spaces [1], [11]. Namely, as the dimensionality of the data increases, distances between data points become relatively more similar to each other. This happens because the expected (mean) distance value increases, while the variance remains constant. Because of this, the very concept of nearest neighbors in high dimensional spaces was questioned. Luckily, for multipledistribution data, which is what we usually encounter in classification problems, this is not as emphasized as in the single-distribution case, which means that kNN still remains usable [14]. Due to the concentration of distances, high dimensional data can usually be thought of as lying on a hyper-sphere around the distribution mean. Points closer to the mean would have a much higher probability of being included in k-neighbor sets of other data points. Hence, hubs are usually located near the centers of dense regions. Points with low hubness, which we will refer to as anti-hubs, on the other hand, are often outliers, though this is not necessarily the case. These observations were successfully exploited in a recently developed clustering algorithm [35].
proposed in [27], and we will refer to this algorithm as hwkNN. This was generalized in [34] to using class-specific hubness scores, Nk,c (xi ). Instead of counting mismatches, the focus was on how often a data point occurs in neighborhoods of elements from any given class. This was used to generate a measure of occurrence fuzziness for each instance. If Dk (x) is the k-neighborhood of x, the occurrence fuzziness was defined N (xi ) . The voting is performed as p(y = c|xi ∈ Dk (x)) ≈ Nk,c k (xi ) as in the fuzzy nearest neighbor classifier [17]. We will refer to this algorithm as h-FNN in the rest of the paper. Since hubs appear more often in k-neighbor sets than other points do, not all points carry the same amount of information pertaining to the class affiliation of the point of interest, and this was first noticed and exploited in [33], where an algorithm called Hubness-information k-nearest neighbor (HIKNN) was proposed. Each individual fuzzy vote was a linear combination of the label vote and the class-hubness vote deduced from previous occurrences. This was then multiplied by the total instance informativeness, which was defined as n log N (x k it ) β(xit ) = . The evaluation showed that not only does log n HIKNN lead to better classification accuracy, it also provides better probability estimates. In our own experimental evaluation presented in Section IV, we will be comparing these three algorithms (hw-kNN, h-FNN and HIKNN) to the basic kNN algorithm, to see if taking hubness into account may lead to improvements in image classification. III. H UBNESS
IN IMAGE DATA
A. Data description We have applied the algorithm for two-class and multi-class object recognition. 1) Non-quantized representations: For two-class object recognition we have experimented the proposed algorithm for pedestrian datasets. We have extracted Haar, HoG and SIFT features for NICTA pedestrian dataset [25], for Daimler pedestrian dataset [7]. Examples of images from the two datasets are given in Figure III-A1.
B. Exploiting hubness for classification It is time to introduce some notation. Let D = (x1 , y1 ), (x2 , y2 ), ..(xn , yn ) be the data set, where each xi ∈ Rd . The xi reside in some high-dimensional Euclidean space, and yi ∈ c1 , c2 , ..cC are the labels. Denote the number of koccurrences of a point xi ∈ D (occurrences in k-neighbor sets of other points from D) by Nk (xi ). There are, roughly speaking, two types of k-occurrences, the good ones (GNk (xi )) and the bad ones (BNk (xi )), so that Nk (xi ) = GNk (xi ) + BNk (xi ). An occurrence of xi in a k-neighborhood of xj is said to be ”good” if the yi = yj , i.e. the respective labels match. Label mismatches define bad hubness. Data points with high BNk are called bad hubs. They often exhibit detrimental influence when classifying by the kNN rule. The first approach to exploiting bad hubness in kNN was a weighting scheme
(a) NICTA images
(b) Daimler Images Fig. 3.
Samples from pedestrian / non-pedestrian datasets
2) Bag of visual words representation: For multi-class object recognition we have extracted Haar and SIFT features for Caltech101 dataset [8] and ImageNet (http://www.imagenet.org/) subsets. We have formed 5 subsets of images from the ImageNet collection, containing 3,4,5,6 and 7 categories, respectively. The subset composition is given in Table I Some sample images from Caltech101 object recognition database are given in Figure III-A2.
(a) accordion
(b) barrel Fig. 4.
Caltech dataset
One may notice that the dimension of the images varies from one category to another. As the algorithm we have proposed needs a uniform representation for each class, that is each class should be characterized by the same number of features, we have formed a bag of words (BoW) representation for each feature type. The bag of words model has emerged from natural language processing and it is extremely used in object categorization [19]. Our experiments mainly used 500 features (visual words) for Caltech101 database and 100 words for ImageNet in Haar quantized representation, as well as 400 in the SIFT quantized representation. For ImageNet datasets, we merged the quantized SIFT representation with 16-bin color histograms extracted from the images. Both parts of the hybrid representation were re-scaled separately to form two probability distributions, the former pertaining to the quantized local information and the latter to the global color information. Giving the same weight to both parts of the representation is far from optimal, as will be clear from the experiments, but our intent was precisely to see what happens in such cases and whether both kNN and the hubness-based nearest neighbor methods are equally affected.
Some of the datasets refer to the same image collections, but they represent different feature representations. This is the case with {ds4, ds8, ds12}, {ds3, ds7, ds11}, {ds5, ds9}, {ds2, ds6}, {ds13, ds22}, {ds14, ds19, ds20, ds21, ds23}, {ds15, ds24}, {ds16, ds25}, {ds17, ds26}, {ds18, ds27}. Several different feature representations were used. Datasets 1-5 are HoG feature representations, datasets 6-9 Haar feature representations, datasets 10-12 are SIFT feature representations. The binary data was represented in a non-quantized way. Datasets 13-27 are quantized representations, 13-21 of Haar features and 22-27 of SIFT features. Datasets 23-27 are hybrid feature representations, where the first 400 dimensions refer to the visual word frequencies and the last 16 features denote a color histogram, calculated globally for each image. All distances between images were calculated by the Manhattan distance (the sum of absolute differences). Also, all features were normalized to the [0, 1] range. The first thing that one notices when looking at Table II is that the distribution of k-occurrences in highly skewed in all cases, so the hubness phenomenon in, without a doubt, present when dealing with collection of images. On ds1 the main hub appears in 10-neighbor sets 1215 times, even though the expectation is, naturally, 10. Whether such a hub is a good hub or a bad hub, it depends on the specific dataset, as both scenarios are possible. If it were to be a bad hub, it is easy to imagine how this would compromise the usual kNN classification. The skewness for each dataset is given by the SNk entry in the table. If we compare the Haar feature representations ds6-9 with their respective HoG or SIFT representations, we see that the hubness is much less pronounced for Haar representations in all cases. This suggests that Haar-based image representations might be in general less susceptible to the Nk (x) skew. More experiments would be required to make such a claim, but if this hypothesis is correct, Haar feature representation should probably be preferred if one wishes to use the basic nearest neighbor methods, which don’t take hubness into account. The comparison between Haar and Hog k-occurrence distribution skewness is given in Figure 5.
B. The analysis The overview of datasets and their properties is given in Table II. The datasets are split into several groups. Most notably, datasets 1-12 represent binary classification problems, while datasets 13-27 contain multiple categories. Some of the binary datasets are balanced, so that each class comprises 50% of the data. The unbalanced binary datasets are given with the suffix -unb. All the given multi-class datasets are unbalanced.
Fig. 5. Comparison between the N5 distribution skewness between HoG and Haar feature representations on several datasets.
TABLE I C LASS STRUCTURE OF THE USED I MAGE N ET DATA SUBSAMPLES Data set
Classes
ImgNet-s3 sea moss, fire, industrial plant ImgNet-s4 cloud, butterfly orchid, herbaceous plant, bird ImgNet-s5 bird, fire, tracked vehicle, people, compass flower ImgNet-s6 fish, industrial plant, wind turbine, compass flower, butterfly orchid, evergreen plant ImgNet-s7 football, worm, sea star, night club, cloud, orchidaceous plant, mountain range TABLE II S UMMARY OF DATA SETS . NN- RELATED PARAMETERS ARE GIVEN FOR k = 5 AND k = 10. SNk DENOTES THE SKEWNESS OF Nk (x). M EAN ENTROPY OF NEIGHBOR SETS IS GIVEN BY HNk AND MEAN ENTROPY OF INVERSE NEIGHBOR SETS BY HINk .max Nk DENOTES THE HIGHEST HUBNESS ACHIEVED BY A SINGLE DATA POINT ON THE DATA SET, WHICH IS IN FACT THE MAXIMAL NODE DEGREE IN THE kNN GRAPH OBTAINED FROM THE DATA .
Data set
features
size
d
C
SN5
SN10
max N5
max N10
HN5
HN10
HIN5
HIN10
ds1: ds2: ds3: ds4: ds5:
nicta nicta 16x40 nicta-unb 64x80 nicta-unb-small 64x80 daimler
HoG HoG HoG HoG HoG
15891 8000 9000 500 9804
2268 972 2268 2268 1440
2 2 2 2 2
21.68 3.92 10.72 3.84 4.87
15.45 3.42 8.30 3.66 4.55
844 106 440 69 88
1215 160 628 122 166
0.13 0.13 0.05 0.12 0.07
0.17 0.17 0.06 0.16 0.12
0.07 0.11 0.05 0.13 0.09
0.10 0.18 0.08 0.20 0.16
ds6: ds7: ds8: ds9:
nicta 16x40 nicta-unb 64x80 nicta-unb-small 64x80 daimler
Haar Haar Haar Haar
8000 9000 500 9804
11920 1881 1881 12555
2 2 2 2
1.64 3.05 2.99 2.14
1.60 2.89 2.54 2.21
38 95 59 44
67 183 94 89
0.24 0.04 0.03 0.07
0.29 0.03 0.03 0.12
0.20 0.11 0.18 0.10
0.29 0.17 0.24 0.16
ds10: nicta 64x80 ds11: nicta-unb 64x80 ds12: nicta-unb-small 64x80
SIFT SIFT SIFT
8000 9000 500
4480 4480 4480
2 2 2
10.96 10.72 3.89
8.94 8.45 3.89
336 376 71
512 577 114
0.12 0.05 0.14
0.16 0.07 0.19
0.09 0.05 0.13
0.14 0.09 0.22
ds13: ds14: ds15: ds16: ds17: ds18: ds19: ds20: ds21:
caltech-6 ImgNet-s3 ImgNet-s4 ImgNet-s5 ImgNet-s6 ImgNet-s7 ImgNet-s3Er ImgNet-s3Er ImgNet-s3Er
Haar-bow Haar-bow Haar-bow Haar-bow Haar-bow Haar-bow Haar-bow Haar-bow Haar-bow
280 2731 6054 6555 6010 10544 2731 2731 2731
650 100 100 100 100 100 100 150 1000
6 3 4 5 6 7 3 3 3
2.79 2.10 1.94 2.06 1.79 2.29 20.56 25.1 23.3
2.15 1.83 1.75 1.94 1.58 2.03 15.67 17.83 15.67
40 50 45 45 51 60 375 1280 2363
61 72 70 78 79 108 560 1683 2426
0.07 0.01 0.01 0.01 0.01 0.01 0.05 0.22 0.03
0.17 0.01 0.01 0.01 0.01 0.01 0.20 0.61 0.87
0.03 0.01 0.01 0.01 0.1 0.01 0.01 0.01 0.01
0.07 0.01 0.01 0.01 0.1 0.01 0.01 0.01 0.01
ds22: ds23: ds24: ds25: ds26: ds27:
caltech-6 ImgNet-s3 ImgNet-s4 ImgNet-s5 ImgNet-s6 ImgNet-s7
SIFT-bow SIFT-bow+cH SIFT-bow+cH SIFT-bow+cH SIFT-bow+cH SIFT-bow+cH
280 2731 6054 6555 6010 10544
30 416 416 416 416 416
6 3 4 5 6 7
7.25 8.38 7.69 14.72 8.42 7.65
6.20 6.19 6.32 11.88 6.23 6.72
90 213 204 469 275 268
166 294 311 691 384 450
0.74 0.40 0.77 0.85 0.87 0.86
1.12 0.50 0.95 1.05 1.10 1.12
0.45 0.23 0.45 0.42 0.48 0.54
0.76 0.34 0.65 0.63 0.70 0.80
The neighbor set entropies, HNk , are also displayed in Table II, as well as the entropies of inverse neighbor sets, HINk . These entropies represent respective degrees of uncertainty when deciding based on either the direct or the inverse approach, as is usually the case with hubness-based algorithms. In fortunate circumstances where the basic kNN algorithm doesn’t face a lot of problems, direct and inverse entropies will be close in value and the direct entropies will often be somewhat smaller. This is not surprising, since it was shown in [33] that the region boundary in hubnessbased approaches is much more ”soft” than in the basic kNN approach. This fuzziness accounts for a slight increase in entropy. On the other hand, if the HNk is much higher than HINk for a specific dataset, this is usually a consequence of high bad hubness, which in turn reduces the homogenity in
direct k-neighbor sets and increases their entropy. In some of the multi-class problems that we have observed this seems to be the case. It can be seen from Figure 6 that the direct 5-neighbor sets are much less homogenous than the inverse neighbor sets, for the 6 SIFT bag-of-visualwords feature representations. This strongly implies that taking hubness into account might lead to better results. More details will be given in the experimental Section IV where the classification algorithms are compared. IV. E XPERIMENTS
IN OBJECT RECOGNITION
We evaluated kNN, hw-kNN, h-FNN and HIKNN on all 27 previously mentioned datasets via 10-times 10-fold crossvalidation for a fixed neighborhood size of k = 5. Using an odd number made ties impossible in the binary classification
Fig. 6. Comparison between HN5 and HIN5 on several quantized multiclass datasets. TABLE III C LASSIFICATION ACCURACY OF kNN, HUBNESS - WEIGHTED kNN ( HW-kNN), HUBNESS - BASED FUZZY NEAREST NEIGHBOR ( H -FNN) AND HUBNESS INFORMATION k- NEAREST NEIGHBOR (HIKNN). T HE SYMBOLS •/◦ DENOTE STATISTICALLY SIGNIFICANT BETTER / WORSE PERFORMANCE (p < 0.01) COMPARED TO kNN.
kNN
Data set
hw-kNN
h-FNN
HIKNN
ds1 ds2 ds3 ds4 ds5
86.1 94.7 91.7 91.5 98.2
± ± ± ± ±
0.7 0.7 0.8 0.4 0.3
89.0 95.9 92.5 93.5 98.1
± ± ± ± ±
0.8 • 94.7 ± 0.6 • 93.1 ± 0.6 • 0.5 • 95.6 ± 0.6 • 95.8 ± 0.7 • 0.6 92.6 ± 0.7 92.1 ± 0.8 0.3 • 92.6 ± 3.6 92.9 ± 3.9 0.4 97.8 ± 0.4 97.8 ± 0.4
ds6 ds7 ds8 ds9
84.9 91.7 81.3 97.4
± ± ± ±
1.2 0.8 5.4 0.5
88.3 92.5 80.8 97.0
± ± ± ±
1.2 • 87.3 ± 1.2 • 86.9 ± 1.1 • 0.7 92.6 ± 0.7 92.1 ± 0.9 5.0 80.6 ± 4.8 81.8 ± 5.1 0.6 97.5 ± 0.5 97.5 ± 0.5
ds10 ds11 ds12
94.2 ± 0.8 96.2 ± 0.8 • 95.8 ± 0.8 • 95.6 ± 0.6 • 97.2 ± 0.5 98.1 ± 0.4 • 97.6 ± 0.5 97.4 ± 0.5 91.9 ± 0.4 94.6 ± 0.4 • 94.1 ± 0.3 • 94.6 ± 0.3 •
ds13 ds14 ds15 ds16 ds17 ds18 ds19 ds20 ds21
95.7 99.7 99.9 99.7 99.6 99.8 92.4 80.0 21.2
± ± ± ± ± ± ± ± ±
3.8 0.01 0.01 0.01 0.01 0.01 0.02 0.02 0.02
97.6 99.7 99.9 99.9 99.7 99.9 93.6 88.7 27.1
± ± ± ± ± ± ± ± ±
ds22 ds23 ds24 ds25 ds26 ds27
73.0 72.0 56.2 46.6 60.1 43.4
± ± ± ± ± ±
8.8 2.7 2.0 2.0 2.2 1.7
82.1 80.8 63.3 56.3 68.1 55.1
± ± ± ± ± ±
AVG
83.34
86.23
2.9 95.7 0.01 99.7 0.01 99.9 0.01 99.9 0.01 99.7 0.01 99.9 0.01 97.5 0.02 • 94.6 0.11 59.5
± ± ± ± ± ± ± ± ±
• • • • • •
± ± ± ± ± ±
6.8 2.3 1.9 1.7 1.6 1.5
82.7 82.4 65.2 61.9 69.3 59.2 88.36
3.6 96.8 ± 0.01 99.7 ± 0.01 99.9 ± 0.01 99.9 ± 0.01 99.7 ± 0.01 99.9 ± 0.01 • 97.6 ± 0.01 • 94.8 ± 0.03 • 59.6 ± 6.6 2.2 1.7 1.7 1.7 1.5
• • • • • •
85.0 82.2 64.7 60.8 69.9 56.9
± ± ± ± ± ±
4.7 0.01 0.01 0.01 0.01 0.01 0.01 • 0.01 • 0.03 • 6.2 2.0 1.9 1.9 1.9 1.6
• • • • • •
88.34
case. Corrected re-sampled t-test was used to check for statistical significance. The results are given in Table III. The threshold value in h-FNN was set to zero, so no global or local estimate was used, the fuzziness was obtained in all cases directly from previous k-occurrences. As before, the Manhattan distance was used to calculate all image-to-image distances, after previous feature normalization.
It is clear that using the hubness based methods often improves the classification results, where such an improvement is possible. Of course, this is not always the case. It follows from Table III that such improvements are more often present in those representations where the entropy of the direct kneighbor sets dominates the entropy of the inverse neighbor sets, as discusses in Section III-B. This is quite natural, since such representations are more difficult and there is more room for improvement to begin with. h-FNN and HIKNN algorithms are based on the notion of learning from class hubness where they model all class-to-class occurrences which is precisely why their advantages, when observed, are most pronounced when there is more than just two categories. Of course, in representations ds13-18, there was no room for improvement in the first place, but it is still nice to see that there was no deterioration in performance. Some improvement has been detected even in ”simple” binary cases, as seen from the first half of the table. The best results there were obtained by using the simplest of approaches, hw-kNN. However, the most tangible improvement in the binary case was seen on ds1, where the 8.6% improvement was achieved by h-FNN. This is interesting, since this particular dataset exhibits the highes skewness in the k-occurrence distribution, as seen in Table II. Even though all tests were performed for k = 5, the results are by no means an artefact of the selected neighborhood size. For two multi-class datasets we have performed 10-times 10fold cross validation for an entire range of neighborhood sizes k ∈ {1, 2, .., 20}, as shown in Figure 7. All three hubnessbased algorithms remain dominant when compared to the basic kNN throughout the k-range in both datasets. It seems that on these two datasets, HIKNN algorithm performs best. For the lower range of k-values, h-FNN achieves slightly higher accuracies, but this trend is completely reversed for k > 5 and the best overall accuracies on both datasets are reached for higher k-values. Similarly, hw-kNN trails behind h-FNN and HIKNN in small-to-medium neighborhood sizes, but it slowly improves and becomes quite competitive for larger k-values. Representations ds19-21 are all quantized Haar representations of ImgNet-s3 data. This is where the most convincing improvement was observed. At the first glance, something seems wrong - and it is! After we generated those representations, we have noticed that, due to an I/O error, 5 images were represented by zero-vectors, empty of features. Now, this is only 5 out of 2731 images, so how did it cause such a great deterioration in the kNN performance? A closer look at the table reveals that for a 1000-dimensional representation, kNN was worse than Zero-rule classifier (classifying everything into the majority class). This certainly seem counterintuitive. Also, it is important to notice that the detrimental effect was much less pronounced for a 100-dimensional representation than for a 1000-dimensional representation, so it increased with dimensionality. Actually, the explanation is quite simple. In the quantized image representation, each added dimension increases on average the distances between individual images. However,
(a) ds24: ImgNet-s4
(b) ds25: ImgNet-s5 Fig. 7. Accuracy of h-FNN, HIKNN, kNN and hw-kNN for different kvalues, obtained by 10-times 10-fold cross validation.
the distance to the zero-vector (in the Manhattan metric) would even have been constant for each image, if there hadn’t been for separate feature normalization. Nevertheless, it apparently increased less rapidly. So, as the dimensionality increased, zero-vector became a strong hub and so did these five elements, which were of the minority class. They exhibited large bad hubness, as seen in Figure 8.
Fig. 8. The five most pronounced hubs in ds21 representation of ImgNet-s3 data. Bad hubness (BNk ) completely dominates good hubness (GNk ).
This is quite a remarkable thing. Only five erroneous instances were enough to render 5-NN classifier totally useless
in a very high dimensional setting - due to their high hubness. In a 100-dimensional case, kNN was still at 93.6% accuracy, but already slightly affected, as can be seen by comparing it to h-FNN and HIKNN. Also, this scenario marks a principal difference between hw-kNN and the other two hubness-based classifiers. hw-kNN only weights down the bad hubs, but they still vote by their label. In cases where an entire kneighborhood is compromised, it is powerless. h-FNN and HIKNN are therefore, more robust. All this might seem somewhat irrelevant, since we are basically discussing erroneous data, if only very slightly erroneous. However, it is well known that most data in real world applications contain much higher noise levels and inaccuracies. The erroneous instances do not need to be zero-arrays as in this case. All it takes for a problem to appear is that for a chosen representation and distance metric such instances exhibit a high enough hubness. Unless the representation is very high dimensional with a high enough hubness, this problem may even pass unnoticed, as would have been the case for ds-19, if we hadn’t also generated ds-20 and ds-21 representations where we had actually noticed the error. Several important points stem from this discussion. The phenomenon of hubness is by itself not detrimental, as witnessed on several datasets where kNN reaches a very high accuracy, close to 100%. However, some representations suffer from bad hubness (label mismatches) and this does indeed prove to be quite troublesome at times. The three considered hubnessbased algorithms (hw-kNN, h-FNN and HIKNN) have proven to be much more robust in handling such cases. V. C ONCLUSION We have shown that the phenomenon of hubness is, indeed, present in image datasets, under various feature representations. Not all representations exhibit the same amount of hubness. These differences must be taken into consideration if any sort of nearest-neighbor approach is to be used, whether for classification or clustering. When the skewness in the koccurrence distribution is high, hub points emerge and they can sometimes exhibit a detrimental influence on nearest neighbor algorithms. We evaluated three recently proposed k-nearest neighbor algorithms designed to take hubness into account. The evaluation was performed on many image datasets, both in binary and multi-class classification scenarios. All thee of these algorithms: hw-kNN, h-FNN and HIKNN often showed significant improvements in classification accuracy when compared to the basic kNN algorithms, as well as much higher robustness in cases of bad hubness. This suggests that incorporating the information about previous k-occurrences is potentially quite useful, so hubness should not be disregarded when building nearest-neighbor-based image classification algorithms. In future work, we intend to extend our analysis to the unsupervised case and examine the role of hubness in image clustering. Also, we would like to provide some insightful visualization of good and bad hubness in image collections,
as well as compare our approaches to other state-of-the-art methods for image classification. ACKNOWLEDGMENT This work was supported by the bilateral project between Slovenia and Romania “Understanding Human Behavior for Video Survailance Applications,” the Slovenian Research Agency and the ICT Programme of the EC PlanetData (ICTNoE-257641). R EFERENCES [1] C. C. Aggarwal, A. Hinneburg, and D. A. Keim, “On the surprising behavior of distance metrics in high dimensional spaces,” in Proc. 8th Int. Conf. on Database Theory (ICDT), 2001, pp. 420–434. [2] J. Aucouturier, “Ten experiments on the modelling of polyphonic timbre,” Docteral dissertation, University of Paris 6, Tech. Rep., 2006. [3] J. Aucouturier and F. Pachet, “Improving timbre similarity: How high is the sky?” Journal of Negative Results in Speech and Audio Sciences, vol. 1, 2004. [4] O. Boiman, E. Shechtman, and M. Irani, “In defense of nearest-neighbor based image classification,” in Proceedings of IEEE Conference on Computer Vision and Pattern Recognition. IEEE, 2008. [5] C.J.Stone, “Consistent nonparametric regression,” Annals of Statistics, vol. 5, pp. 595–645, 1977. [6] L. Devroye, “On the inequality of cover and hart,” IEEE Transactions on Pattern Analysis and Machine Intelligence, vol. 3, pp. 75–78, 1981. [7] M. Enzweiler and D. M. Gavrila, “Monocular pedestrian detection: Survey and experiments,” IEEE Trans. Pattern Anal. Mach. Intell., vol. 31, no. 12, pp. 2179–2195, 2009. [8] L. Fei-Fei, R. Fergus, and P. Perona, “Learning generative visual models from few training examples: An incremental bayesian approach tested on 101 object categories,” 2004. [9] P. Felzenszwalb, R. Girshick, D. McAllester, and D. Ramanan, “Object detection with discriminatively trained part based models,” in IEEE Transactions on Pattern Analysis and Machine Intelligence, vol. 32, 2010. [10] E. Fix and J. Hodges, “Discriminatory analysis, nonparametric discrimination: consistency properties,” USAF School of Aviation Medicine, Randolph Field, Texas, Tech. Rep., 1951. [11] D. Franc¸ois, V. Wertz, and M. Verleysen, “The concentration of fractional distances,” IEEE Transactions on Knowledge and Data Engineering, vol. 19, no. 7, pp. 873–886, 2007. [12] S. Gu, Y. Zheng, and C. Tomasi, “Efficient visual object tracking with online nearest neighbor classifier,” in Proceedings of the 10th Asian conference on Computer vision - Volume Part I, ser. ACCV’10. Berlin, Heidelberg: Springer-Verlag, 2011, pp. 271–282. [13] E.-H. Han, G. Karypis, and V. Kumar, “Text categorization using weight adjusted k-nearest neighbor classification,” in Advances in Knowledge Discovery and Data Mining, ser. Lecture Notes in Computer Science, D. Cheung, G. Williams, and Q. Li, Eds. Springer Berlin / Heidelberg, 2001, vol. 2035, pp. 53–65. [14] M. E. Houle, H.-P. Kriegel, P. Kr¨oger, E. Schubert, and A. Zimek, “Can shared-neighbor distances defeat the curse of dimensionality?” in Proceedings of the 22nd international conference on Scientific and statistical database management, ser. SSDBM’10. Berlin, Heidelberg: Springer-Verlag, 2010, pp. 482–500. [Online]. Available: http://portal.acm.org/citation.cfm?id=1876037.1876078 [15] R. Jensen and C. Cornelis, “A new approach to fuzzy-rough nearest neighbour classification,” in Rough Sets and Current Trends in Computing, ser. Lecture Notes in Computer Science, C.-C. Chan, J. GrzymalaBusse, and W. Ziarko, Eds. Springer Berlin / Heidelberg, 2008, vol. 5306, pp. 310–319. [16] M. Jones and P. Viola, “Rapid object detection using a boosted cascade of simple features,” in Conf. Computer Vision and Pattern Recognition, 2001. [17] J. E. Keller, M. R. Gray, and J. A. Givens, “A fuzzy k-nearest-neighbor algorithm,” in IEEE Transactions on Systems, Man and Cybernetics, 1985, pp. 580–585. [18] A. K. L. Devroye, L. Gyorfi and G. Lugosi, “On the strong universal consistency of nearest neighbor regression function estimates,” Annals of Statistics, vol. 22, pp. 1371–1385, 1994.
[19] F.-F. Li and P. Perona, “A bayesian hierarchical model for learning natural scene categories,” in Proceedings of the 2005 IEEE Computer Society Conference on Computer Vision and Pattern Recognition (CVPR’05), ser. CVPR ’05, vol. 2. Washington, DC, USA: IEEE Computer Society, 2005, pp. 524–531. [Online]. Available: http://dx.doi.org/10.1109/CVPR.2005.16 [20] R. Lienhart and J. Maydt, “An extended set of haar-like features for rapid object detection,” in IEEE ICIP 2002, 2002, pp. 900–903. [21] D. Lowe, “Object recognition from local scale-invariant features,” in ICCV, 1999, pp. 1150–1157. [22] ——, “Object recognition from local scale-invariant features,” in The Proceedings of the Seventh IEEE International Conference on Computer Vision, vol. 2, 1999, pp. 1150 – 1157. [23] D. G. Lowe, “Distinctive image features from scale-invariant keypoints,” International Journal of Computer Vision, vol. 60, no. 2, p. 91, Nov. 2004. [24] M. R. Min, D. A. Stanley, Z. Yuan, A. J. Bonner, and Z. Zhang, “A deep non-linear feature mapping for large-margin knn classification,” in ICDM, 2009, pp. 357–366. [25] G. M. Overett, L. Petersson, N. Brewer, N. Pettersson, and L. Andersson, “A new pedestrian dataset for supervised learning,” in IEEE Intelligent Vehivles Symposium, Eindhoven, The Netherlands, June 2008. [26] C. Papageorgiou, M. Oren, and T. Poggio, “A general framework for object detection,” in International Conference on Computer Vision, 1998. [27] M. Radovanovi´c, A. Nanopoulos, and M. Ivanovi´c, “Nearest neighbors in high-dimensional data: The emergence and influence of hubs,” in Proc. 26th Int. Conf. on Machine Learning (ICML), 2009, pp. 865–872. [28] ——, “On the existence of obstinate results in vector space models,” in Proc. 33rd Annual Int. ACM SIGIR Conf. on Research and Development in Information Retrieval, 2010, pp. 186–193. [29] ——, “Hubs in space: Popular nearest neighbors in high-dimensional data,” Journal of Machine Learning Research, vol. 11, pp. 2487–2531, 2011. [30] W. Shang, H. Huang, H. Zhu, Y. Lin, Y. Qu, and H. Dong, “An adaptive fuzzy knn text classifier,” in Computational Science — ICCS 2006, ser. Lecture Notes in Computer Science, V. Alexandrov, G. van Albada, P. Sloot, and J. Dongarra, Eds. Springer Berlin / Heidelberg, 2006, vol. 3993, pp. 216–223. [31] Y. Song, J. Huang, D. Zhou, H. Zha, and C. L. Giles, “Iknn: Informative k-nearest neighbor pattern classification,” in Proceedings of the 11th European conference on Principles and Practice of Knowledge Discovery in Databases, ser. PKDD 2007. Berlin, Heidelberg: Springer-Verlag, 2007, pp. 248–264. [32] T.M.Cover and P.E.Hart, “Nearest neighbor pattern classification,” IEEE Transactions on Information Theory, vol. IT-13, no. 1, pp. 21–27, 1967. [33] N. Tomaˇsev and D. Mladeni´c, “Nearest neighbor voting in high dimensional data: Learning from past occurrences,” Artificial Intelligence Laboratory, Jozef Stefan Institute, Tech. Rep., 2011. [34] N. Tomaˇsev, M. Radovanovi´c, D. Mladeni´c, and M. Ivanovi´c, “Hubnessbased fuzzy measures for high dimensional k-nearest neighbor classification,” in MLDM, 2011. [35] ——, “The role of hubness in clustering high-dimensional data,” in PAKDD, 2011. [36] B. Triggs and N. Dalal, “Histogram of oriented gradients for human detection,” in IEEE Computer Vision and Pattern Recognition, 2005. [37] J. Wang, P. Neskovic, and L. N. Cooper, “Improving nearest neighbor rule with a simple adaptive distance measure,” Pattern Recogn. Lett., vol. 28, pp. 207–213, January 2007. [38] S. Wang, Q. Huang, S. Jiang, and Q. Tian, “Nearest-neighbor classification using unlabeled data for real world image application,” in Proceedings of the international conference on Multimedia, ser. MM ’10. New York, NY, USA: ACM, 2010, pp. 1151–1154. [39] K. Q. Weinberger, J. Blitzer, and L. K. Saul, “Distance metric learning for large margin nearest neighbor classification,” in In NIPS. MIT Press, 2006. [40] Z. Zhang and R. Zhang, Multimedia Data Mining: a Systematic Introduction to Concepts and Theory. Chapman and Hall, 2008.