Jun 30, 2015 - can be run using a Python-CPL interface (Streicher & Weilbacher 2012) ... Apart from such manual testing, two automated testing methods were ...
**Volume Title** ASP Conference Series, Vol. **Volume Number** **Author** c **Copyright Year** Astronomical Society of the Pacific
arXiv:1507.00034v1 [astro-ph.IM] 30 Jun 2015
The MUSE Data Reduction Pipeline: Status after Preliminary Acceptance Europe Peter M. Weilbacher1 , Ole Streicher1 , Tanya Urrutia1 , Arlette P´econtal-Rousset2 , Aur´elien Jarno2 , Roland Bacon2 1 Leibniz-Institut
f¨ur Astrophysik Potsdam (AIP), An der Sternwarte 16, D-14482 Potsdam, Germany 2 Universit´ e
de Lyon, Lyon, F-69003, France; Universit´e Lyon 1, Observatoire de Lyon, 9 avenue Charles Andr´e, Saint-Genis Laval, F-69230, France; CNRS, UMR 5574, Centre de Recherche Astrophysique de Lyon; Ecole Normale Sup´erieure de Lyon, Lyon, F-69007, France Abstract. MUSE, a giant integral field spectrograph, is about to become the newest facility instrument at the VLT. It will see first light in February 2014. Here, we summarize the properties of the instrument as built and outline functionality of the data reduction system, that transforms the raw data that gets recorded separately in 24 IFUs by 4k CCDs, into a fully calibrated, scientifically usable data cube. We then describe recent work regarding geometrical calibration of the instrument and testing of the processing pipeline, before concluding with results of the Preliminary Acceptance in Europe and an outlook to the on-sky commissioning.
1.
The instrument
MUSE (Bacon et al. 2012) is a wide-field integral field spectrograph built for the ESO Very Large Telescope. It passed its Preliminary Acceptance in Europe (PAE) on Sept. 10th, 2013, and is currently being shipped to Chile for installation at the telescope. MUSE consists of 24 image slicer integral field units (IFUs) in as many subsections of the field of view. Spatial and spectral sampling of 0.′′ 2 per spaxel and 1.25 Å per pixel over a field of ∼ 1′ × 1′ coupled with a spectral resolution between 1600 and 3500 ensure the usefulness of MUSE for a large variety of scientific observations. For the study of the early universe the long wavelength range of 480 to 930 nm allows the detection of Lyman-α emission in the redshift range 3 . z . 6.6. A high throughput of &35% with a peak of ∼55% at 7000 Å in conjunction with high stability will enable users to carry out the deepest spectroscopic observations of the universe. In the future, MUSE will be coupled with the adaptive optics module GALACSI (Str¨obele et al. 2012), and reach even fainter limits with ground-layer correction. A narrow-field mode will use laser tomography for high-order correction and deliver significant strehl ratios in the red part of the spectrum over a field of 7.′′ 5 × 7.′′ 5. 1
2
Weilbacher et al.
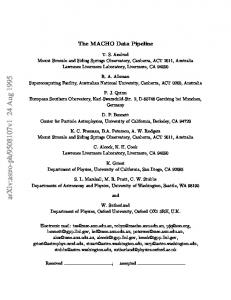
Figure 1. Three slit-mask exposures used to visually verify the geometrical calibration. The exposures were taken with different tilts of the mask to cover most of the field of view. Small imperfections are still visible.
2.
Data processing
The broad range of applications means that the task of the MUSE data reduction system (DRS, Weilbacher et al. 2012) or pipeline is the transformation from the raw, CCDbased data into a datacube that is corrected for instrumental effects. For this, it uses the ESO Common Pipeline Library (CPL, McKay et al. 2004, http://www.eso.org/sci/software/cpl) and the typical ESO plugin framework (”recipes”). Alternatively, the MUSE pipeline can be run using a Python-CPL interface (Streicher & Weilbacher 2012) that can also be used with other ESO pipelines. The consortium uses this interface to integrate the pipeline into the Astro-WISE system (Pizagno et al. 2012). 2.1.
Pipeline layout
The MUSE DRS consists of two layers: 1. Basic processing, including instrumentinternal calibrations like master bias creation and flat-fielding. This was originally planned to be run only using parallel processes, but thanks to updates in the CPL it recently became possible to optionally use full internal parallelization. At the end of this process the data has been converted from CCD-based images to pixel tables. 2. Postprocessing, including on-sky calibration exposures, e. g. flux calibration and sky subtraction. This is internally parallelized using OpenMP (http://www.openmp.org/) as far as possible, and converts the science data from pixel tables into the final datacube. The most important algorithms of the MUSE pipeline have been presented previously, such as the single-resampling paradigm (Weilbacher et al. 2009) and a skysubtraction method adapted to this approach (Streicher et al. 2011). 2.2.
Geometrical calibration
One component that has been developed within the last year and that is now part of the basic instrument calibration is the derivation of the geometry of the instrument, i. e. how the 1152 slices of MUSE are distributed within the field of view. For this, a special calibration sequence, using a multi-pinhole mask is run, vertically shifting the mask in the focal plane so that one can observe how the pinholes subsequently illuminate all slices. Together with known basic properties of the mask, the offsets of the shifts, and the instrument design, this data allows to determine relative location (x and y position)
MUSE Data Reduction Pipeline
3
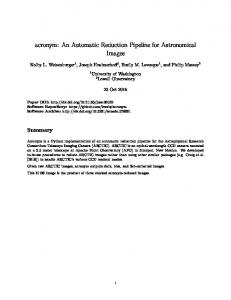
Figure 2. Twenty dithered exposures of a simulated stellar field were successfully combined into one datacube. Here we show the cube plane at 6050 Å of the data part of the cube (left) and the corresponding variance (right). Both panels are displayed in negative linear greyscale. The dither pattern and some instrumental features are visible in the variance but not in the data.
and angle of each slice of each IFU of MUSE. Data taken with another mask (see Fig. 1) after the exposure sequence can be used to verify the output of the procedure.
3.
Testing
The main effort in the past year was related to testing the various parts of the MUSE pipeline. While in previous years we were able to check performance only on singleIFU data, the instrument was completely assembled over the last months (Caillier et al. 2012), so that we could now get multi-IFU data from exposures taken with the internal calibration unit (Kelz et al. 2012). All important pipeline calibrations (bias, flat-fields, wavelength calibration) could be verified against specifications, and a datacube containing data from all 24 IFUs could finally be created in June 2013. At the same time, data of different astrophyical scenes, simulated with the instrument numerical model (INM; Jarno et al. 2012), was processed by the pipeline. The datacubes created by this were then used to support development of higher-level analysis tools for the different science objectives (Richard et al. 2012), such as extracting stellar spectra from dense stellar fields (Kamann et al. 2013) or detection of Lyman-α emitters (Herenz et al. in prep.). Such a reduced exposure, combined from 20 single exposures, is presented in Fig. 2. For more details on performance with simulated science data see Weilbacher et al. (2012). Apart from such manual testing, two automated testing methods were implemented during the last years: A suite of unit-testing programs and an automated nightly reduction. The former was partly developed together with the MUSE pipeline library functions, with dedicated test data. It is automatically run on several of the development machines, and manually before committing more complex code changes to the development repository. It immediately reports unforeseen problems with code changes, and
Weilbacher et al.
4
code coverage by the unit tests. The nightly reduction also checks the outer layer of the data reduction, the recipes. It does a full data reduction (for speed reasons on a subset of the 24 IFUs) and reports unforeseen problems. Before doing major changes, the results of such a reduction session are saved as reference dataset. This approach has so far successfully alerted the developers whenever code changes had unexpected side effects, allowing for quick bug fixing (or back-outs). A test report was delivered to ESO for PAE, which included results of the above testing, plus a few tests designed to verify performance against the requirements. 4.
Conclusions and Outlook
Since the MUSE instrument, including the data reduction system, passed the PAE and is being shipped to Paranal, attention on the DRS now turns to work necessary to prepare the pipeline for on-sky commissioning. The geometrical calibration described above still has to be tuned to improve its accuracy before the instrument is pointed to the sky. Since the INM is not a perfect representation of instrument and sky, specific points can only be addressed with on-sky data. These include measuring the throughput curve from standard stars, and in which way it is going to be applied to MUSE data (smoothing, rejection of outliers). The correction for differential atmospheric refraction has to be checked on the real sky as well. A calibration of the relative strengths of the night-sky emission lines is necessary for an effective sky subtraction. Acknowledgments. PMW, OS, and TU are grateful for support by German Verbundforschung through the ”MUSE/D3Dnet” project (grant 05A11BA2). References Bacon, R. et al. 2012, The Messenger, 147, 4 Caillier, P. et al. 2012, in Modeling, Systems Engineering, and Project Management for Astronomy V, vol. 8449 of Proc. SPIE Jarno, A., Bacon, R., P´econtal-Rousset, A., Streicher, O., & Weilbacher, P. 2012, in Software and Cyberinfrastructure for Astronomy II, vol. 8451 of Proc. SPIE Kamann, S., Wisotzki, L., & Roth, M. M. 2013, A&A, 549, A71 Kelz, A. et al. 2012, in Ground-based and Airborne Instrumentation for Astronomy IV, vol. 8446 of Proc. SPIE McKay, D. J. et al. 2004, in Optimizing Scientific Return for Astronomy through Information Technologies, edited by P. J. Quinn, & A. Bridger, vol. 5493 of Proc. SPIE, 444 Pizagno, J., Streicher, O., & Vriend, W.-J. 2012, in ADASS XXI, edited by P. Ballester, D. Egret, & N. P. F. Lorente, vol. 461 of ASP Conf. Ser., 557 Richard, J. et al. 2012, in SF2A-2012, edited by S. Boissier, P. de Laverny, N. Nardetto, R. Samadi, D. Valls-Gabaud, & H. Wozniak, 553 Streicher, O., & Weilbacher, P. M. 2012, in ADASS XXI, edited by P. Ballester, D. Egret, & N. P. F. Lorente, vol. 461 of ASP Conf. Ser., 853 Streicher, O., Weilbacher, P. M., Bacon, R., & Jarno, A. 2011, in ADASS XX, edited by I. N. Evans, A. Accomazzi, D. J. Mink, & A. H. Rots, vol. 442 of ASP Conf. Ser., 257 Str¨obele, S. et al. 2012, in Adaptive Optics Systems III, vol. 8447 of Proc. SPIE Weilbacher, P. M., Gerssen, J., Roth, M. M., B¨ohm, P., & P´econtal-Rousset, A. 2009, in ADASS XVIII, edited by D. A. Bohlender, et al., vol. 411 of ASP Conf. Ser., 159 Weilbacher, P. M., Streicher, O., Urrutia, T., Jarno, A., P´econtal-Rousset, A., Bacon, R., & B¨ohm, P. 2012, in Software and Cyberinfrastructure for Astronomy II, vol. 8451 of Proc. SPIE