The Partition Matrix: Exploring Variable Phylogenetic Signals Along Nucleotide Sequence Alignments Ingrid B. Jakobsen, * Susan R. Wilson,? and Simon EasteaP *Human Genetics Group, John Cm-tin School of Medical Research, Mathematics and Its Applications, Australian National University
Australian
National University;
and jCentre
for
The partition matrix is a graphical tool for comparative analysis of nucleotide sequences following alignment. It is particularly useful for investigating the divergent phylogenies of sequence regions undergoing reticulate evolution. A partition matrix is generated by determining the consistency of the parsimoniously informative sites in a set of aligned sequences with the binary partitions inferred from the sequences. Since the linear order of sites is maintained, the matrix can be used to assess whether the distribution of sites either supporting or conflicting with particular partitions changes along the length of the alignment. The usefulness of the matrix in allowing visual identification of differences in evolutionary history among regions depends on the order in which partitions are shown; several suitable ordering schemes are proposed. We demonstrate the use of the partition matrix in interpreting the evolution of the pseudoautosomal boundary region on the sex chromosome of catarrhine primates. Its routine use should help to avoid attempts to derive single phylogenies from sequences whose evolution has been reticulate and to identify the gene conversion or recombination events underlying the reticulation. The method is relatively fast. It is exploratory, and it can form the basis for more formal analysis, which we discuss.
Introduction An implicit assumption of most methods for phylogenetic reconstruction of molecular sequences is that the sequences have one consistent evolutionary history along their entire length and, thus, that a single phylogeny can be recovered. The sites in the aligned sequences are treated as though they could have occurred in any order. It is possible, however, that different regions of the alignment have different evolutionary histories due to reticulate evolution caused by recombination or gene conversion. Reticulate evolution is known to occur in many different contexts, and molecular data sets containing regions with distinct phylogenetic histories include multigene families (e.g., Fitch et al. 1990), virus strains (e.g., Robertson, Hahn, and Sharp 1995), and bacterial genes (e.g., Guttman and Dykhuizen 1994). A number of methods have been proposed for detecting reticulate evolution in nucleotide sequences. These differ in approach and applicability. They include displays of compatibility (Sneath, Sackin, and Ambler 1975), tests for clustering (Stephens 1985), a randomization approach (Sawyer 1989), and an extension of the parsimony method of phylogenic reconstruction that allows recombination (Hein 1993). It is difficult to meaningfully compare the results of these methods, as they are very different from each other. They each have features that make them useful for analysis of particular types of data, and they all have a role to play in detecting reticulate evolution. Previously, we presented a computer program (Jakobsen and Easteal 1996) to calculate and display compatibility matrices (Sneath, Sackin, and Ambler 1975) that allows the easy detection of regions of sequence with distinct evolutionary histories and the location of Key words: nucleotide sequence analysis, reticulate evolution, combination, gene conversion, pseudoautosomal boundary.
re-
Address for correspondence and reprints: Ingrid Jakobsen, Human Genetics Group, JCSMR, ANU, Canberra ACT 0200, Australia. E-mail:
[email protected]. Mol. Biol. Evol. 14(5):474-484. 1997 0 1997 by the Society for Molecular Biology and Evolution.
474
ISSN: 0737-4038
boundaries between them. The method makes few assumptions about the data; in particular, it does not assume the existence of a single phylogeny. This and its graphical nature make it particularly useful for exploratory analysis. Once regions with distinct histories have been identified, it is often of interest to determine which sequence relationships have changed to cause the observed pattern of reticulate evolution. One approach that retains the advantages of the compatibility matrix is to assess, for individual sites, support and conflict for binary partitions, equivalent to possible branches in a sequence phylogeny, on the basis that if reticulate evolution has occurred, different alignment regions will support different sets of partitions. Previously, such support and conflict have been evaluated only for entire sequence alignments, without investigating possible variation along their length (Lento et al. 1995). The partition matrix is a condensed graphical summary of the phylogenetic information along the sequence alignment. It is relatively information-dense and is usually best generated following the construction of a compatibility matrix. We have implemented this approach in a computer program suitable for analysis of DNA sequences. It has wide applicability, and, in the following, we demonstrate its usefulness by investigating the pseudoautosomal boundary region of the sex chromosomes of catarrhine primates. Principle First, consider a particular binary partition of a set of sequences, dividing the sequences into two mutually exclusive groups. Among all the topologically distinct trees that could be constructed to represent the phylogeny of the sequences, some will contain a branch that corresponds to this partition: all the sequences in one group of the partition are on one side of the branch, while all members of the other group are on the other side of the branch. We define trees with such a branch as being indicative of the bipartition. In all other trees, sequences from at least one of the groups appear on both
--
-
___
Sequence Partition
Sites X
0 0 0 a
l
seql seq2 seq3 seq4 seq5
Y
2
..C.............A............T ..C.............G............G ..C.............A............T ..T.............G............G ..T.............G............T
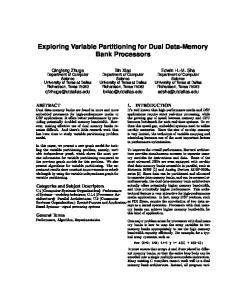
IX 3: FIG. l.-The principle text under Principle.
of the partition
...... ...... ...... ...... ......
x
matrix, as explained
in the
sides of every branch of the tree. In figure 1, one of the possible bipartitions of five sequences is shown, grouping the first three sequences (indicated by empty circles) against the last two (indicated by filled circles); in the trees indicative of the partition, the corresponding branch is marked. Now consider a variable site in a nucleotide sequence alignment. The site defines mutually exclusive groups of sequences, namely the groups of sequences all sharing a particular nucleotide. If the groups defined by the site are the same as the groups of a particular partition, the site is said to be identical to that partition. In figure 1, site x is identical to the partition being considered. For any variable site in a nucleotide sequence alignment, we can also identify the possible trees in which the minimum number of nucleotide changes, c, is one less than the number of different nucleotides observed, n. In figure 1, all such trees for each of the sites, x, y, and z, are shown below the sites. For each site, any other tree of the five sequences will have c greater than n - 1. When a site is identical to a given partition, all trees with c = n - 1 will be indicative of the partition, as shown for site x. A site in the sequence alignment is said to be consistent with the partition if there is at least one tree with c = n - 1 that is indicative of the partition; in figure 1, y is an example of a site consistent with the partition. A site is said to be inconsistent with the partition if none of the trees for which c = n - 1 is indicative of the partition; this is the case for site z in figure 1. The concept of sites being consistent or inconsistent with a partition is similar to the concept of compatibility or incompatibility between two sites. We will concentrate on parsimoniously informative (PI) sites, that is, sites where at least two nucleotides
Analysis
Using the Partition
Matrix
475
are present in at least two sequences each, because other sites do not contribute information about consistency and inconsistency. At a site where only one nucleotide occurs in more than one sequence, c = n - 1 for any possible tree; consequently, the site is consistent with all partitions. Similarly, all trees are indicative of trivial partitions, i.e., those that group only one sequence apart from the rest, and so trivial partitions cannot show changes in consistency along a sequence alignment. Since for k sequences there are 2ck- l) - k - 1 different nontrivial bipartitions, we generally restrict attention to those partitions to which one or more sites are identical (see Implementation for details). The level of support for the partition is defined as the number of sites identical to the partition. The raw level of conflict for the partition is the number of sites inconsistent with the partition. In figure 1, the support for the illustrated partition is 1 (site x) and the raw conflict score is also 1 (site z), while the partition grouping sequences 1 and 3 (which site y is identical to) has support 1 and conflict 0. It is possible to determine for each PI site in the alignment whether it is identical to, consistent with, or inconsistent with each partition. This can be represented graphically by a matrix, with the partitions labeling the columns of the matrix and the PI sites labeling the rows. It is possible both to assess support and conflict for each partition and to observe how these are distributed along the length of sequence. Each site can be considered in the context of its neighbors to determine which partitions have more or less support in a given region of the sequence alignment, and any changes in the pattern of partition consistency would suggest reticulate evolution.
Implementation We have implemented the partition matrix method in a computer program, “partimatrix” which analyzes aligned DNA sequences. The program first identifies all PI sites, and the partitions to be included are determined. Each bipartition is identified by a binary number which allows reconstruction of the partition. Each sequence in the alignment is consecutively assigned a power of two, so the first sequence is 1, the second is 2, the third is 4, etc. The bipartition is then identified by the sum of the powers of two corresponding to the sequences in one group of the partition. Since it is possible to assign two such numbers for each binary partition, the smaller number is chosen by convention, equivalent to the group of sequences which does not include the final sequence. We have found it most convenient to refer to partitions by the hexadecimal equivalent of their binary numbers, where A = 10, B = 11, etc. For example, the partition 110 1110 would be described as 6E in hexadecimal. A PI site that is identical to a binary partition contributes a score of 1 to the overall support for that partition. When a site has more than two nucleotides, is part of a sequence gap, or has missing information, it is not straightforward to assign it to a binary partition. A variety of approaches are possible. In accordance with the observation that transition substitutions generally occur more frequently than transversions (Li and Graur
476
Jakobsen
et al.
1991), we have chosen to convert sites with several nucleotides to binary partitions by considering only transversion substitutions so that A and G are equivalent, and C and T (or U) are equivalent. Sites where information is missing or there is a gap in only one sequence are converted to two temporary sites by assigning the missing sequence in turn to each of the groups formed by the remaining sequences, and a score of 0.5 is added to the support for the bipartitions to which these temporary sites are identical. For sites at which several sequences are missing information, we have chosen not to assign support for any partition. The original data from such sites are saved, and the sites are later displayed as part of the matrix, and their consistency with each partition is determined. The partitions that sites are found to be identical to, or provide support for, become the partitions to be considered; in other words, all partitions with at least 0.5 support. Since a site can only be identical to one partition but can be inconsistent with many partitions, the raw conflict scores against each partition are generally much larger than the support scores. Each conflict score is normalized by multiplying it by the sum of all support scores divided by the sum of all (raw) conflict scores for all included partitions. In this way, the total support and conflict scores over all partitions are identical (Lent0 et al. 1995). Each PI site is then scored as identical to, consistent with, or inconsistent with each included partition. This information forms the partition matrix (see fig. 2 for an example). Each observed partition is displayed as a column labeled with its hexadecimal identifier. The PI sites are displayed as rows, with their positions in the original alignment shown to the right of the matrix. Each site’s status with respect to each partition is represented in the square at the intersection of the partition and the site. The square is colored white if the site is consistent and black if the site is inconsistent with the partition. If the site is identical to the partition, the square is marked with a small dot; for example, site 5 is identical to partition 3F in figure 2. If the site has been temporarily split into two sites and half support has been assigned to two partitions, then those partitions are indicated with a diagonal line through the square; in figure 2 this can be seen for site 61, which added 0.5 to the support for partitions 3F and 37. The relative support for each partition is displayed as a white, upward-pointing column,
FIG. 2.-Example of a partition matrix. The data set is the homologous sequence from the pseudoautosomal boundary region in catarrhine primates. Each column represents a partition observed in the data, while each row represents a parsimoniously informative site. A site consistent with a partition is represented by a white square, while an inconsistent site is represented by a black square. White squares marked with a small dot indicate the sites that are identical to a given partition, and squares with a diagonal line represent sites that provide half support for two partitions (see text for details). Above the matrix, the overall support and conflict for each partition are represented using a LentoPlot, followed by a graphic display of the partition’s grouping of sequences. The gene map on the right shows the Ah proximal, Ah, and Alu distal regions of the sequence.
Chimp Y H-Y Gorilla Y OrangutanY Macaque Y Gelada Y Chimp X H-X Gorilla X orangutanx Macaque X Guenon X Gelada X
Sequence
and the relative conflict is displayed as a black, downward-facing column; these form a LentoPlot (Lento et al. 1995) above the matrix itself. The order of parsimoniously informative sites is dictated by the sequence, whereas the order of the partitions is arbitrary. However, visual detection of changes in partition support along the alignment can be improved by suitable ordering of the partitions. Partitions can be sorted based on their levels of support; conflict; or support minus conflict (predictor of bootstrap, Lento et al. 1995). The partitions can also be compared pairwise and ordered based on similarity to each other with respect to their pattern of consistency and inconsistency along the sequences (see appendix for details). It is also possible to specify an order for the partitions or discard partitions from the matrix, for example, those with little support or a high level of conflict. Apart from visual identification of partitions showing changes in consistency among the PI sites, it is possible to perform a variety of statistical tests to determine if there is clustering of consistent and inconsistent sites within any given partition. These tests include the distribution of runs of consistent or inconsistent sites, length of longest run, and whether adjacent sites are both consistent or both inconsistent more often than expected; we describe some of these tests in part 2 of the appendix. We have chosen, for relatively small data sets, to include a display of the actual partitions as seen in figure 2. The sequences are listed in order, and black and white circles are used to indicate which sequences are grouped together by each partition. The sequences marked with black circles belong to the smaller of the two groups defined by each partition; the color does not refer to any consistency or inconsistency of the individual sequences. Application We demonstrate the partition matrix using sequence data from the pseudoautosomal boundary region on the sex chromosomes of catarrhine primates. The X and Y sex chromosomes of mammals occur together in males, but they do not pair or recombine during meiosis except at the short telomeric, pseudoautosomal regions. The boundary region between the pseudoautosomal and sexchromosome-specific regions has been sequenced on the short arm of the X and Y chromosomes in a number of catarrhine primates (Ellis et al. 1990). Adjacent to the boundary is a short stretch of sequence that is shared by the X and Y chromosomes but does not appear to be involved in recombination. Telomeric to this is the region in which recombination occurs. According to Ellis et al. (1990), the boundary is quite distinct and is marked by an Ah repeat in the Y chromosome of the Great Apes (including humans, Homo sapiens). Regions on the X and Y chromosome that have not recombined since the divergence of the species under consideration are expected to show grouping of all X-chromosome-specific sequences against all Y-chromosome-specific sequences when a phylogeny is con-
Analysis
Using the Partition I-~
Matrix
chimp
477
I
human d
I
gorilla
X
I X I X I X I
chimp
Y
human
Y
gorilla
Y
orangutan
Y
X Y
I
X Y
I
gelada macaque
FIG. 3.-Expected relationships between X and Y chromosome sequences in primates. A, No recombination between the X and Y chromosomes. B, Frequent recombination between the X and Y chromosomes in each species, as found in the pseudoautosomal region.
strutted. The internal phylogeny within each chromosomal cluster is expected to correspond to the primate phylogeny (fig. 3A). On the other hand, if recombination occurs frequently, sequences are expected to group based on their species of origin rather than chromosome of origin. The overall phylogeny would then be expected to correspond to the primate phylogeny, with the X and Y chromosome sequences of each species joined by terminal nodes in the phylogeny (fig. 3B). Intermediate levels of recombination will lead to a phylogeny that is intermediate between these extremes. We first aligned the pseudoautosomal boundary sequences from the X and Y chromosomes of catarrhine primates (GenBank accession numbers M55450M55462), omitting centromeric nonhomologous sexchromosome-specific sequences. The final alignment thus contains a sex-chromosome-specific Ah proximal region covering sites 1 to 234, an Ah element present only in the Great Ape Y chromosome sequences (sites 235 to 547), and a recombining Ah distal region (sites 548 to 768). The partition matrix is generally best employed as a second step following construction of a compatibility matrix. We therefore first consider the compatibility matrix of the pseudoautosomal boundary region, as shown in figure 4. Two distinct regions can be clearly seen, each of which is internally highly compatible, but not compatible with the other. The statistical significance of the clustering of compatible and incompatible site comparisons was assessed using the neighbor similarity score (Jakobsen and Easteal 1996). The neighbor sirni-
478
Jakobsen
et al.
FIG. 4.-Compatibility matrix of the same data set as in figure 2. All parsimoniously informative sites in the sequence alignments are shown, and the compatibility of any two sites is represented by a white square, with incompatibility represented by a black square. The matrix of all comparisons is triangular but is shown as a square, symmetical about the diagonal. The gene map of the Alu proximal, Ah, and Ah distal regions is also shown.
larity score of the matrix was not matched by any of 10,000 synthetic matrices, each containing a random order of the parsimoniously informative sites in the data. The boundary between the regions is marked by nine sites largely compatible with both regions but showing some internal incompatibility. Four of these sites (265, 279, 379, and 405 in the current alignment) are from the Ah sequence on the ape Y chromosome. There are some additional sites, 224, 226, and 23 1 in the Ah proximal region and 560 in the Ah distal region, which are also compatible with both regions. The Ah thus marks the boundary as claimed previously, although the boundary can occur anywhere between positions 223 and 576 of the current alignment. The partition matrix of the same sequences is shown in figure 2. The partitions have been sorted in order of least conflict to most conflict in the current example. While it might be expected that partitions with high support have low conflict and vice versa, it can be seen that this is not the case. The two partitions with the most support, 3F and 3CF, both show some conflict, while one partition, 3, shows virtually no support or conflict. On the other hand, all the partitions with the greatest conflict have very low support. Two of these
partitions (3F7 and C38) may be artifacts of the method whereby sites with missing data provide partial support for two partitions. It is almost certain that support for the other high-conflict partitions comes from individual sites in which the same substitution has occurred independently in different sequences. Inspection of the sites also reveals that the partition matrix includes one site (327 in the alignment) not present in the compatibility matrix. This is due to the fact that sites with multiple nucleotides are converted to binary partitions by the partimatrix program; whereas such conversion is not required when constructing a compatibility matrix. When considering the distribution of consistency and inconsistency along the length of sequence, it is seen that the first six partitions have almost no conflict along the entire sequence. The sites in the Ah proximal region are consistent with the next seven partitions, but the AZu distal region is inconsistent. For the next nine partitions, the AZu distal region of sequence shows proportionately more consistency, while there is relatively high inconsistency overall for the last four partitions. Therefore, in this particular case, sorting in order of overall conflict, which does not take distribution of consistency along the sequence into account, results in a
Sequence
useful order for interpretation of the histories of the two regions. This is due to the relatively smaller number of parsimoniously informative sites in the second region. In more complex cases, it may be necessary to order the partitions so that those partitions consistent with a particular region are shown next to each other. In order to facilitate this, the similarity of the partitions to each other, with respect to the distribution of consistent and inconsistent sites, can be calculated as described in the appendix. The 11 sites which were consistent with all partitions were omitted, and the similarity scores between pairs of partitions, determined using the remaining 76 sites, are shown in table 1. A high positive score indicates high similarity between two partitions, a score of zero means that the partitions are as similar as could be expected at random, and a negative score indicates that the partitions are relatively dissimilar. The scores suggest a slightly different ordering of partitions than that based on least to most conflict. In particular, of the first six partitions, 3C0 shows most similarity to the next block of seven (g to m), which are generally consistent with the Alu proximal region. Not surprisingly, the nine partitions consistent with the Alu distal region (n to v) show considerable dissimilarity to the previous seven (g-m). However, of the last four partitions, three show high similarity with n-v, and in particular 3CB is also dissimilar to the AZu proximal group, g-m. Only th e partition with the most overall conflict, 944, shows no clear clustering with either of the partition groups g-m or n-v. Partitions a to d, with which most sites are consistent, are those that group the ape Y chromosome sequences together, the Old World monkey Y chromosome sequences together, and the Old World monkey X chromosome sequences together. The partition with the most support in the Alu proximal region is 3F; it distinguishes all Y sequences from all X sequences, as expected in a sex-chromosome-specific region. The partition with the most support in the Alu distal region, 3CE groups all the Old World monkey sequences against all the ape sequences. Support for this partition is evidence for at least one recombination event between the X and Y chromosomes since the divergence of the ape and Old World monkey taxonomic groups. There is less support for recombination subsequently, i.e., within the apes or within the Old World monkeys. This is reflected in the nature of the partitions with lowest conflict, grouping the X or Y sequences from within each of those taxonomic groups. If recombination had occurred at this level, we would expect support for partitions grouping the X and Y sequences from the same species rather than for sex-chromosome-specific groups. This can be further explored by examining the graphic display of partitions above the partition matrix itself. For example, all included partitions group macaque (Macaca sylvanus) and gelada (Theropithecus geZada) Y chromosome sequences; this is reflected in the lack of conflict of any site with partition 30. Similarly, only one partition (3E) does not group human and chimpanzee (Pan troglodytes) Y chromosome sequences, and its support comes from only one site (46). We have
Analysis
Using the Partition
Matrix
479
found that when investigating larger data sets with more complex evolutionary histories it may be advantageous to reduce the data set by excluding all but one of each group of sequences which is not divided by any observed bipartition. The smaller alignment is then analyzed using both compatibility and partition matrices. It has previously been suggested (Ellis et al. 1990) that the pseudoautosomal boundary is sharp in humans and Old World monkeys but more diffuse in orangutans (Pongo pygmaeus). We examined the distribution of sites supporting clustering of the orangutan X and Y chromosome sequences and compared this to the human X and Y chromosome sequences, and did not observe any difference apart from partition lCF, seen once in position 66 1. We did, however, note that in the Alu distal region there is alternating support and conflict for the grouping of the orangutan Y chromosome sequence with either the other ape or the Old World monkey Y chromosome sequences. This would suggest a recombination event in the African apes since their divergence from the orangutan, represented by partition lC7. Discussion There is increasing interest in detecting reticulate evolution in molecular sequences, and a number of methods are available, for example, those of Stephens (1985), Sawyer (1989), and Hein (1993). There is also considerable interest in measuring both support and conflict for phylogenetic hypotheses (e.g., Bandelt and Dress 1992; Lento et al. 1995); however, these methods do not take the order of nucleotides into account. The partition matrix combines the two approaches, allowing considerable insight into the patterns of phylogenetic signal in a nucleotide sequence alignment. We have illustrated its use with sequence data from the pseudoautosomal boundary region in catarrhine primates. While the compatibility matrix allowed quick detection of recombination in the data set and determination of its location, inspection of the partition matrix provided additional information about the recombination events. It greatly facilitated evaluation of previous conclusions about the evolution of the sequences, without the need for tedious inspection of the original sequence alignment. Certain kinds of variation may not be clear from a compatibility matrix. In particular, highly similar sequences may obscure changes in relationships among other sequences in an alignment. These changes may be detected with a partition matrix by observing the change in the total level of consistency of sites with certain partitions. It is also possible for two regions to be compatible with each other, but show different frequencies of identity or inconsistency with some partitions. In such cases, a partition matrix is needed to determine that the regions have distinct evolutionary histories. The inclusion of highly similar sequences in a data set should be avoided. We have suggested removing such sequences from data sets before analyzing for reticulate evolution, as they cause undue weighting of certain partitions and may obscure the evidence for retic-
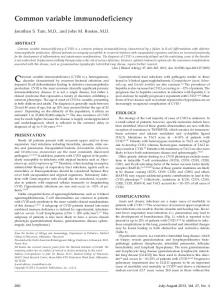
Table 1 Similarity
Scores Between Pairs of Partitions PARTITION
b
f
c
3
7
d 3FF
3:O
F
0.0
0.0 0.7
0.0 -0.2
0.0 -0.2
0.0 0.3
0.0 -0.4
0.5
1.0 0.2
2.0 0.1 2.7
0.1 0.3 0.1 -0.7
$
h
’
.
k
1
3F
317
8:F
43F
34
0.0 -0.4
0.0 0.0
0.0 -0.5
0.0 -0.6
0.0 -0.6
0.9 0.6 2.8 2.3 4.8
1.2 0.4 2.4 3.3 5.1 6.6
0.7 0.3 2.3 1.8 3.5 5.8 4.9
0.6 1.2 2.2 1.6 3.7 6.0 5.0 7.4
t
3GB
CL3
944
0.0 -0.4
0.0 -0.4
0.0 -0.4
0.0 -0.5
0.0 -1.1
1.00 0.96
30 3
:
0.8 0.3 0.7 1.7 -3.5 -2.0 -2.0
-0.2 -0.3 -1.3 -1.6 -2.8 -4.6 -4.6
0.2 1.0 -1.0 -0.9 2.9 1.0 1.8
0.2 0.1 1.3 1.4 -3.2 -2.4 -1.6
0.1 0.4 -1.2 -2.2 1.9 -0.2 -0.4
-1.0 -0.8 -0.7 -1.6 0.4 -0.3 -1.0
0.95 0.92 0.90 0.86 0.78 0.71 0.64
7 3FF 3C0 F 38 3F 37
: e f g h i
-3.4 -3.5 -4.2 -4.6 6.4 5.6 6.2 6.7 3.9 4.1 7.3
-6.0 -6.1 -3.6 -3.2 4.6 5.6 6.7 6.2 2.1 2.7 5.5 3.9
-1.1 -0.7 -0.6 -1.0 5.0 5.5 4.1 3.7 2.8 2.9 3.8 2.7 1.6
-4.0 -4.1 -0.3 - 1.2 5.2 5.2 3.9 3.9 2.5 2.7 4.1 4.7 5.0 1.9
1.3 1.1 -2.9 -2.4 3.5 4.9 3.4 3.0 4.4 4.0 2.2 0.9 0.7 5.3 -0.1
0.0 0.1 0.62 0.59 0.58 -0.8 0.58 -0.3 0.2 0.58 1.2 0.54 1.4 0.50 0.9 0.50 0.0 0.50 1.0 0.49 0.5 0.49 0.2 0.43 2.2 0.41 0.5 0.37 0.5 0.36 1.7 0.30 0.11
43F 83F 34 3E 3CF 3c7 lC7 87 830 FCF 1CF 38F 144 3F7 3CB C38 944
: 1 m n 0 p q r s t u
850
F:F
1CF
3:F
1:4
0.0 -0.2
0.0 -0.2
0.0 -0.2
0.0 -0.2
0.0 -0.2
0.0 -0.3
0.5 0.6 -0.3 -0.9 -1.3 -2.8 -2.5
0.5 -0.9 -1.1 -2.1 -3.7 -3.4
0.9 0.5 -0.9 -0.7 -2.5 -3.7 -3.4
0.0 -1.4 -0.7 -3.4 -4.1 -3.9
-0.5 0.4 -1.9 -1.2 -3.5 -4.7 -4.5
0.4 -1.0 0.2 -3.1 -3.3 -3.1
-3.8 -4.5 -4.0 7.0
-4.8 -5.5 -5.0 6.4 7.6
-4.8 -5.5 -5.0 6.4. 7.1 8.3
-2.1 -3.0 -5.5 -6.4 6.4 4.8 4.1 4.1
-3.2 -2.7 -6.2 -7.1 6.7 5.1 4.4 4.4 7.6
-4.5 -5.2 -5.7 7.1 6.4 7.6 7.1 4.8 5.0
3:7
$7
0.0 -0.6
0.0 -0.1
0.0 -0.2
0.1 0.2 2.1 2.0 4.1 5.4 6.3
0.6 0.2 2.1 1.6 4.5 5.9 5.8
0.1 0.7 -1.1 -0.3 -3.3 -3.8 -3.4
3.6
4.0 4.1 7.6
-4.7 -4.6 -4.8 -5.7
Y
3;
897
3:F
3:
OVERALL CONSISTENCY PARTITION
: x y z
Sequence
ulate events between other sequences. Although the problem is not confined to graphical methods, it is particularly important with this approach, which depends heavily on visual identification of patterns. The partition matrix is not guaranteed to find all regions with distinct phylogenetic histories; however, it is unlikely that such a method will ever exist. Simulations have shown that many recombination events leave no evidence at all (Hudson and Kaplan 1985). Also, although the effects of reticulate events that involve regions with a single polymorphic site can theoretically be detected, they cannot be distinguished from events due to repeated or back mutation (see, for example, Howard 1995). The partition matrix, along with other methods, is nevertheless a valuable tool for detecting reticulate events involving regions that are sufficiently long to avoid these difficulties. In addition to visual inspection of the partition matrix, statistical tests can be performed on the partitions themselves to more formally evaluate the significance of any observed patterns. We have suggested some suitable tests for clustering of consistent and inconsistent sites within a partition. Using results in Feller (1957), Stephens (1985) has developed alternative permutation tests for clustering. These are useful for testing whether a set of specified sites is clustered relative to the regions flanking it and whether subsets of the sites are clustered. Such tests are less applicable for evaluation of consistency among parsimoniously informative sites. Although many other tests could be devised, the ones we have suggested are simple and straightforward and they can provide insight into the nature of clustering of consistent or inconsistent sites within a partition. The partition matrix employs the concept of compatibility, which, along with parsimony, has been criticized for causing systematic errors during phylogenetic reconstruction, particularly due to multiple substitutions and consequent long branch attraction (Hendy and Penny 1989). For this reason, the data in a partition matrix should not be directly interpreted as supporting particular trees. The main purpose of the matrix is to identify regions with distinct evolutionary histories. Phylogenetic analysis can then be carried out on the individual regions, using appropriate methods. Certain other considerations must be borne in mind when using partition matrices, largely to do with converting the nucleotide variability at a site into support for a binary partition. In the current program, a transversion rule has been implemented to convert sites with more than two nucleotides into binary sites. Other approaches are also feasible: for example, the approach of Lento et al. (1995), where each individual nucleotide is considered in turn, assigning fractional scores to several partitions. We have not considered the complexities of determining support for bipartitions from sites in protein alignments. Another problem concerns sites with missing data or gaps in the alignment. In some cases, a gap may be a valid informative character that groups related sequences. However, when data are missing for several sequences, if the nucleotides at the corresponding sites
Analysis
Using the Partition
Matrix
481
in the remaining sequences are used to add support to partitions to which they are identical, the sequences with missing data will be implicitly grouped, and this would generally be inappropriate. Alternatively, a very large number of bipartitions must be considered, assigning each sequence with missing data to each group independently and assigning some fractional score to each such partition. Too many of these bipartitions with fractional support scores would hinder interpretation of the partition matrix. Our approach has been to not assign sites with more than one missing nucleotide to any partition. If there are many alignment gaps and/or unknown sites, this may result in support scores for some genuine partitions being lower than they should be. However, attempting to assign these sites to partitions would increase the scores of spurious partitions along with the genuine partitions. The partition matrix as we have described it includes only parsimoniously informative sites. Alternatively, it would be possible to include all variable sites and the corresponding bipartitions. This may be useful, for example, when the distribution of sites unique to one sequence is of interest. Since such sites and partitions are consistent with all other sites and partitions, they increase the size of the matrix substantially with the addition of columns and rows of white. This effect tends to dilute the impact of patterns of consistency and inconsistency along other partitions. We have found the partition matrix to be a useful tool for investigating nucleotide sequences, particularly for initial exploration following sequence alignment. It has been used to provide insight into the evolution of, among others, primate class I alcohol dehydrogenases, primate y-globins and human p, class glutathione-S transferases (unpublished data). The matrix approach makes no assumptions about the evolutionary history of the sequences, and the graphical display allows patterns to be readily detected. In many cases, inspection of the matrix suggests more specific hypotheses about the data. A particular value of the partition matrix is its ability to suggest which other phylogenetic methods are appropriate for further analysis of the sequences. Availability The program “partimatrix,” for calculating partition matrices, was written in ANSI C. It requires the X11 graphics package for display of the partition matrix on screen, although the program otherwise runs from the command line. The partition matrix can be saved and printed in PostScript format, and a summary of the matrix can be saved as a text file. The source code for “partimatrix” is freely available at http://jcsmr.anu.edu.au/ dmm/humgen.html. Acknowledgments The authors would like to thank Hugh Fisher for developing the Xl 1 graphics module for the program “partimatrix.” They would also like to thank Terry
482
Jakobsen
et al.
Speed, Lars Jermiin, and two anonymous comments on the manuscript.
reviewers
for
APPENDIX
Statistical Analyses Comparison
for Partition Matrices
and Grouping
of Partitions
Suppose there are t partitions to be compared and grouped over s parsimoniously informative sites. Let pi be the proportion of these sites that are consistent (including identical) for the ith partition (i = 1, . . . , t), and let qi = 1 - pi be the proportion of these sites that are inconsistent. Then, under the hypothesis of random allocation of consistent and inconsistent sites, two partitions i and j can be expected to have a proportion of sites ZZi,j = Ppj + qiqj that are either consistent or inconsistent for the two partitions. Suppose 0, is the observed proportion of such sites; then, for all t(t - 1)/2 pairwise comparisons of the partitions, calculate a measure of pairwise similarity (Eve&t 1974, p. 51) Oi,j Si,j
Ei,j
=
VEi,j( 1 - E,)/s
*
(1)
Positive values of S, indicate that more sites are simultaneously consistent or inconsistent with the two partitions i and j than expected. Negative values of Si,j indicate that different sets of sites are consistent with each of the two partitions. Some partitions will be neither very similar to nor very dissimilar from any others. In particular, partitions that are consistent with all or most sites will have similarity scores of around 0. The similarity scores of the partitions shown in figure 2 are shown in table 1. An additional factor which has to be considered is that sites which are consistent with all partitions will give rise to higher similarity scores than would be the case if consistency and inconsistency truly were randomly distributed among the sites. We thus omit such sites from consideration before calculating the similarity between partitions. To allow easy identification of regions that are consistent with different sets of partitions, it is often desirable to order the partitions so that adjacent partitions are as similar as possible. We suggest the following algorithm, which uses the similarity scores calculated above. The pair of partitions, i and j, with the highest similarity score, Si,j, are considered to be adjacent, (i, j). The nexthighest similarity score in the matrix is then identified. If it is between two other partitions, k and Z, these are again considered to be adjacent, (k, 2). If it includes a partition previously considered, for example, Si,k between i and k, partition k is placed adjacent to partition i, creating the order (k, i, j). Since any partition can only be adjacent to two other partitions, similarity scores involving partition i, Si,x, are subsequently ignored. The process continues with the highest remaining similarity score. When several pairs of partitions have the same similarity score, the pair to be considered is chosen arbitrarily from those pairs. At some stages, the pair of partitions with the highest similarity score will both al-
ready be adjacent to other partitions. For example, k and m could be found to have the next-highest similarity score when the ordering already consists of (k, i, j) and (I, m). The new ordering will thus be (j, i, k, m, 1). Similarity scores of the form S,_ and S,,, are then omitted from further consideration. This process is repeated until all partitions are included in the final order. This process does not guarantee the optimal order of partitions in the sense that the sum of similarity scores of adjacent partitions is maximized, but it is rapid, and the order generated has been found to be useful in practice. Alternatively, the partitions can be grouped so that those in the same group have a value of Sij higher than a certain bound. By analogy with statistical significance testing (-5% level) for binomial proportions, a bound of approximately 2 might be a suitable starting value, with the value perhaps going higher to accommodate the multiple testing involved, or lower if a few large groups are desired. Groups of partitions that are quite dissimilar to each other will contain similarity measures between some of their constituent partitions which are very low, for example, less than -2. For partitions with similarity scores close to 0, allocation will depend on context. For example, those partitions that most sites are consistent with may be grouped based on their shared high overall consistency. Evaluation
of Individual
Partitions
Many statistical tests could be used to evaluate whether there is clustering of consistent or inconsistent PI sites within a partition. Here we summarize a few of these tests and note that any formal statistical significance testing would need to incorporate the (usually) inherent multiple testing involved. In other words, often only one test has been chosen, but another would have been chosen if a different pattern of consistent and inconsistent sites had been observed for the partition. In the following, we present the results in terms of clustering of consistent sites, but the arguments can be equally applied to clustering of inconsistent sites. Distribution
of Run Lengths
A first approach to the pattern of consistent sites is to divide the partition into sectors of consecutive consistent sites terminated by an inconsistent site and form the observed distribution of the run length (g) of adjacent consistent sites before the next inconsistent site is reached. If the occurrence of consistent and inconsistent sites is random for the partition, then the expected distribution of g is the geometric distribution Bqpg (Feller 1957, p. 157), where B is the number of inconsistent sites, 4 is the probability of an inconsistent site, and p = 1 - 4, as above. A chi-square goodness-of-fit test can be used to evaluate whether the fit is acceptable. If there appear to be clusters of consistent sites containing no inconsistent sites, their lengths can be evaluated using the renewal theory of recurrent processes. For example, Feller p. 300 (1957, p. 300) shows that the mean and variance of the recurrence times of runs of length g are
Sequence
IJJrt=
(1 - Pgmg
(2)
and
Table 2 Distribution
= (@)-2
- (2g + l)/@
- p/42,
(3)
respectively. For a long sequence of sites, s, the number N, of runs of length g produced is approximately normally distributed. The approximate (a(p) - @(a)) probability limits for N, are (S/k + (xc&‘$-3’2, Distribution
of Successive
s/p + &rs”2~-3’2). Pairs
Iltn
II = Sl - r1,
(5)
12 = s2 - r2,
(6)
and m = rl + r2 -
1,
(7)
where rl is the number of runs of w’s and r2 is the number of runs of b’s; II + Z2 + m = s1 + s2 - 1, as expected. The moments of II, Z2, and m can be easily found (see, for example, Moran 1968, p. 38):
sl(sI - ‘)
(8)
S and E(Z;) =
S1(S, -
1) + 2SdSl - MS* - 2)
S
+ s(s -
s(s
l),
’
(9)
for Z2, and
E(m) = 2(s -
l)pq
(10)
= 2(s -
l)pq
+ 2(s - 2)pq
+ 4(s - 2)(s - 3)$q?
of Total Number
11.77 7.44 4.70 2.97 5.12
5
2
_ -
Example: Evaluating (See Fig. 2)
%s2 s
(12)
’
2SlS2(2SlS, s2(s
-
Clustering
1)
s)
(13)
*
Within
Partition
3CF
Test
The observed distribution of runs of consistent sites for partition 3CF is given in table 2. For our example, the maximum-likelihood estimate of 4 is 32/87, and the expected distribution is given in table 2. Although the fit is acceptable, indicating overall agreement with the null hypothesis of random location of inconsistent sites, the variance of the observed distribution, 12.47, significantly exceeds that of the fitted distribution (p/q2 = 4.67; x31, = 31 X 12.47/4.67 = 82.8; P < 0.001). Two apparent clusters of consistent sites are found, of lengths 14 and 15. To evaluate the significance we take r = 14, 4 = 32/87, and approximate 99% probability limits for N, are (0, 0.64). So both these clusters are statistically significant departures (at about the 99% level) from random expectation. Pairs Test
For partition 3CF we find: s1 = 55, observed I, = 39, E(Z,) = 34.14, standard deviation 2.19; s2 = 32, observed Z2 = 16, E(Z,) = 11.4, standard deviation 2.18; observed m = 3 1, E(m) = 40.0, standard deviation 4.9 1. An excess of observed ww and bb pairs is indicated. Total Number
of Runs Test
(11)
For large s, normal distributions could be assumed for the distribution of the observed number of pairs. There are many generalizations in various directions of this type of test. Distribution
Frequency
For partition 3CF, s1 = 55, s2 = 32, and rl + r2 = 32. The expected number of runs is 40.46, with standard deviation 4.3 1, indicating less, but not significantly less, runs in the partition than one would expect by chance.
and E(m2)
Expected
2 3
=
gt”
Successive
1)
l)(s - 2)(s - 3) s(s -
and analogously
-
483
Sites in 3CF
Frequency 16 6
........ ........ ........ ........
Runs Length
=
Observed
Matrix
(4)
Let w denote a consistent site, of which there are sl, and let b denote an inconsistent site, of which there are s2. Then, we may be interested in the number of successive pairs of the form ww or wb. If II, Z2, and m are the numbers of pairs ww, bb, and (wb or bw) we have
E(Z,)
g
0 . . .. .. . .
1 2 3 >3
Using the Partition
of Runs of Consistent
Run Length,
a;
Analysis
of Runs
Feller (1957, p. 60) and Takahata (1994) give exact formulae for the probability of the total number of runs (rl + r2). If s1 and s2 are both more than 10, the distribution of the total number of runs is approximately normal, with
LITERATURE
CITED
BANDELT, H.-J., and A. W. M. DRESS. 1992. Split decomposition: a new and useful approach to phylogenetic analysis of distance data. Mol. Phylogenet. Evol. 1:242-252. ELLIS, N., l? YEN, K. NEISWANGER, L. J. SHAPIRO, and F? N. GOODFELLOW. 1990. Evolution of the pseudoautosomal boundary in Old World monkeys and great apes. Cell 63: 977-986. EVERITT, B. 1974. Cluster analysis. Heinemann Educational Books, London. FELLER, W. 1957. An introduction to probability theory and its applications. 2nd edition. John Wiley, New York, N.Y.
484
Jakobsenet al.
FITCH, D. H. A., C. MAINONE,M. GOODMAN,and J. L. SLIGHTOM. 1990. Molecular history of gene conversions in the primate fetal y-globin genes. J. Biol. Chem. 265:781-793. GUTTMAN,D. S., and D. E. DYKHUIZEN.1994. Clonal divergence in Escherichia coli as a result of recombination, not mutation. Science 266: 1380-1383. HEIN, J. 1993. A heuristic method to reconstruct the history of sequences subject to recombination. J. Mol. Evol. 36: 396-405. HENDY, M. D., and D. PENNY. 1989. A framework for the quantitative study of evolutionary trees. Syst. Zool. 38:297309. HOWARD,J. 1995. Not all converted yet. Nat. Genet. 10:371373. HUDSON,R. R., and N. L. KAPLAN. 1985. Statistical properties of the number of recombination events in the history of a sample of DNA sequences. Genetics 111:147-l&%. JAKOBSEN,I. B., and S. EASTEAL. 1996. A program for calculating and displaying compatibility matrices as an aid in determining reticulate evolution in molecular sequences. CABIOS 12:291-295. LENTO,G. M., R. E. HICKSON,G. K. CHAMBERS,and D. PENNY. 1995. Use of spectral analysis to test hypotheses on the origin of pinnipeds. Mol. Biol. Evol. 12:28-52.
LI, W.-H., and D. GRAUR. 1991. Fundamentals of molecular evolution. Sinauer, Sunderland, Mass. MORAN,P. A. I? 1968. An introduction to probability theory. Clarendon Press, Oxford. ROBERTSON,D. L., B. H. HAHN, and I? M. SHARP. 1995. Recombination in AIDS viruses. J. Mol. Evol. 40:249-259. SAWYER,S. 1989. Statistical tests for detecting gene conversion. Mol. Biol. Evol. 6:526-536. SNEATH,I? H. A., M. J. SACKIN, and R. I? AMBLER. 1975. Detecting evolutionary incompatibilities from protein sequences. Syst. Zool. 24:3 1 l-332. STEPHENS,J. C. 1985. Statistical methods of DNA sequence analysis: detection of intragenic recombination or gene conversion. Mol. Biol. Evol. 2:539-556. TAKAHATA,N. 1994. Comments on the detection of reciprocal recombination or gene conversion. Immunogenetics 39: 146-149. PAUL M. SHARP, reviewing
Accepted
January
22, 1997
editor