The rate and equilibrium constants for a multistep reaction sequence for the aggregation of superoxide dismutase in amyotrophic lateral sclerosis Sagar D. Khare, Michael Caplow*†, and Nikolay V. Dokholyan*† Department of Biochemistry and Biophysics, University of North Carolina, Chapel Hill, NC 27599 Communicated by Richard V. Wolfenden, University of North Carolina, Chapel Hill, NC, September 9, 2004 (received for review July 7, 2004)
Mutation-induced aggregation of the dimeric enzyme Cu, Zn superoxide dismutase 1 (SOD1) has been implicated in the familial form of the disease amyotrophic lateral sclerosis, but the mechanism of aggregation is not known. Here, we show that in vitro SOD1 aggregation is a multistep reaction that minimally consists of dimer dissociation, metal loss from the monomers, and oligomerization of the apo-monomers: koff
km⫺
kagg
Dholo | L ; 2Mholo | L ; 2Mapo O ¡ A, kon
km⫹
where Dholo, Mholo, Mapo, and A are the holo-dimer, holo-monomer, apo-monomer, and aggregate, respectively. Under aggregationpromoting conditions (pH 3.5), the rate and equilibrium constants corresponding to each step are: (i) dimer dissociation, Kd ⬇1 M; koff ⬇ 1 ⴛ 10ⴚ3 sⴚ1, kon ⬇1 ⴛ 103 Mⴚ1䡠sⴚ1; (ii) metal loss, Km ⬇0.1 ⴚ ⴙ M, km ⬇1 ⴛ 10ⴚ3 sⴚ1, km ⬇1 ⴛ 104 Mⴚ1䡠sⴚ1; and (iii) assembly (rate-limiting step), kagg ⬇1 ⴛ 103 Mⴚ1䡠sⴚ1. In contrast, under near-physiological conditions (pH 7.8), where aggregation is drastically reduced, dimer dissociation is less thermodynamically favorable: Kd ⬇ 0.1 nM, and extremely slow: koff ⬇3 ⴛ 10ⴚ5 sⴚ1, kon ⬇3 ⴛ 105 Mⴚ1䡠sⴚ1. Our results suggest that familial amyotrophic lateral sclerosis-linked SOD1 aggregation occurs by a mutationinduced increase in dimer dissociation and兾or increase in apomonomer formation.
A
myotrophic lateral sclerosis (ALS) involves selective motor neuron death in the brain and spinal cord (1–6), initiating a progressive paralysis in midlife. Point mutations in the cytoplasmic homodimeric enzyme Cu, Zn superoxide dismutase 1 [SOD1, molecular mass (Mm) ⬇ 32 kDa] were identified as the primary cause of ⬇20% cases of the familial form of ALS (FALS) (7, 8) in contrast with the sporadic form. Approximately 90 distinct FALS mutations are known (9). The toxic gain-of-function of the mutants is believed to be associated with either intracellular misfolding and aggregation or oxidative damage caused by mutant SOD1catalyzed aberrant reactions, although the two scenarios may not be mutually exclusive (10, 11). The aggregation hypothesis is supported by the observations that in both mice and cell culture models death of motor neurons is preceded by formation of cytoplasmic aggregates containing mutant SOD1 (12–15), SOD1 knockout mice do not develop motor neuron disease (16), and even Cu-depleted SOD1 mutants cause the disease in mice (17). Although aggregation of SOD1 has also been found in some cases of sporadic ALS (18–20), the sporadic disease is believed to have a different molecular basis (1). FALS and SOD1-linked sporadic ALS may belong to the general class of protein conformational disorders in which perturbation of protein folding leads to a relatively higher population of misfolded or partially folded (21) protein molecules, which then aggregate into regular (22) structured fibrils. Toxicity may arise because of the saturation of the cellular chaperone machinery by misfolded or aggregated SOD1 molecules (23). ALS is an age-related disease occurring in midlife or later, and it is not surprising that the in vitro aggregation of SOD1 solutions
15094 –15099 兩 PNAS 兩 October 19, 2004 兩 vol. 101 兩 no. 42
under physiological conditions is slow. Therefore, it is common to study SOD1 aggregation by perturbing the environmental conditions, lowering the pH to 3.5 (24), adding mild denaturants such as trifluoroethanol, or using heat treatment (25), such that disease-like aggregates can be detected on experimental time scales. Aggregation-prone FALS mutations and兾or loss of metals also decrease SOD1 stability (26, 27), indicating that exposure to nonphysiological conditions, such as low pH, mimics the effect of mutation by similarly lowering the barrier for SOD1 aggregation. Although the rate of aggregation can be enhanced in vitro, the molecular mechanism of SOD1 aggregation is not well understood. We show here that the relatively rapid aggregation of SOD1 that results from perturbations in the environmental conditions occurs because these conditions promote dimer dissociation and兾or the loss of metals and that the thus-formed apo-monomers undergo multimeric assembly. We propose that this same reaction path holds for some or all FALS mutant forms of SOD1 and that increased aggregation results from perturbation of one or more of the steps in the pathway demonstrated here: dimer dissociation, metal loss from monomers, and aggregation of apo-monomers. Methods Protein and Buffers. Bovine and human erythrocyte Cu, Zn SOD
(EC 1.15.1.1) were obtained from Sigma. Protein concentration was measured spectrophotometrically at 258 nm for the bovine enzyme (28). Buffers used for surface plasmon resonance (SPR) contained 50 mM phosphate and 150 mM NaCl at pH 12.50, 11.85, 10.8, 7.8, 6.6, 5.8, and 4.8; reactions at pH 3.5, 3.0, and 2.7 contained 100 mM acetate and 150 mM NaCl. Biotinylation Reaction. Biotinylated SOD1 was prepared at low
stoichiometry (1 mol equivalent of biotinylating agent兾SOD1 dimer) for SPR studies and high (10-fold excess of biotinylating agent兾SOD1 dimer) stoichiometry for size-exclusion chromatography (SEC) studies as described (29). Biotinylated SOD1 was found to be fully active after biotinylation (ref. 30 and data not shown) and had identical chromatographic properties compared with the unmodified protein (Fig. 5, which is published as supporting information on the PNAS web site). Analytical Ultracentrifugation (AUC). The Kd for SOD1 dimer dissociation was determined by using a Beckman-XLA ultracentrifuge at a speed of 20,644 ⫻ g at 4°C or 25°C by using a An-60Ti rotor. Radial UV absorbance (258 nm) was monitored every 2 h in cells with a path length of 12 mm. One blank buffer sample was used for each protein sample to obtain baselines. A total of seven scans were
Abbreviations: ALS, amyotrophic lateral sclerosis; FALS, familial ALS; SOD, superoxide dismutase; SPR, surface plasmon resonance; SEC, size-exclusion chromatography; AUC, analytical ultracentrifugation; Mm, molecular mass. *M.C. and N.V.D. contributed equally to this work. †To
whom correspondence may be addressed. E-mail:
[email protected] or
[email protected].
© 2004 by The National Academy of Sciences of the USA
www.pnas.org兾cgi兾doi兾10.1073兾pnas.0406650101
SEC. SEC was performed with a Pharmacia Akta chromatography
system by using an Amersham Pharmacia-Pharmacia Superdex HR 10兾30 column with a 200-l injection loop, total volume of 23.56 ml, and a void volume estimate of 7.8 ml, working at 5°C. The column flow rate was 0.45 ml兾min. Fractions (150–250 l) were collected in glass tubes, and these were analyzed immediately after completing the chromatogram. In reactions with low (nanomolar) SOD1 concentrations, the reaction mixture and the column buffer contained BSA at 10 mg兾l to prevent nonspecific binding of SOD1 to test tubes and the column matrix. UV absorbance was monitored spectrophotometrically at 254 nm. Dot Blotting. Column fractions were analyzed by a dot-blot assay,
with Avidin-AP, as described (29) and兾or by immunostaining with anti-SOD1 antibody (Supporting Text, which is published as supporting information on the PNAS web site). SPR Measurements. Plasmon resonance sensor chips, precoated
with strepavidin, were obtained from Biacore (Piscataway, NJ) and used with a Biacore model 2000 instrument. The chips were pretreated with NaOH兾50 mM NaCl (pH 12.7) before biotinSOD1 was immobilized. The volume of each flow cell (four per chip) was 7 nl, and a buffer flow of 2 l per min was used at 25°C. Low stoichiometry (ⱕ1 biotin兾dimer) biotin-SOD1 was immobilized on one flow cell surface such that an increase of ⬇3,000 resonance units resulted. After binding was complete, SOD1 dimer dissociation was induced with protein-free buffer. A small correction for the signal drift was applied by using the signal from the flow cells that had not received biotin-SOD1 but received protein-free buffer. To obtain the pH dependence of the rate constant, the zero-order dissociation reaction was followed sequentially with increasing or decreasing pH, starting at pH 7.8.
Table 1. Measurement of the Kd for SOD1 dimer dissociation by using AUC Conditions 30 M, pH 7.8 30 M, pH 3.5 ⫹ EDTA (4°C)* 30 M, pH 3.5 20 M, pH 3.5 10 M, pH 3.5 30 M, pH 3.5 ⫹ 24 h 10 M, pH 3.5 ⫹ 24 h
Mm, Da
Comment
36,180 16,417 29,402 27,481 27,425 30,269 29,969
Dimeric Monomeric Kd ⫽ 0.90 M Kd ⫽ 1.3 M Kd ⫽ 0.82 M Kd ⫽ 1.29 M Kd ⫽ 1.29 M
*Low temperature was used with EDTA to avoid aggregation of the apomonomer.
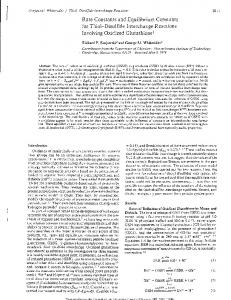
at pH 3.5, where aggregation was previously observed (24), 30 M SOD1 was ⬇84% dimer and ⬇16% monomer. In contrast, 30 M SOD1 was ⬇100% dimer under near-physiological conditions (pH 7.8), where aggregation does not occur. The Kd for SOD1 dimer dissociation at pH 7.8 could not be measured by AUC because the optical system used to detect the protein is limited to micromolar concentrations. However, nM SOD1 concentrations could be analyzed by using SEC and a dot-blot assay. Based on the calibration of the Superdex HR 10兾30 column (Fig. 1A), the SOD1 dimer and monomer were expected to elute at 15.5 and 17.0 ml, respectively; SOD1 at 30 M in pH 7.8 buffer eluted as ⬇100% dimer at 15.6 ml (Fig. 1B), in accord with AUC measurements (Table 1). The Kd at pH 7.8 was estimated with 5 nM SOD1, which gave column fractions at the limit of detection. The bulk of the protein eluted as a dimer at 15.3 ml with a small reproducible monomer peak at 16.8 ml, comprising ⬇20% of the total protein (Fig. 1C). The dimer and monomer were expected to elute as distinct peaks because they were in slow equilibrium: the half-time for dimer dissociation was ⬇6 h at pH 7.8 and 25°C (see below), whereas the time required for chromatographic separation was ⬇10 min at 5°C. A Kd of ⬇0.16 nM was calculated from a double-Gaussian least-square fit to the data and is in reasonable agreement with the Kd of ⬇1 nM estimated from the unfolding studies of human SOD1 (32). Thus, the Kd of ⬇1 ⫻ 10⫺6 M at pH 3.5 is larger than the Kd of ⬇1.6 ⫻ 10⫺10 M at pH 7.8 by a factor
Results We show that the minimal sequence of steps constituting the aggregation pathway is: k off
k⫺ m
k agg
L ; 2M holo | L ; 2M apo O ¡ A, Dholo | k on
[1]
⫹ km
where Dholo, Mholo, Mapo, and A are the holo-dimer, holo-monomer, Zn-free monomer (31), and aggregate, respectively. Next, we show that: (i) the Kd and koff for SOD1 dimer dissociation are enhanced under aggregation-promoting conditions; and (ii) aggregation requires dissociation of the SOD1 dimer to monomers and a subsequent loss of metals. Based on the observed aggregation kinetics, we calculated the rate and equilibrium constants for each step in the reaction sequence. The Kd for SOD1 Dimer Dissociation Is 6 ⴛ 103-Fold Higher Under Aggregation-Enhancing Conditions than Under Near-Physiological Conditions. The Kd and Mm of SOD1 under aggregation-enhancing
conditions were determined by using AUC (Table 1), fitting the absorbance profiles to a dimer-monomer equilibrium. SOD1 (30 M) was entirely dimeric (apparent Mm ⬇ 36 kDa) at pH 7.8 and was entirely monomeric (apparent Mm ⬇ 16 kDa) when metals were chelated by incubation with 10 mM EDTA at pH 3.5. A Kd of ⬇1 M was calculated for the dimer-monomer equilibrium by a combined fit to the AUC profiles of 30, 20, and 10 M SOD1. Thus, Khare et al.
Fig. 1. Size-exclusion profiles of SOD1 at pH 7.8. (A) The calibration curve for the column obtained by using globular protein standards at pH 7.8 was log (Mm兾1,000) ⫽ 4.56 –1.526䡠(Ve兾V0), where Ve is the elution volume and V0 is the void volume (7.8 ml) of the column. SOD dimer (32 kDa) and monomer (16 kDa) were expected to elute at 15.5 and 17.0 ml, respectively. (B) Elution profile at 30 M: SOD1 elutes at 15.6 ml and thus is dimeric. (C) Immunostaining dot-blot profile of a 5 nM SOD1 sample after 24 h of incubation. The peaks are Gaussian fits and correspond to the dimer and monomer. PNAS 兩 October 19, 2004 兩 vol. 101 兩 no. 42 兩 15095
BIOPHYSICS
obtained for each sample and the corresponding blank cell to reach equilibrium, followed by overspinning at 163,296 ⫻ g to obtain another estimate of baseline absorbance (typically 0.01 units). The UV-absorbance profiles were superimposed to ensure equilibrium and analyzed for residuals, and the equilibrium profiles were fit to the Lambert equation to obtain estimates of Kd and apparent Mm.
observed (pH 3.5), the rate of dimer dissociation is 30-fold faster than under near-physiological conditions. This result corresponds to an ⬇2.0 kcal兾mol reduction in the energy barrier for dissociation. SOD1 Dimer Dissociation May Be Induced by the Disruption of Salt Linkages. The dramatic increase in koff at pH 3.5 suggests that
insights into the forces stabilizing the SOD1 dimer could be obtained from the pH dependence of the reaction. The koff increased sharply on the acidic and basic ends of the pH range from 2.5 to 12.7 (Fig. 2 D and E). In the simplest unified model to account for this effect, dimer dissociation is linked with the titration of carboxyl (Asp, Glu) and amine (Lys, Arg) groups forming a salt linkage. At any given pH, the observed koff reflects the dissociation of three subpopulations of the SOD1 dimer, in which the salt linkage is: (i) intact, (ii) disrupted because of the protonation of the carboxylic acid, and (iii) disrupted because of the deprotonation of the amine. The species from these subpopulations have intrinsic dissociation rate constants, kind, kacid, and kbasic, respectively, which are weighted by their pH-dependent population size, so that the observed koff is: obs ⫽ k acid koff
再
冎
再
关H ⫹兴 Kb ⫹ k basic 关H ⫹兴 ⫹ K a K b ⫹ 关H ⫹兴
冎
⫹ k ind, [2]
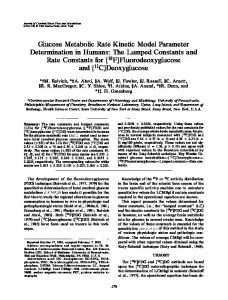
Fig. 2. The dimer dissociation rates of SOD1 measured by SPR. (A) Scheme for SPR measurement of SOD1 dimer dissociation rate. The rate constant at pH 3.5 was calculated as 1.07 ⫻ 10⫺3 s⫺1 (B) and 3.13 ⫻ 10⫺5 s⫺1 at pH 7.8 (C), by fitting to a single exponential (dotted lines). The initial rate was followed in the pH range from 2.5 to 12.7. (D) For dissociation at pH 6.6, the rate constant was found to be 2.75 ⫻ 10⫺5 for bovine SOD1 and 1.53 ⫻ 10⫺5 for human SOD1 (Inset). (E) The koff dependence on pH follows a titration curve with apparent pKa values of ⬍2.5 and ⬎12.5 at the acidic and basic ends of the pH range respectively. The lines have slopes of 1 and ⫺1 (Eq. 2).
of 6 ⫻ 103. This corresponds to a large (ⱖ5.2 kcal兾mol) reduction in dimer stability, indicating that a higher fraction of SOD1 is monomeric under aggregation-enhancing conditions than under near-physiological conditions. Because identical Mm estimates were obtained for 10 M SOD1 at pH 3.5 with and without a 24-h incubation (Table 1) dimer dissociation is presumably reversible, and the irreversible (33, 34) step in the aggregation lies downstream of dimer dissociation. The reversibility of dimer dissociation under aggregation-promoting conditions was directly demonstrated by SEC (Fig. 6, which is published as supporting information on the PNAS web site, and Supporting Text). The koff for SOD1 Dimer Dissociation Is 30-Fold Higher Under Aggregation-Enhancing Conditions than Under Near-Physiological Conditions. Having determined that the Kd for dimer dissociation was
enhanced 6,000-fold at pH 3.5, we used SPR to determine the kinetics of dimer dissociation. SOD1, biotinylated at low stoichiometry (ⱕ1 biotin兾SOD1 dimer), was immobilized on a strepavidin-coated gold surface. As shown in Fig. 2A, the biotinylated dimer has one subunit bound to strepavidin, and the nonbiotinylated subunit is progressively lost by flowing SOD1-free buffer through the flow cell, leading to a SPR signal decrease of ⬇50%. The dissociation is made irreversible by a 2,000 nl兾min flow of proteinfree buffer through the 7-nl flow cell. The rate constant for dissociation koff was determined by an exponential fit to the entire signal decay corresponding to a first-order reaction (Fig. 2 B and C) or by a linear fit to the initial signal decay corresponding to a zero-order reaction (Fig. 2D). The dissociation at pH 3.5 had a half-time of ⬇600 s (koff ⬇ 1.0 ⫻ 10⫺3 s⫺1; Fig. 2B), whereas the dissociation at pH 7.8 had a half-time of ⬇6 h (koff ⬇ 3.1 ⫻ 10⫺5 s⫺1; Fig. 2C). Therefore, under conditions where aggregation was 15096 兩 www.pnas.org兾cgi兾doi兾10.1073兾pnas.0406650101
where Ka and Kb are the equilibrium constants for the deprotonation of the carboxyl and amine groups involved. The first and the second terms dominate at low and high pH, respectively, and the rate is pH-independent at intermediate pH values. According to obs Eq. 2, in the low pH regime the titration-induced increase in log koff is predicted to have a slope of ⫺1 when pH ⬎⬎ pKa. Similarly, a slope of 1 is predicted for the corresponding increase in the high pH regime when pH ⬍⬍ pKb, and such increases were observed at both low and high pH (Fig. 2E). The apparent pKa and pKb values of ⬍2.5 and ⬎12.5, presumably correspond to carboxyl (Asp; free pK ⫽ 3.86) and amine (Arg; free pK ⫽ 12.48) groups forming a highly stabilizing salt linkage. The linkage of the protonation of the carboxylic acid and the deprotonation of the amine to the dimer dissociation leads to the abnormal apparent pK values. The 100-fold change in the observed koff in the intermediate pH range from 4.8 to 10.8 is indicative of other titrations, possibly of charged amino acid side chains, which may not form salt linkages, so that they have a smaller effect on the rate kind. Human SOD1, which is highly homologous (82% sequence identity) to the bovine enzyme, exhibits a similar pH dependence of dimer dissociation. The koff values were similar at pH 6.6 (Fig. 2D Inset) and at pH 7.8: 2.74 ⫻ 10⫺5 s⫺1 for human SOD1 (data not shown) and 3.13 ⫻ 10⫺5 s⫺1 for bovine SOD1 (Fig. 2B). Interestingly, there are no salt linkages on the dimer interface of either bovine or human SOD1 so that the enhanced dissociation rate is caused indirectly by the titration of a salt linkage that is not in the proximity of the dimer interface. The Arg-79–Asp-101 interaction was identified as a candidate for such a salt linkage (Fig. 7, which is published as supporting information on the PNAS web site, and Supporting Text). This salt-linkage mechanism provides a unified framework that accounts for the steep pH dependence of the reaction at low and high pH and is consistent with the previous finding that charge–charge interactions in SOD1 contribute substantially to its stability and folding kinetics (21). An alternative mechanism in which ionization of surface-exposed residue(s) dramatically influences dimer stability is less likely because it does not simultaneously predict behavior at extremes of pH and the modest pH dependence of the rate at intermediate pH values. Rapid Oligomerization of SOD1 Occurs Under Conditions Where It Is Monomeric. To test directly whether SOD1 monomer or dimer is the
aggregation-competent species, we characterized the initial phase Khare et al.
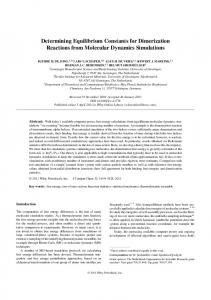
of aggregation as a function of the degree of dimer dissociation at pH 3.5. Based on a Kd ⬇1 M, as determined by AUC (Table 1), a 30-M SOD1 solution was 84% (25 M) dimeric, whereas a 1-M solution was 39% (0.39 M) dimeric, corresponding to a ⬇60-fold excess of dimer in the 30-M sample compared with the 1-M sample. SOD1 (30 M) eluted predominantly as a dimer (elution volume 16.5 ml; Fig. 6A) on incubation for 40 min (Fig. 3A Top). Forty minutes was sufficient for the establishment of equilibrium because the dimer dissociation has a half-time of ⬇600 s at this pH (Fig. 2B). The elution profiles remained largely unaltered for 48 h (Fig. 3A Middle and Bottom), and there was little aggregation because nearly identical peak heights and areas in the UV-absorbance profiles were obtained after incubation. This finding agreed with AUC results in which 30 M SOD1 gave nearly identical UV-absorbance signals and apparent Mm estimates (Table 1). After 48 h, most of the protein remained dimeric or monomeric (Fig. 3A), and ⬍10% was aggregated. Relatively rapid aggregation occurred with 1 M SOD1 (Fig. 3B). After 40 min of incubation, the protein eluted in a broad peak centered at 17.2 ml, corresponding to a 40:60 mixture of dimer and monomer, as expected from a Kd of ⬇1 M. The rate of aggregation was initially rapid, and after 24 and 48 h ⬇60% of the protein was aggregated. The aggregation rate is expected to decrease markedly with time, and the failure to observe a significant increase in the fraction of aggregated protein at 48 h can be attributed to experimental error. These results show that at a given concentration, SOD1 aggregation is proportional to the fraction of monomer, rather than dimer, in solution. Rapid Oligomerization of SOD1 Occurs Under Conditions Where Metals Are Lost Irreversibly. Because the chelation of metals is known to
destabilize SOD1 (26) and promote aggregation (24), we posKhare et al.
tulated that the reactive species for aggregation is the apomonomer. To test this notion, we determined the time course of aggregation of 30 M SOD1 under conditions where metal loss was made irreversible by dialysis against metal-free buffer. Dialysis at pH 3.6 results in a rapid loss of 95% of the Zn (31), and the unbound metals were expected to be removed rapidly because we had found that the loss of cupric acetate from the dialysis bag has a concentration-independent (range from 100 M to 10 mM) half-time of 10 min under the conditions of the experiment (data not shown). A substantial amount of aggregation was expected if the loss of metals from SOD1 induced formation of a species that was aggregation-competent. During incubation under dialysis conditions the amount of dimer rapidly decreased, the degree of dimer dissociation increased, and the protein was almost completely aggregated in 21 h (Fig. 3D). Electron micrographs of the aggregates obtained by negative staining show that they have fibrillar morphology (Fig. 3D Inset). Despite the fact that the dimer concentration decreased monotonically, the monomer concentration initially increased and subsequently gradually decreased (Fig. 3E), indicating that under dialysis conditions, dimer dissociation is coupled to metal loss and aggregation of the apo-monomers in the reaction sequence: k off
k⫺ m
k agg
L ; 共Zn兲 dialyzed ⫹ 2M apo O ¡ A, L ; 2M holo | Dholo | k on
[3]
k⫹ m
where Dholo, Mholo, Mapo, and A are the holo-dimer, holo-monomer, Zn-free monomer, and aggregate, respectively. In contrast, in AUC studies described above, the dominant species after incubation remained Dholo and Mholo, and there was no detectable aggregation. The coincidence between the increase in Mapo and the increased rate of aggregation shows that the apo-monomer is the reactive PNAS 兩 October 19, 2004 兩 vol. 101 兩 no. 42 兩 15097
BIOPHYSICS
Fig. 3. Kinetics of aggregation of SOD1. (A) Aggregation at 30 M. SOD1 elution profiles were obtained at initial time and at 24 and 48 h by immunostaining dot blots and UV absorbance (solid lines). The profiles were normalized according to the fraction with the highest signal intensity, and the monomer is more pronounced in the dot-blot elution profile. Aggregate is defined as the protein not eluting as dimer or monomer. (B) Aggregation at 1 M. SOD1 was detected by immunobloting column fractions with Gaussian fits to the spot-intensity profile. (C) Dot blots showing the elution profile at 30 and 1 M before and after incubation. The fractions corresponding to the dimer and monomer at 30 M were diluted 30-fold to ensure linearity of signal. (D) Time course of 30 M SOD1 under dialysis conditions. (Inset) An image of the fibrilar product after 21 h, obtained by negative staining electron microscopy. (E) Fit of the model in Eq. 3 to the results obtained in D. The continuous curves are obtained from numerical simulations with the optimized rate constants. (F) Predicted aggregation profiles with 30 and 1 M using the parameters derived in E. The predicted fraction of aggregates in 30 and 1 M SOD1 after 48 h was 14% and 63%, respectively, in close agreement with the experimentally measured values in A and B.
range of pH 3 to 9) have been shown to be continuous, reversible, and related to conformational changes in the protein (39), further indicating that the holo- and apo-monomer equilibrium is also a representative property of the protein. The Sequence of Events and the Reactive Species in the Aggregation of SOD1. To identify the sequence of events in the aggregation
Fig. 4. A scheme for the aggregation of SOD1. The more rapid aggregation at pH 3.5 compared with pH 7.8 results from the increased Kd and koff values at pH 3.5. Exposure to low pH decreases the stability of SOD1 by 5.2 (⫽ 13.5– 8.3) kcal兾mol, whereas the dissociation barrier is reduced by ⬇2 kcal兾 mol. At pH 3.5, the dissociation free energy of Zn from SOD1 monomer, Mholo, is ⬇9.6 kcal兾mol. In the minimal reaction sequence (Eq. 1), the apo-monomers, Mapo, aggregate to form insoluble fibrils; this step is the rate-limiting step for aggregation.
species for this process. Moreover, because the apo-monomer accumulated before aggregation, it is concluded that the oligomerization of apo-monomers is the rate-limiting step in Eq. 3. For a more detailed characterization of SOD1 aggregation at pH 3.5, the rate constants in the reaction sequence Eq. 3 were obtained. The value koff ⬇ 1 ⫻ 10⫺3 s⫺1 (Fig. 2B) was determined from SPR, and kon ⬇103 M⫺1䡠s⫺1 was calculated from Kd ⬇ 1 M. The ⫺ ⫹ constants km ⬇ 1.2 ⫻ 10⫺4 s⫺1, km ⬇ 5.2 ⫻ 104 M⫺1䡠s⫺1, and kagg ⬇ 0.1 ⫻ 103 M⫺1䡠s⫺1 were estimated from the observed kinetics of dialysis-induced aggregation (Supporting Text). The estimated value ⫺ of km ⬇ 1.2 ⫻ 10⫺4 s⫺1 agrees well with the previously measured ⫺ km ⫽ 4.2 ⫻ 10⫺4 s⫺1 (31) for the loss of Zn from SOD1 at pH 3.6 (half-time of ⬇27 min at 20°C). The differential master equations corresponding to Eq. 3 were solved numerically (Supporting Text), and the above rate constant estimates were refined, fitting to the observed time profile of dialysis-induced aggregation (Fig. 3E). The values that best account for the experimental results are: koff ⫽ 3 ⫻ ⫺ ⫹ 10⫺3 s⫺1, kon ⫽ 1.6 ⫻ 103 M⫺1䡠s⫺1, km ⫽ 1 ⫻ 10⫺3 s⫺1, km ⫽ 9.8 ⫻ 103 M⫺1䡠s⫺1, and kagg ⫽ 1 ⫻ 103 M⫺1䡠s⫺1. The rate constant values were found to be robust within an order of magnitude: the fit worsened dramatically on variations in rate constants greater than an order of magnitude. In accord with the above rate constants, which predict 12% aggregation in 30 M SOD1 after 24 h under nondialysis conditions, we had found little aggregation (Fig. 3A). Similarly, 14% and 63% aggregation is predicted at 30 and 1 M in 48 h (Fig. 3F), which is in good agreement with the observed values of 10% and 60%, respectively. Discussion To create amyloidogenic conditions under which the aggregation of proteins can be induced readily, acidic conditions are routinely used. For example, amyloidogenic intermediates of transthyretin, 2-microglobulin, prion, and lysozyme have been characterized at pH 4.5 (35), pH 3.6 (36), pH 4.4–6 (37), and pH 2 (38), respectively. Under conditions where SOD1 aggregation is experimentally accessible (pH 3.5), we have demonstrated an aggregation pathway in which the dimer dissociates, metal is lost from the resultant monomer, and the apo-monomers aggregate in a rate-limiting step. The absence of any discontinuity in the rate of dimer dissociation when the pH is reduced from 7.8 to 3.5 (Fig. 2E) provides evidence that the same pathway holds at physiological pH, but at a drastically reduced rate (Fig. 4). Similarly, the pH effects on the metal content of human, bovine, and yeast WT and yeast mutant SOD1 (in the 15098 兩 www.pnas.org兾cgi兾doi兾10.1073兾pnas.0406650101
reaction and the aggregation-prone reactive species, we characterized the concentration and metal-content dependence of SOD1 aggregation. For the former, conditions such that there was a preponderance of either dimer or monomer were chosen, and the profiles of the initial phase of SOD1 aggregation under these conditions were compared. Total SOD1 concentrations of 30 and 1 M were chosen so that at equilibrium there is an ⬇60-fold excess of dimer at the higher concentration. If aggregation depends on a bimolecular dimer–dimer reaction, a 3,600-fold greater aggregation rate is expected at the higher concentration. Similarly, a 60-fold greater aggregation rate is expected if a unimolecular isomerization reaction, i.e., a conformation change in dimer, leading to an aggregation-competent dimeric species, is rate-limiting. In stark contrast, we found rapid aggregation at the lower of the two concentrations, demonstrating that the dimer is not the reactive species for aggregation. The amount of aggregate at time t is kagg[M]2t, where [M] is the concentration of the aggregating species. Although there is an 8-fold excess of the total monomer at 30 M compared with 1 M, the concentration of the aggregating apomonomer is 3-fold higher at 30 M. The total protein concentration is 30-fold higher in the 30-M sample and therefore, the fraction of the protein in aggregates, fagg ⫽ kagg[M]2t兾cT, where cT is the total concentration of the protein, will be higher at 1 M than at 30 M, in agreement with the data in Fig. 3C. To ascertain whether the reactive species for aggregation is a metal-bound or metal-free monomer, aggregation kinetics were determined with 30 M SOD1 under conditions where the loss of metals from the protein was irreversible. We found that the dimer concentration rapidly decreased, whereas the monomer concentration initially increased and then gradually decreased (Fig. 3E), and that aggregation into a fibrillar product was nearly complete in 21 h. A comparison with the aggregation kinetics of 30 M SOD1 in the absence of dialysis (Fig. 3A) shows that the monomeric species appearing under dialysis conditions is the apo-monomer. These findings constitute direct evidence that aggregation occurs via an apo-monomer intermediate. The finding that the apo-monomer accumulated before aggregation shows that the final assembly step is rate-limiting in the reaction Eq. 1. The mechanism in Eq. 1 is minimal because the final step leading to fibril formation is likely to be a complex multistep process, possibly involving higher-order nuclei and oligomers (40, 41). kagg is an apparent second-order rate constant that is a convolution of these underlying higher-order reactions. Also, kagg ⬇ 103 M⫺1䡠s⫺1 is significantly smaller than expected for a diffusion-controlled reaction, kdiff ⫽ 106 to 109 M⫺1䡠s⫺1, further suggesting that additional steps that reduce the effective concentration of the aggregating species, such as a rate-limiting conformational change in the monomer or formation of oligomeric nuclei, occur downstream of the apo-monomer formation. The monomer intermediate in the proposed mechanism was recently observed for oxidized SOD1 aggregation (42) and the A4V FALS mutant (43). Also, mutants that cause monomerization of the homotetrameric protein transthyretin (44) were found to aggregate rapidly and were cytotoxic. The dissociation of multimeric proteins into their monomeric subunits, followed by misfolding and oligomerization, may be a general theme in the amyloidosis of proteins. The Thermodynamics and Kinetics of Dimer Dissociation and SOD1 Stability. The low value of Kd ⬇1.6 ⫻ 10⫺10 M at pH 7.8 reported
here is consistent with previous studies showing the remarkable stability of the SOD1 dimer. The dimer retains its native 32-kDa Mm Khare et al.
structure of FALS-associated SOD1 mutants, suggesting that they affect a global property of the protein. We postulate that mutations affect one or more steps in the multistep pathway for SOD1 aggregation, which suggests a unified framework to account for the effect of FALS mutants on SOD1 aggregation (Fig. 4). Dimer dissociation generates a monomeric form of SOD1, which loses its metal(s) to generate the aggregation-competent species Mapo. We have computationally estimated (unpublished results) that 70 of 75 known FALS-associated point mutants in SOD1 decrease the dimer stability and兾or increase dissociation propensity. We propose that mutant forms of SOD1 result in FALS because of one or more of the following: (i) mutations destabilize the SOD1 dimer, resulting in higher than normal concentrations of Mholo and consequently Mapo; (ii) mutations enhance the loss of metals from Mholo, possibly by affecting the interaction with the copper chaperone CCS, resulting in higher than normal concentrations of Mapo; and (iii) SOD1 mutations reduce the barrier for fibril formation. In all cases, the probability for forming protein aggregates is significantly increased. Important questions concerning the role, if any, of aggregates in the cell-specific biological origin of FALS, i.e., why the aggregates are found only in motor neurons and the origin of cytotoxicity in the disease, remain a formidable challenge.
is no discernable pattern in the primary, secondary, or tertiary
We thank A. Makhov and J. Griffith for electron microscopy of aggregates and A. Tripathy, F. Ding, and L. Fee for stimulating discussions. This work was supported in part by Muscular Dystrophy Association Grant MDA3720 and March of Dimes Birth Defect Foundation Research Grant 5-FY03-155 (to N.V.D.) and National Institutes of Health Grant GM059231 (to M.C.).
1. Cleveland, D. W. & Rothstein, J. D. (2001) Nat. Rev. Neurosci. 2, 806–819. 2. Ratovitski, T., Corson, L. B., Strain, J., Wong, P., Cleveland, D. W., Culotta, V. C. & Borchelt, D. (1999) Hum. Mol. Genet. 8, 1451–1460. 3. Beckman, J. S., Estevez, A. G. & Crow, J. R. (2001) Trends Neurosci. 24, S15–S20. 4. Rowland, L. P. & Shneider, N. A. (2001) N. Engl. J. Med. 344, 1688–1700. 5. Siddique, T., Nijhawan, D. & Hentati, A. (1996) Neurology 47, S27–S34. 6. Siddique, T., Deng, H. X., Hentati, A., Tandon, R., PericakVance, M. A., Laing, N. G., Roos, R. P., Cayabyab, A., Gerzfeldt, B., Hung, W. Y., et al. (1993) Ann. Neurol. 34, 303–304. 7. Rosen, D. R., Siddique, T., Patterson, D., Figlewicz, D. A., Sapp, P., Hentati, A., Donaldson, D., Goto, J., Oregan, J. P., Deng, H. X., et al. (1993) Nature 362, 59–62. 8. Gurney, M. E., Pu, H. F., Chiu, A. Y., Dalcanto, M. C., Polchow, C. Y., Alexander, D. D., Caliendo, J., Hentati, A., Kwon, Y. W., Deng, H. X., et al. (1994) Science 264, 1772–1775. 9. Gaudette, M., Hirano, M. & Siddique, T. (2000) Amyotrophic Lateral Sclerosis Other Motor Neuron Disord. 1, 83–89. 10. Rakhit, R., Cunningham, P., Furtos-Matei, A., Dahan, S., Qi, X. F., Crow, J. P., Cashman, N. R., Kondejewski, L. H. & Chakrabartty, A. (2002) J. Biol. Chem. 277, 47551–47556. 11. Valentine, J. S. & Hart, P. J. (2003) Proc. Natl. Acad. Sci. USA 100, 3617–3622. 12. Johnston, J. A., Dalton, M. J., Gurney, M. E. & Kopito, R. R. (2000) Proc. Natl. Acad. Sci. USA 97, 12571–12576. 13. Bruijn, L. I., Houseweart, M. K., Kato, S., Anderson, K. L., Anderson, S. D., Ohama, E., Reaume, A. G., Scott, R. W. & Cleveland, D. W. (1998) Science 281, 1851–1854. 14. Durham, H. D., Roy, J., Dong, L. & Figlewicz, D. A. (1997) J. Neuropathol. Exp. Neurol. 56, 523–530. 15. Wang, J., Xu, G. & Borchelt, D. R. (2002) Neurobiol. Dis. 9, 139–148. 16. Reaume, A. G., Elliott, J. L., Hoffman, E. K., Kowall, N. W., Ferrante, R. J., Siwek, D. F., Wilcox, H. M., Flood, D. G., Beal, M. F., Brown, R. H., et al. (1996) Nat. Genet. 13, 43–47. 17. Wang, J., Xu, G. L., Gonzales, V., Coonfield, M., Fromholt, D., Copeland, N. G., Jenkins, N. A. & Borchelt, D. R. (2002) Neurobiol. Dis. 10, 128–138. 18. Shibata, N., Hirano, A., Kobayashi, M., Sasaki, S., Kato, T., Matsumoto, S., Shiozawa, Z., Komiri, T., Ikemoto, A., Umahara, T., et al. (1994) Neurosci. Lett. 179, 149–152. 19. Matsumoto, S., Kusaka, H., Ito, H., Shibata, N., Asayama, T. & Imai, T. (1996) Clin. Neuropathol. 15, 41–46. 20. Shibata, N., Asayama, K., Hirano, A. & Kobayashi, M. (1996) Dev. Neurosci. 18, 492–498. 21. Khare, S. D., Ding, F. & Dokholyan, N. V. (2003) J. Mol. Biol. 334, 515–525. 22. Elam, J. S., Taylor, A. B., Strange, R., Antonyuk, S., Doucette, P. A., Rodriguez, J. A., Hasnain, S. S., Hayward, L. J., Valentine, J. S., Yeates, T. O., et al. (2003) Nat. Struct. Biol. 10, 461–467. 23. Okado-Matsumoto, A. & Fridovich, I. (2002) Proc. Natl. Acad. Sci. USA 99, 9010–9014. 24. DiDonato, M., Craig, L., Huff, M. E., Thayer, M. M., Cardoso, R. M. F., Kassmann, C. J., Lo, T. P., Bruns, C. K., Powers, E. T., Kelly, J. W., et al. (2003) J. Mol. Biol. 332, 601–615. 25. Stathopulos, P. B., Rumfeldt, J. A. O., Scholz, G. A., Irani, R. A., Frey, H. E., Hallewell, R. A., Lepock, J. R. & Meiering, E. M. (2003) Proc. Natl. Acad. Sci. USA 100, 7021–7026.
26. Lindberg, M. J., Tibell, L. & Oliveberg, M. (2002) Proc. Natl. Acad. Sci. USA 99, 16607–16612. 27. Rodriguez, J. A., Valentine, O. S., Eggers, D. K., Roe, J. A., Tiwari, A., Brown, R. H. & Hayward, L. J. (2002) J. Biol. Chem. 277, 15932–15937. 28. Inouye, K., Osaki, A. & Tonomura, B. (1994) J. Biochem. 115, 507–515. 29. Caplow, M. & Fee, L. (2002) Mol. Biol. Cell 13, 2120–2131. 30. Mccord, J. M. & Fridovich, I. (1969) J. Biol. Chem. 244, 6049–6055. 31. Pantoliano, M. W., Valentine, J. S., Mammone, R. J. & Scholler, D. M. (1982) J. Am. Chem. Soc. 104, 1717–1723. 32. Stroppolo, M. E., Malvezzi-Campeggi, F., Mei, G., Rosato, N. & Desideri, A. (2000) Arch. Biochem. Biophys. 377, 215–218. 33. Lepock, J. R., Frey, H. E. & Hallewell, R. A. (1990) J. Biol. Chem. 265, 21612–21618. 34. Lepock, J. R., Arnold, L. D., Torrie, B. H., Andrews, B. & Kruuv, J. (1985) Arch. Biochem. Biophys. 241, 243–251. 35. Liu, K., Cho, H. S., Lashuel, H. A., Kelly, J. W. & Wemmer, D. E. (2000) Nat. Struct. Biol. 7, 754–757. 36. McParland, V. J., Kalverda, A. P., Homans, S. W. & Radford, S. E. (2002) Nat. Struct. Biol. 9, 326–331. 37. Swietnicki, W., Petersen, R., Gambetti, P. & Surewicz, W. K. (1997) J. Biol. Chem. 272, 27517–27520. 38. Blanch, E. W., Morozova-Roche, L. A., Cochran, D. A. E., Doig, A. J., Hecht, L. & Barron, L. D. (2000) J. Mol. Biol. 301, 553–563. 39. Goto, J. J., Zhu, H. N., Sanchez, R. J., Nersissian, A., Gralla, E. B., Valentine, J. S. & Cabelli, D. E. (2000) J. Biol. Chem. 275, 1007–1014. 40. Lomakin, A., Teplow, D. B., Kirschner, D. A. & Benedek, G. B. (1997) Proc. Natl. Acad. Sci. USA 94, 7942–7947. 41. Walsh, D. M., Hartley, D. M., Kusumoto, Y., Fezoui, Y., Condron, M. M., Lomakin, A., Benedek, G. B., Selkoe, D. J. & Teplow, D. B. (1999) J. Biol. Chem. 274, 25945–25952. 42. Rakhit, R., Crow, J. P., Lepock, J. R., Kondejewski, L. H., Cashman, N. R. & Chakrabartty, A. (2004) J. Biol. Chem. 279, 15499–15504. 43. Ray, S. S., Nowak, R. J., Strokovich, K., Brown, R. H., Walz, T. & Lansbury, P. T. (2004) Biochemistry 43, 4899–4905. 44. Reixach, N., Deechongkit, S., Jiang, X., Kelly, J. W. & Buxbaum, J. N. (2004) Proc. Natl. Acad. Sci. USA 101, 2817–2822. 45. Malinowski, D. P. & Fridovich, I. (1979) Biochemistry 18, 5055–5060. 46. Forman, H. J. & Fridovich, I. (1973) J. Biol. Chem. 248, 2645–26499. 47. Borchelt, D. R., Guarnieri, M., Wong, P. C., Lee, M. K., Slunt, H. S., Xu, Z. S., Sisodia, S. S., Price, D. L. & Cleveland, D. W. (1995) J. Biol. Chem. 270, 3234–3238. 48. Nakano, R., Inuzuka, T., Kikugawa, K., Takahashi, H., Sakimura, K., Fujii, J., Taniguchi, N. & Tsuji, S. (1996) Neurosci. Lett. 211, 129–131.
A Model for the Effect of FALS Mutations on SOD1 Aggregation. There
Khare et al.
PNAS 兩 October 19, 2004 兩 vol. 101 兩 no. 42 兩 15099
BIOPHYSICS
in 8 M urea for 72 h at 25°C (45) and is active in 4% SDS (46). This stability was also seen in pulse–chase studies, showing that the protein has a relatively long (20–78 h) half-life in cells (12, 47, 48). The Kd ⬇ 1.6 ⫻ 10⫺10 M (pH 7.8, 37°C) corresponds to a free energy, ⌬Gd ⬇ ⫺13.5 kcal兾mol, for the dimer dissociation reaction: D o 2M. Consistent with our estimate, a three-state fit to SOD1 unfolding (32) of the homologous human SOD1 (pH 7.4, 20°C) gave: D o 2M o U; ⌬Gd ⬇ ⫺12.5 kcal兾mol and ⌬Gm ⬇ ⫺8 kcal兾mol, where U is the unfolded state and ⌬Gm is the free energy of unfolding of both monomers. The total stability of SOD1 (⌬Gd ⫹ ⌬Gm) is ⬇20.5 kcal兾mol (32), and the dimer dissociation free energy represents the largest contribution to the stability of the protein. Therefore, conditions that lead to aggregation must destabilize the dimer and兾or reduce the dissociation barrier. In accord with this scenario, we found that the rate and equilibrium constants for dimer dissociation are enhanced 30-fold and 6 ⫻ 103-fold at pH 3.5 compared with pH 7.8. These values imply that low pH reduces the dimer dissociation barrier by 2.0 kcal兾mol, whereas the dimer stability is reduced by 5.2 (⫽ 13.5–8.3) kcal兾mol (Fig. 4). Thus, the rarity and the late age of onset of ALS may occur because under physiological conditions the Kd and koff are 6,000- and 30-fold smaller, and the H⫹ concentration expected to induce metal loss is 10,000-fold smaller, compared with pH 3.5. The effect of factors related to aging, such as the decreased efficacy of chaperonemediated proteosomal degradation (23), is likely to increase the demetallation and兾or the dimer dissociation in vivo.