Content Area. 2 Years Pre- 1 Year Pre- Impl. Year 1 Year Post- 2 Years Post- 3 Years Post- 4 Years Post-. English. 20.6. 20.4. 20.6. 20.7. 20.6. 20.8. 20.5. (1.4).
The Relationship Between Schedule Type and ACT Assessment Scores: A Longitudinal Study
Matt T. Harmston Ann-Maureen Pliska Robert L. Ziomek Donald G. Hackmann
Abstract This study investigated trends in the mean ACT Assessment scores of 450 public high schools in Illinois and Iowa, according to how they scheduled classes. The schools continuously employed either a traditional eight-period daily schedule, 4x4-semester schedule, or an eightblock alternating-day block schedule.
Seven years of data were available for the blocked
schools, representing two years pre-implementation through four years post-implementation. The eight-period schools demonstrated a slight upward trend in mean ACT scores over time, regardless of content area. The eight-block schools demonstrated some variability in mean ACT scores, but increased little over time. After reaching a peak at or near the year of implementation, the 4x4-semester block schools demonstrated a generally declining trend in mean ACT scores across tests. With the exception of Reading, mean ACT scores rebounded somewhat at the fourth year post-implementation for the 4x4-semester block schools.
ii
Acknowledgement The authors would like to thank Audrey Young for her assistance in the completion of this paper.
iii
The Relationship Between Schedule Type and ACT Assessment Scores: A Longitudinal Study Introduction Calls for educational reform since A Nation at Risk (National Commission on Excellence in Education, 1983) was published have motivated educators and policymakers to identify potential solutions for a variety of concerns within the educational realm. One area in which reform is taking place is the use of instructional time. The 1994 Prisoners of Time report, generated by the National Education Commission on Time and Learning, discussed more efficient and effective uses of classroom time. The report argued that extended time meeting individualized learning needs of students was required to learn essential skills. Flexible instructional time, which can be provided by scheduling larger blocks of time, was argued to be able to accommodate this need. Instructional time at the secondary level can be divided in different ways—the timehonored eight-period daily-period daily schedule format or more recent approaches, commonly called “block scheduling.” The block scheduling format allocates longer timeframes for instruction in each course. Many scheduling variants and hybrids of basic scheduling types are in existence, but three basic models have emerged as the most commonly implemented: the traditional eight-period daily schedule, the 4x4-semester plan, and the eight-block alternatingday schedule (Hackmann, 1999a, 1999b). A traditional eight-period daily schedule consists of eight instructional periods, each approximately 45-55 minutes in length. Under this scheduling type, students meet in each class every day throughout the entire academic year (Hackmann, 1999a). Students typically are
2 allotted 3-5 minutes between instruction in each class for changing classrooms, socializing, and tending to personal needs. With the longer timeframes developed under block scheduling (or, block-of-time scheduling), there are fewer courses each day and less time encumbered for administrative duties (e.g., taking roll) and transferring between classes. With the 4x4-semester plan, students meet four classes daily the first semester, with each instructional timeframe typically 85-95 minutes in length. During the second semester, students are enrolled in four new courses, for a total of eight classes throughout the academic year (Dougherty, 1998).
The eight-block alternating-day
schedule also uses four 85-95 minute periods each day, but classes meet on alternating days: four classes on an “A” day and four different courses on a “B” day (Cobb, Abate, & Baker, 1999). Block scheduling has gained rapid acceptance in the past two decades; it is estimated that approximately 30% of high schools now utilize some form of block scheduling (Rettig & Canady, 1999). Secondary schools report many benefits from the longer instructional blocks. The literature is replete with references to an enhanced school climate, indicating that improved teacher-student interactions, reduced disciplinary referrals and suspensions, and improved attendance are possible outcomes. From the instructional standpoint, the longer blocks are said to promote in-depth exploration of content, to provide increase opportunities for hands-on learning, and to provide teachers with increased flexibility to differentiate instruction (Dougherty, 1998; Northeast and Islands Regional Education Laboratory [NIREL], 1998; Thayer & Shortt, 19981999; Wilson, 1995). Although perceived advantages identified above are likely related indirectly to students’ academic achievement, the jury is still out regarding the details of the relationship between scheduling type and academic achievement. This lack of a clearly established relationship
3 between block scheduling and student achievement has caused some schools to reject block-oftime scheduling formats (Hackmann, 1999a; 1999b). Given the current attention paid to improved student learning, some educators argue that content coverage may decrease when depth is emphasized over breadth (Dougherty, 1998; NIREL, 1998). In addition, the total allocated instructional minutes over the course of an entire academic year may be less than in traditional models and, in the case of 4x4-semester models, students may experience greater loss of content retention (Dougherty; NIREL). So, what really happens to student achievement when block-of-time scheduling is implemented? Harmston, Pliska, and Hackmann (2001) investigated the longitudinal relationship between scheduling type and achievement as measured by the ACT Assessment. They found that the eight-period daily schedule schools demonstrated a slight upward trend in ACT Composite scores over time, but the blocked schools did not show a consistent upward trend. The purpose of the present study was to continue the study initiated by Harmston et al. of the achievement/schedule type relationship by going beyond composite scores and looking within content areas. This paper begins by providing a brief review of the literature related to secondary school scheduling models and the scant research literature related to student achievement. It then reports the results of a longitudinal study comparing high school scheduling types and student performance on ACT Assessment English, Mathematics, Science Reasoning, and Reading tests. The paper concludes with a discussion of results and implications for school faculties investigating the effectiveness of various approaches to school scheduling. Review of Secondary School Scheduling Literature The use of daily-period scheduling approaches has a long history in U.S. secondary schools. With the emphasis on scientific management prevalent in the earlier portion of the 20th
4 century, daily-period models evolved as effective in promoting an efficient, factory-model approach to teaching. In the latter decades of the 20th century, however, this traditional approach came under fire. Critics contended that daily-period models result in fragmented, harried instructional days, promote over-reliance on the lecture method, discourage cross-disciplinary connections of subject content, and lead to superficial understanding of complex curricular concepts (Canady & Rettig, 1995; National Education Association, 2001; Wilson, 1995). With traditional scheduling approaches under attack, block-of-time alternatives, such as the 4x4-semester and eight-block alternating-day models, emerged. As educators experimented with constructivist approaches to teaching, they embraced methods that accommodate individual learning styles and actively engage students in learning (National Association of Secondary School Principals [NASSP], 1996). Creative and student-focused instructional strategies stimulated teachers to request extended instructional time to facilitate learning, and organizations such as NASSP (1996) advocated that secondary schools develop flexible scheduling models (e.g., block scheduling) to promote learning. This learning is intended to come about through creative and student-centered instructional strategies arising from extended class periods. Block scheduling models typically permit extended time for teacher preparation, provide time and flexibility for instructional approaches beyond the lecture method, and place fewer daily homework demands on students (Wilson, 1995). Many block models reduce the number of daily course preparations for teachers, allow students to more easily retake failed courses, and promote a more relaxed school climate (NIREL, 1998; Thayer & Shortt, 1998-1999). Although this scheduling approach has gained acceptance throughout the nation, these approaches appear to have higher representation in some states than others. For example, approximately two-thirds of high schools in Virginia and North Carolina use some form of block
5 scheduling (Hackmann, 1999b). In contrast, roughly 27% of Illinois and Iowa high schools use some form of block scheduling (Hackmann, 2000), which is closer to the national estimates. Research conducted with Iowa secondary school principals identified several sources of concern related to these models, some which appear to be tied to contextual issues confronting Iowa faculties (Hackmann, 1999a). Iowa schools have a strong tradition of support for cocurricular programs, and some faculties are hesitant to implement new models that may reduce students’ opportunities for elective offerings. In addition, Iowa is the last of the 50 states to require content standards and benchmarks, and many schools are, of necessity, directing their energies toward developing their local districts’ standards. Finally, students in Iowa schools traditionally have high scores on standardized tests (e.g., Iowa had the seventh highest ACT Composite scores in the country for 2002 (ACT, 2002)), and some faculties may be reluctant to change their scheduling approaches when the connection between schedule types and achievement has not been fully established. The benefits and concerns associated with block scheduling listed above are intended to shed light on the literature base related to block scheduling. The current study, however, has focused specifically on the relationship between student achievement and schedule type, rather than addressing more commonly studied climate and other non-cognitive variables. The Achievement/Schedule Type Relationship The limited research that exists related to achievement and block scheduling presents inconclusive and/or contradictory findings. Thayer and Shortt (1998-1999) studied Virginia schools, finding that in reading and mathematics, percentile gains were greater for blockscheduled schools than for traditional scheduled schools. Furthermore, Hess, Wronkovich, and
6 Robinson (1999) found that students in block-scheduled schools performed significantly better on SAT-II English and Biology tests than did students from non-block schools. On the other hand, Pliska, Harmston, and Hackmann (2001) found no differences in mean achievement levels among all eight-period, eight-block, and 4x4-semester schools in Illinois and Iowa. Pedersen (2001) also found no significant differences in student achievement between blocked and non-blocked Iowa high schools on the Iowa Tests of Educational Development, a standardized test completed by high school juniors. Similarly, Lyons and Terry (2003) found no significant differences between mean scores for nine different content areas across schedule types. In algebra and geometry, Lockwood (1995) found no statistically significant differences on the basis of schedule type. Other studies on achievement have reached different conclusions (Wronkovich, 1998). Raphael, Wahlstrom, and McLean (1986) found student achievement was lower under the blockscheduling format. Wronkovich, Hess, and Robinson (1997) determined that schedule type could account for a significant percentage of variance in mathematics achievement after controlling for covariates, with the relationship favoring traditional daily-period scheduling. The College Board (1998) determined that students enrolled in semester-blocked schools generally received lower scores on Advanced Placement Calculus and U. S. History examinations than students enrolled in yearlong daily-period classes. Bateson (1990) reached a similar conclusion for Canadian students taking the Third Provincial Assessment of Science. Need for Longitudinal Research When implementing a block-of-time schedule, teachers are called upon to reduce their reliance on the lecture method and to implement instructional strategies that emphasize student participation and hands-on learning. Arguably, at least one academic year may be needed prior to
7 implementation for faculty and staff to be prepared to serve under the new type of schedule. During the preparation, they would be able to practice new skills and refine instructional strategies. To throw them into a new system without sufficient preparation invites problems. Consequently, research is needed that investigates the achievement/schedule type relationship using a longitudinal design, to determine if student achievement improves as teachers become more proficient or familiar with engaging students in learning under a block format. The present study was intended to add to the existing knowledge base of the achievement/schedule type relationship through using a longitudinal design and careful control of schedule types. Specifically, this study investigated trends in mean ACT Assessment English, Mathematics, Science Reasoning, and Reading score levels for public high schools in Illinois and Iowa that employed a traditional eight-period schedule or block scheduling (4x4-semester or eight-block alternating-day) for years 1995 through 2001. These schools also had continuous data available for two years pre-implementation through four years post-implementation. This study sought to compare trends in ACT English, Mathematics, Science Reasoning, and Reading achievement from two years pre- to four years post-implementation among schools with different schedule types. The selection of data from secondary schools from the states of Iowa and Illinois was considered appropriate for the purposes of this study because the percentage of schools in these two states utilizing block scheduling (27%) closely parallels Rettig and Canady’s (1999) national estimate of 30%. Furthermore, a high percentage of these states’ graduating seniors participate in the ACT Assessment: 71% in Illinois and 67% in Iowa (ACT, 2001). Although many schools in the two states met the criteria identified in the methodology, they did not represent a national
8 sample. On the other hand, the number and diversity of schools in these two states makes the results informative and useful, especially if similar studies are done in other parts of the country. High schools in these two Midwestern states utilized a variety of scheduling options, but the eight-period daily schedule was among the most frequently used traditional schedule, and the 4x4-semester and eight-block alternating-day models were the most commonly used block schedules in both states (Hackmann, 1999a; 1999b). In each of the three models identified for this study, students would complete eight courses over the duration of one academic year. Instructional time would be controlled to a degree, since the equivalent of one-eighth of the academic year would be allocated to each course within each model. Schools that used hybrid models or variations on these scheduling types were excluded from the study to ensure that only the basic forms of these models were tested. Methodology Participating Schools A total of 568 high schools in Illinois and Iowa implemented pure 4x4-semester or eightblock alternating-day schedules, or continually used traditional eight-period daily schedules in the mid- and late 1990s. To promote comparability of schedule groups, one of the 568 schools was dropped because its mean ACT Composite score was drastically higher than the other schools (e.g., mean > 29).
For consistency with ACT’s High School Profile reporting
procedures, schools with fewer than 30 examinees were excluded from the study (Ziomek, 2000). In total, 19 schools implemented a pure 4x4-semester block schedule and 101 implemented a pure eight-block alternating day schedule between the years 1994 and 1997, inclusive, and maintained their schedule for at least four years post-implementation. Similarly,
9 330 schools using an eight-period schedule for the years 1995 and 2001, inclusive, were also kept for the final analysis, for a total of 450 schools. To support conclusions regarding comparison of schedule types, we studied the degree of similarity among schools in different schedule-type groups. In particular, groups of schools within schedule type had very similar gender breakdowns, averaging between 44% (SD=10%; eight period) and 46% (SD=7%; 4x4-semester) male. Furthermore, the average percent of males between schedule types differed no more than 2% within each data year. Similarly, racial breakdowns averaged over 90% Caucasian for all schedule types. On the other hand, eightperiod schools tended to have less majority representation than the other two school types within data years. Other differences between schedule groups were observed. For instance, eight-period and eight-block schools were more likely to be rural than were 4x4-semester schools (82% vs. 63%). On the other hand, 4x4-semester schools were more likely to be suburban than were other schedule types (32% vs. 15% and 12%). Regardless of schedule type, however, the majority of schools were rural, followed by suburban, with the least being urban. Schools were fairly similar in terms of per-pupil expenditure between schedule types. Over 70% of schools in each schedule type spent between $4,000 and $6,000 per pupil per year. In summary, schools comprising each schedule grouping were very similar in some characteristics, but differed slightly in others. Although these differences are not large, they should be taken into consideration when comparing score patterns of schools grouped by schedule type. Mean ACT Assessment English, Mathematics, Science Reasoning, and Reading scores were calculated for all schools. Because implementation years differed for many blocked
10 schools, means were calculated and identified relative to the academic year of implementation, rather than calendar year. They spanned two years pre-implementation of block to four years post-implementation, permitting us to look at seven year trends. The decision to include two years pre- to four years post-implementation was based on two primary factors. First, having data from one and two years prior to implementation afforded a baseline against which to compare average achievement. Second, the study followed schools through four years post-implementation to have data representing schools that have had most graduating seniors educated under the 4x4-semester or eight-block systems for the duration of their high school experience. Similar analyses were conducted for the 330 traditional eight-period daily schedule schools. Results for the daily schedule schools were described using the “two years pre- to four years post-implementation” language, although a scheduling change never was implemented. The artificial “implementation” year for daily schedule schools was defined as 1997, which was the modal implementation year for both the 4x4-semester and eight-block scheduled schools included in the final analyses. This decision was made in an effort to ensure that as many schools as possible provided data from the same chronological years. In sum, 450 of the original 568 schools met the criteria for time, duration, non-outlying performance, and type of schedule use, and were included in the study. Most of the 118 omitted schools were dropped due to failure to meet the time criterion. Analyses Initially, inferential statistics such as MANOVA and MANCOVA were considered for analysis, but necessary assumptions were violated.
Given this fact and the exploratory,
descriptive intent of the study, final analyses included means, standard deviations, skewness, and
11 effect sizes. Means for daily schedule, 4x4-semester, and eight-block schools had standard errors ranging from 0.04 to 0.06, 0.13 to 0.19, and 0.07 to 0.10, respectively. The reason for using effect sizes was to provide additional meaning for the results. Specifically, effect sizes enabled the researchers to look at standardized change in achievement, rather than absolute achievement levels, which partially corrected for the impact of having different implementation years. Computation of effect sizes was accomplished by using Cohen’s d (Cohen, 1988) with a pooled standard deviation (see Equation 1). Here, i indexes a specific year/content area or year/schedule type combination, and j indexes another combination for comparison. Note, the standard deviations represented variability in school means, rather than individual student scores. This was done for consistency with other school-level results reported in the study. ES ij =
Xi− X
j
ni S i2 + n j
S 2j
(1)
ni + n j
For the purposes of this study, effect sizes (ES) were interpreted in the following manner: ES < 0.25 indicated a negligible effect (or difference), 0.25 < ES < 0.50 indicated a moderate effect, and 0.50 < ES indicated a substantial effect.
We deviated from Cohen’s (1988)
conventions for effect size limits because our experience with schools suggested that the present limits were useful to schools using the ACT Assessment. Furthermore, more liberal limits on effect size classifications enabled the researchers to detect something going on, thus motivating subsequent research to tease out fine details. The complexity introduced by the presence of both school-level (e.g., schedule type) and student-level variables (e.g., ACT Assessment scores) was addressed by aggregating all studentlevel data to the school level. Because some information may be lost in such an approach,
12 subsequent studies might utilize more complex methodology that incorporates both student- and school-level data. Given the descriptive nature of the analyses, two other factors supported the decision to use school-level data: 1. Students within a given school often, as a group, exhibit achievement levels that will differ systematically from other schools. As a result, each school within each type of schedule would represent a distinct group of students. 2. Selection of student records is the result of high school attended, rather than being based on a random sample. These two factors suggest that schools represent clusters of students within schedule categories. The presence of clusters supports the researchers’ use of school-level data. In using such data, however, conclusions necessarily will focus on the relationship of schedule type with aggregate student achievement, rather than individual student achievement. It is important to note that using school-level data as exemplified by this study gives more weight to small schools than if students had been used as the units of analysis. It should also be noted that the schools included in the study demonstrated fairly stable enrollments and numbers of students, though 4x4semester schools tended to be larger than the others, and eight-block schools tended to be smaller than others. Instrument Achievement levels were by the mean ACT Assessment English, Mathematics, Science Reasoning, and Reading scores of high schools. Scores from the ACT Assessment were selected for one primary reason: using a standardized metric such as that embodied in ACT Assessment
13 scores has the benefit of minimizing susceptibility to the potential for grade inflation and biases in student evaluation procedures that may occur when utilizing less standardized measures. ACT scores are excellent measures of students’ academic readiness for college-level study, because the content of the ACT is based on national curriculum surveys. However, the ACT Assessment is not intended to assess facets of achievement that are unrelated to preparedness for college. Thus, the ACT Assessment enabled us to look at an important aspect of student achievement, but not the whole picture. Therefore, references to achievement in latter sections of this paper refer to that assessed by the ACT Assessment, rather than a comprehensive, global measure of achievement. The populations tested by the ACT Assessment also pose limitations for this study, because the ACT Assessment is generally taken by students who are contemplating going to college. The ACT tested students on whom school means were based represented therefore were a self-selected group. Thus, all conclusions put forth later in this paper should be considered applicable to students contemplating college attendance, rather than being applied to all students. Furthermore, students taking the ACT Assessment chose when, and how often, they took the ACT Assessment. Because this study used only the results from final test sessions, it did not control for student education level at time of testing nor the number of testings prior to the final test session. Variable Definitions The dependent variables in this study were average ACT Assessment English, Mathematics, Science Reasoning, and Reading scores obtained for each of seven consecutive years described above. Each of the content area tests was designed to measure skills acquired in secondary education considered to be most important for success in postsecondary education
14 (ACT, 1997). In the present study, ACT Assessment scores averaged within each school describe a given school’s average college-bound students’ aggregate achievement in content areas important for success in college. The independent variable on which the present study focused was schedule type. Three schedule types were compared in this study: the traditional eight-period daily schedule, the 4x4semester plan, and the eight-block alternating-day model. The eight-period daily schedule was intended to provide a baseline against which to compare achievement of block schools. Other independent variables were investigated for purposes of describing the groups of schools. For instance, supplementary analyses investigated school size and percentage of ACT tested examinees and their relationship to schedule type. The percentage of examinees was averaged within schedule type across time, and it was found that there was little difference among schedule types. However, differences were observed in number of examinees between schedule types. For instance, 4x4-semester, eight-block, and eight-period schools averaged 93, 70, and 44 examinees per year, respectively.
One should note that these differences are
statistically significant, with standard errors of 15.7, 10.0, and 5.3, respectively. Because trends in overall enrollments and number of examinees paralleled one another within and among schedule type groups, differences in achievement as a function of schedule type may not be directly associated with percentage of examinees. Results To compare results of schedule types across content areas, results were broken down into two formats. First, trends in content area results were reviewed within schedule type, facilitating comparisons across content areas. The second format reviewed trends of schedule type within content areas, facilitating comparison across schedule type.
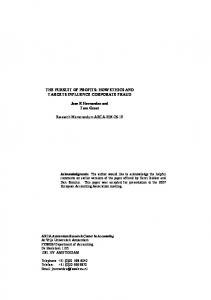
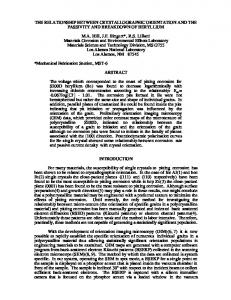
15 Content Areas Within Schedule Type 4x4-semester schedule. Trend lines of means for 4x4-semester schools were somewhat parallel to one another, as can be seen in Figure 1, which illustrates that changes in achievement as a function of time relative to implementation of a 4x4-semester schedule were nearly the same, regardless of content area. FIGURE 1. Trends in 4x4 Semester Means 22.5
As one
Mean ACT score
22.0 21.5 21.0 4x4-Semester: Reading
20.5
4x4-Semester: Mathematics 4x4-Semester: English
20.0
4 Years Post-
3 Years Post-
2 Years Post-
1 Year Post-
Implementation Year
from
1 Year Pre-
see
4x4-Semester: Science Reasoning
19.5 2 Years Pre-
can
Years Relative to Implementation of Schedule
Table 1, there was negligible change in student achievement between two years pre- and four years postimplementation under the 4x4-semester schedule. Changes ranged from 0 points (Science Reasoning; ES=0.00) to –0.2 points (English and Reading; ES=-0.19 and –0.15, respectively).
16 TABLE 1 ACT Assessment Means for 4x4 Semester Schools (N=19)1 Years Under Schedule Type 1 Year Pre- Impl. Year 1 Year Post- 2 Years Post21.3 21.1 21.1 21.0 (0.7) (0.8) (1.1) (1.0) 0.27 0.00 0.00 -0.11
Content Area English
2 Years Pre21.1 (1.0) 0.00
Mathematics
20.8 (1.0) -0.21
20.9 (0.7) -0.13
21.0 (0.9) 0.00
21.0 (1.4) 0.00
Science Reasoning
21.8 (0.8) -0.25
21.9 (0.7) -0.13
22.0 (0.8) 0.00
Reading
21.7 (1.4) -0.27
22.0 (1.0) 0.00
22.0 (0.8) 0.00
1
3 Years Post20.6 (1.0) -0.56
4 Years Post20.9 (1.1) -0.21
20.5 (1.4) -0.43
20.4 (1.3) -0.55
20.7 (1.3) -0.27
21.9 (1.1) -0.11
21.4 (1.1) -0.63
21.5 (0.9) -0.59
21.8 (0.9) -0.24
21.8 (1.2) -0.20
21.5 (1.2) -0.50
21.5 (1.2) -0.50
21.5 (1.2) -0.50
Values in parentheses are standard deviations, and values in itallics are effect sizes comparing year in question to implementation year.
Simply saying that a negligible overall change occurred would gloss over interesting results in the interim years. Specifically, achievement in all content areas experienced a substantial drop between implementation year and three years post-implementation. Effect sizes ranged from a loss of 0.50 standard deviations for Reading to a loss of 0.59 standard deviations for Science Reasoning. However, between the third and fourth years post-implementation, Reading scores were stable and scores on English, Science Reasoning, and Mathematics tests demonstrated a moderate increase. A review of standard deviations revealed no strong patterns. Skewness values also demonstrated no strong patterns, with one exception: They became noticeably more negative at the fourth year post-implementation. Further investigation revealed that this resulted from one 4x4-semester school dropping a great deal in average achievement relative to other schools between the third and fourth years. This school was not considered an outlier, however, because its average ACT scores (as opposed to change scores) were similar to those of other schools. Therefore, it was retained in the analyses.
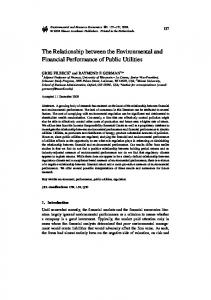
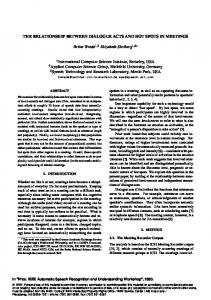
17 Eight-block alternating day schedule. Like the 4x4-semester results, trend lines for eightblock schools were somewhat parallel to one another, regardless of content area (see Figure 2). FIGURE 2. Trends in Eight-Block Alternating Day Means 22.5
Mean ACT score
22.0 21.5 Eight-Block: Reading
21.0 20.5
Eight-Block: Mathematics
20.0 Eight-Block: English 4 Years Post-
3 Years Post-
2 Years Post-
1 Year Post-
Implementation Year
1 Year Pre-
2 Years Pre-
19.5
Eight-Block: Science Reasoning
Years Relative to Implementation of Schedule
This finding was important because it suggested that the impact an eight-block schedule had on student achievement may have been fairly uniform across content areas. Results for the eight-block schools are presented in Table 2. TABLE 2 ACT Assessment Means for Eight-Block Alternating Day Schools (N=101)1 Years Under Schedule Type 1 Year Pre- Impl. Year 1 Year Post- 2 Years Post20.4 20.6 20.7 20.6 (1.3) (1.4) (1.3) (1.4) -0.15 0.00 0.07 0.00
Content Area English
2 Years Pre20.6 (1.4) 0.00
Mathematics
20.5 (1.3) -0.07
20.3 (1.3) -0.22
20.6 (1.4) 0.00
20.6 (1.5) 0.00
Science Reasoning
21.3 (1.2) -0.09
21.1 (1.1) -0.29
21.4 (1.0) 0.00
Reading
21.5 (1.5) -0.07
21.2 (1.4) -0.30
21.6 (1.3) 0.00
1
3 Years Post20.8 (1.6) 0.13
4 Years Post20.5 (1.5) -0.07
20.4 (1.3) -0.15
20.6 (1.5) 0.00
20.3 (1.4) -0.21
21.5 (1.2) 0.09
21.5 (1.1) 0.10
21.6 (1.2) 0.18
21.5 (1.2) 0.09
21.6 (1.4) 0.00
21.5 (1.4) -0.07
21.8 (1.5) 0.14
21.5 (1.5) -0.07
Values in parentheses are standard deviations, and values in itallics are effect sizes comparing year in question to implementation year.
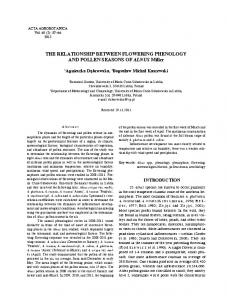
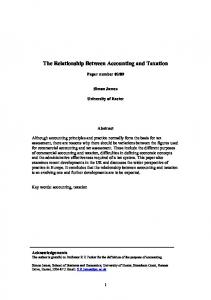
18 Table 2 shows that from two years pre- to four years post-implementation, negligible change occurred in all of the content areas. This change ranged from –0.2 points (Mathematics; ES= -0.15) to +0.2 points (Science Reasoning; ES=0.17). Unlike the drop in achievement observed following the implementation year for 4x4semester schools, the eight-block schools demonstrated generally flat profiles for all four content areas. Some oscillation can be observed in the trend lines, but observed changes were negligible. Like the trends in means, relative stability also was observed in variability and skewness. Eight-period traditional schedule. Schools with the traditional eight-period schedule did not have ACT content area score trends that paralleled one another to the same extent as the other schedule types (see Figure 3). FIGURE 3. Trends in Eight-Period Means 22.5
Mean ACT score
22.0 21.5 Eight-Period Reading
21.0 20.5
Eight-Period: Mathematics
20.0
4 Years Post-
3 Years Post-
2 Years Post-
1 Year Post-
Implementation Year
1 Year Pre-
2 Years Pre-
19.5
Eight-Period: English Eight-Period: Science Reasoning
Years Relative to Implementation of Schedule
Regardless of this relative lack of parallelism, a comparison of means over time resulted in small changes (see Table 3).
19 TABLE 3 ACT Assessment Means for Eight-Period Daily Schools (N=330)1 Years Under Schedule Type 1 Year Pre- Impl. Year 1 Year Post- 2 Years Post20.7 20.7 20.7 20.8 (1.9) (1.8) (1.8) (2.0) 0.00 0.00 0.00 0.05
Content Area English
2 Years Pre20.6 (1.8) -0.06
Mathematics
20.6 (1.7) -0.11
20.6 (1.7) -0.11
20.8 (1.8) 0.00
21.3 (1.9) 0.27
Science Reasoning
21.5 (1.5) -0.06
21.6 (1.6) 0.00
21.6 (1.6) 0.00
Reading
21.4 (1.8) -0.11
21.5 (1.9) -0.05
21.6 (1.9) 0.00
1
3 Years Post20.7 (1.9) 0.00
4 Years Post20.6 (2.0) -0.05
21.1 (2.0) 0.16
21.1 (2.0) 0.16
21.0 (1.9) 0.11
21.7 (1.6) 0.06
21.5 (1.7) -0.06
21.6 (1.6) 0.00
21.7 (1.7) 0.06
21.6 (1.8) 0.00
21.5 (1.9) -0.05
21.6 (1.9) 0.00
21.6 (1.9) 0.00
Values in parentheses are standard deviations, and values in itallics are effect sizes comparing year in question to implementation year.
The observed tendency for negligible change was not universal, as exemplified by the mean change in ACT Mathematics score between the “implementation” year and 1 year post“implementation.” These years corresponded to graduation years 1997 and 1998. The change was a moderate increase of 0.5 scale score points (ES=0.27). Many factors would give rise to such a change, including the population tested, student course-taking patterns, and the use of technology, such as calculators (first permitted in 1997). The actual amount of influence on mean scores that calculator use may have had was unclear, and though success can be achieved in mathematics without calculators, their use may have made some difference in the Mathematics scores. This moderate change in ACT Mathematics mean scores did not manifest itself in block trends, as data from block schools was classified relative to implementation year, rather than relative to chronological year. Should this change have occurred at block schools, this classification would have distributed any such change across data years, given the variability in implementation year.
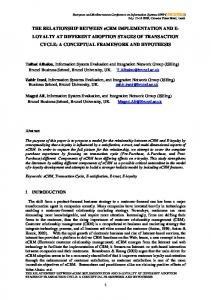
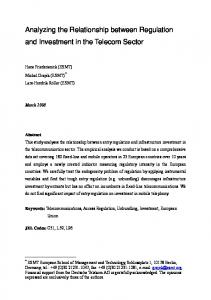
20 Though means for eight-period schools changed little over time, what little change that did occur tended to move in a positive direction. So, unlike 4x4-semester and eight-block schools, eight-period schools demonstrated a tendency toward increasing achievement, regardless of content area, and had few discernable patterns in variability and skewness. Schedule Types Within Content Areas Previous results focussed on comparisons between content areas. However, some notable results became more evident when directly comparing schedule types. Figures 4-7 illustrate these findings, which highlight inter-schedule differences for each content area. English. As can be seen in Figure 4, the 4x4-semester schools exhibited higher achievement in English than did any of the other schedule types before and during implementation. Following implementation, English means for 4x4-semester schools started a downward trend that eventually took them below both eight-block and eight-period schools. Notably, at one year pre-implementation, 4x4-semester schools averaged substantially higher than eight-block schools (0.9 points, ES=0.73) and moderately higher than eight-period schools (0.6 points, ES=0.32). Though the eight-period mean was higher than that of the eight-block schools, the difference was negligible (0.3 points, ES=0.17). FIGURE 4. English Means for Schools Under Various Schedule Types
22.0 21.5 21.0
4x4-Semester: English Eight-Block: English
20.5
Eight-Period: English 20.0
Years Relative to Implementation of Schedule
4 Years Post-
3 Years Post-
2 Years Post-
1 Year Post-
Implementation Year
1 Year Pre-
19.5 2 Years Pre-
Mean ACT English Score
22.5
21 By three years post-implementation, the ordering of means had reversed itself, with eightblock being highest and 4x4-semester being lowest. However, the differences were negligible. The rebound by 4x4-semester schools and concomitant drop by eight-block schools in the fourth year post-implementation re-established the original rank order of means, but the degree to which the 4x4-semester schools outperformed the others was less than before implementation (e.g., 4x4-semester > eight-block, ES=0.29; 4x4-semester > eight-period, ES=0.15). For this set of trends, one might conclude that though there were no substantial differences between means of schedule types after implementation, the drop experienced by 4x4semester schools was a surprise. It would appear that although some rebound in achievement occurred at four years post-implementation, ACT performance at 4x4-semester schools was sacrificed for the students tested at one, two, and three years post-implementation. Mathematics. Because the unique shape of the eight-period Mathematics trend line inhibits comparisons with the other schedule types, only the 4x4-semester and eight-block results will be discussed here. Similar to English, Mathematics means for 4x4-semester schools were initially moderately higher than eight-block means (see Figure 5). FIGURE 5. Mathematics Means for Schools Under Various Schedule Types
22.0 21.5 21.0 4x4-Semester: Mathematics 20.5
Eight-Block: Mathematics Eight-Period: Mathematics
20.0
Years Relative to Implementation of Schedule
4 Years Post-
3 Years Post-
2 Years Post-
1 Year Post-
Implementation Year
1 Year Pre-
19.5 2 Years Pre-
Mean ACT Mathematics Score
22.5
22 However, the 0.6 point advantage held by 4x4-semester schools over eight-block schools at one year pre-implementation (ES=0.49) disappeared, ultimately dipping below the eight-block mean (0.2 points, ES=0.14) by the third year post implementation. As with English, the descending pattern reversed itself in the fourth year post-implementation, with 4x4-semester schools outscoring eight-block schools by a moderate margin (0.4 points, ES=0.29). Unlike English scores, where three years of students taking the ACT Assessment after implementation of a 4x4-semester schedule experienced successive declines in achievement, Mathematics scores experienced the decline only at two and three years post-implementation. Still, achievement levels for multiple years of students suffered. This pattern did not manifest itself in eight-block schools. An important point to consider was that collapsing across all schedule types nationwide, the average mathematics score went up 0.4 points between 1996 and 1997 (Harmston & Pliska, 2001). This change is manifested in the eight-period trend line in Figure 5. However, this effect is distributed across post-implementation years for blocked schools. Hence, the drops in achievement that we observe incorporate this global increase, suggesting that the drops in achievement are not relative to a static baseline, but to a general increasing trend. Therefore, the drops may actually be more meaningful than they appear. Science Reasoning. Figure 6 illustrates that achievement by 4x4-semester schools started a decline after implementation, resulting in 4x4-semester schools becoming the lowest scoring group in years two and three post-implementation.
23 FIGURE 6. Science Reasoning Means for Schools Under Various Schedule Types
Mean ACT Science Reasoning Score
22.5 22.0 21.5 21.0 4x4-Semester: Science Reasoning
20.5
Eight-Block: Science Reasoning Eight-Period: Science Reasoning
20.0
4 Years Post-
3 Years Post-
2 Years Post-
1 Year Post-
Implementation Year
1 Year Pre-
2 Years Pre-
19.5
Years Relative to Implementation of Schedule
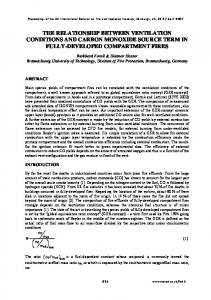
Similar to both English and Mathematics, achievement in Science Reasoning for the year preceding implementation saw 4x4-semester schools scoring substantially higher than eightblock schools (0.8 points, ES=0.76) and negligibly higher than eight-period schools (0.3 points, ES=0.19). Although 4x4-semester schools were the lowest scoring at two and three years postimplementation, the differences between means of the three schedule types were negligible. In the fourth year, the original rank ordering was re-established. However, the 4x4-semester advantage over eight-block schools was only moderate (ES=0.26), and was negligible relative to eight-period schools. For most years, the discrepancy between eight-period and eight-block schools was negligible. Reading. As with the other content areas, 4x4-semester schools started out with higher average scores than the other schools, followed by a subsequent drop in achievement in the first few years following implementation. Unlike other content areas, however, Reading scores did not demonstrate a jump in the fourth year post-implementation. The substantial one year pre
24 -implementation difference between eight-block and 4x4-semester schools of 0.8 points (ES=0.59) all but disappeared in the years following implementation. In fact, mean Reading scores were identical for all schedule types at two years post-implementation, and eight-block and 4x4-semester means were identical at four years post-implementation. After implementation, differences between means of any schedule type were negligible (see Figure 7). FIGURE 7. Reading Means for Schools Under Various Schedule Types
Mean ACT Reading Score
22.5 22.0 21.5 21.0
4x4-Semester: Reading Eight-Block: Reading
20.5
Eight-Period Reading 20.0
4 Years Post-
3 Years Post-
2 Years Post-
1 Year Post-
Implementation Year
1 Year Pre-
2 Years Pre-
19.5
Years Relative to Implementation of Schedule
Within-content area summary. To summarize the results of the within-content area comparisons, eight-period and eight-block schools exhibited achievement levels that were similar to one another over time. Schools with a 4x4-semester schedule had superior achievement up to and including the year of implementation, but tended to drop substantially in subsequent years. The drop brought 4x4-semester schools to levels of achievement at or below those of the other schedule types. With the exception of Reading, 4x4-semester schools exhibited a mean increase in content area scores at the fourth year post-implementation.
25 Discussion Before providing detailed discussion, let us first summarize the results. Whereas the eight-period schools demonstrated a slight upward trend in ACT scores over time (regardless of content area), the blocked schools were not so consistent. Eight-block alternating-day schools tended to demonstrate some variability in ACT scores, but increased little over time. The 4x4block schools demonstrated a generally declining trend in ACT scores across tests, after reaching a peak at or near the year of implementation. With the exception of reading, ACT scores rebounded somewhat at the fourth year post-implementation. Several factors could have given rise to the observed results. First, teachers are expected to change their instructional practices in blocked classes, thereby reducing their reliance on direct instruction methods such as lecturing. A lack of change makes blocked classes simply longer periods of non-engaged classroom time (Wyatt, 1996). However, not all faculty members are equally effective in creating more engaging classrooms. Even under block scheduling, some faculty still persist in lecturing almost exclusively, which can make it difficult to sustain student interest in learning (Hackmann, 1998). The upswing at four years post-implementation may have been due to faculty and students adapting to the new schedule. Differences between results for eight-period and block scheduled schools might also be partially explained by the interrelationship between time and learning. Walberg notes there was a “highly consistent” relationship between increased academic time and improved student performance (as cited in Sadowski, 1998). Apparently, many schools switched from sevenperiod traditional schedules to eight-block or 4x4-semester schedules, and in the process, may have sacrificed the equivalent of 3 to 4 weeks of instructional time in each class over the course of an entire year.
26 The decline in ACT scores found among 4x4-semester schools is consistent with a growing body of research that has examined such schools. As cited earlier, the College Board (1998) determined that students in schools with daily-period schedules earned higher grades on various Advanced Placement examinations than their peers in 4x4-semester schools. Veal and Schreiber (2000) found that traditionally scheduled students outperformed their 4x4-semester classmates on the Indiana Statewide Testing for Educational Progress examinations in mathematics computation, but were not significantly better or worse in Reading and Language. The 4x4-semester schools demonstrated small increases in Mathematics, Science Reasoning, and Reading achievement from two years pre-implementation to the year of implementation. These increases can be attributed to many factors outside the scope of this study, but two possible explanations should be noted. First, students typically complete the ACT Assessment in their junior and/or senior years. In the implementation year, these students would have taken most of their coursework in the traditional scheduling format. Second, an interesting principle of systems theory (Senge, 1990) states that performance initially may improve before it declines. The Hawthorne effect also may come into play as teachers focus on restructuring their lessons. One can assume that, as dedicated professionals, teachers would not want to be involved in an ultimately unsuccessful reform initiative. However, Fullan and Miles (1992) caution that an “implementation dip” normally will occur when school faculties are involved in the process of change, since it is difficult for individuals to sustain these high commitment levels without sufficient professional development and on-going support. Consequently, the drop in ACT scores by 4x4-semester schools at two and three years post-implementation may be explained by these phenomena. This drop was not as noticeable for eight-block schools, due possibly to differences in implementation preparation or factors unique to the schedule type. This study does not
27 provide evidence to fully answer why the 4x4-semester and eight-block had different patterns in post-implementation achievement changes, but serves as a motivator for follow-up research. When schedule types were compared side-by-side within content areas, progressively decreasing differences were noted. In particular, 4x4-semester schools, across all four tests, had moderately to substantially higher average scores in the years prior to and including implementation. However, the post-implementation declines discussed earlier all but eliminated those differences until the fourth year post-implementation for all content areas except Reading. This finding supports earlier reported evidence that students at the 4x4-semester schools manifested both an absolute decrease in achievement and a decrease relative to other schedule types. In other words, 4x4-semester schools that had daily-period schedules before their switch to block had noticeably higher achievement levels than the other schools. The change to a 4x4semester schedule was associated with an elimination of that advantage. One should bear in mind, however, that the limitations of this study (considering only cognitive outcomes, using data from two ethnically homogeneous states, having a small number of 4x4-semester schools) place boundaries upon, but do not invalidate these findings. In a sense, conclusions from this study can be thought of as hypotheses intended to guide future research. Conclusion The present study and its associated literature review suggest that implementing block scheduling involves much complexity, and that such transitions are benefited by extensive prior planning and review of research. Extensive planning and an intimate understanding of the uniqueness of the local school system would facilitate identification of target outcomes for evaluation and development of appropriate plans of action/timelines/budgets to create a firm foundation on which to base preparation for the schedule change. Such knowledge would be of
28 great value when tailoring details surrounding a new schedule to the characteristics of the local school system. Ultimately, decision-makers have to balance potential costs and benefits of the schedule change with goals toward deciding whether the potential for gain outweighs the potential for loss. In the end, the transition from a traditional to block schedule necessitates answering the question, “Does this schedule change meet our needs, given the unique characteristics of our local school? Will our school better meet its goals and objectives as a result of the change?”
29 References ACT, Inc. (1997). ACT Assessment technical manual. Iowa City, IA: Author. ACT, Inc. (2001). ACT average composite scores by state: 2001 ACT-tested graduates. Retrieved September 7, 2001, from http://www.act.org/news/data/01/states.html ACT, Inc. (2002). ACT average composite scores by state: 2002 ACT-tested graduates. Iowa City, IA: Author. Bateson, D. J. (1990). Science achievement in semester and all-year courses. Journal of Research and Science Teaching, 27, 233-240. Canady, R. L., & Rettig, M. D. (1995). The power of innovative scheduling. Educational Leadership, 53(3), 4-10. Cobb, R. B., Abate, S., & Baker, D. (1999). Effects on students of a 4x4 junior high school block scheduling program. Education Policy Analysis Archives, 7(3). Cohen, J. (1988). Statistical power analysis for the behavioral sciences (2nd Ed.). Hillsdale, New Jersey: Lawrence Erlbaum Associates. The College Board. (1998, May). Block schedules and student performance on AP examinations. Research Notes, RN-03. New York: Office of Research and Development, The College Board. Retrieved September 7, 2001, from http://www.collegeboard.org/research/html/rn03.pdf
Dougherty, B. (1998). Policy briefing: Block scheduling in secondary schools. PREL Briefing Paper. Honolulu, HI: Pacific Resources for Education and Learning. (ERIC Document Reproduction Service No. ED415587) Fullan, M. G., & Miles, M. B. (1992). Getting reform right: What works and what doesn't. Phi Delta Kappan, 73, 745-752. Hackmann, D. G. (1998). The challenges of implementing block scheduling in a small school. Planning and Changing, 29, 106-118. Hackmann, D. G. (1999a). The cautious pace of school reform: High school scheduling in Iowa. NASSP Bulletin, 83(609), 69-76. Hackmann, D. G. (1999b). The status of high school scheduling in Illinois. Mid-Western Educational Researcher, 12(2), 25-31. Hackmann, D. G. (2000). Secondary school scheduling trends: Tales of two Midwestern states. Planning and Changing, 31, 226-235. Harmston, M. T., & Pliska, A. M. (2001). Trends in ACT mathematics and science seasoning achievement, curricular choice, and intent for college major: 1995-2000. ACT Research Report Series, No. 2001-3.
30
Harmston, M. T., Pliska, A., & Hackmann, D. G. (2001, November). The relationship between school characteristics, schedule type, and ACT assessment scores: A longitudinal study. Paper presented at the meeting of the 2001 Convention of the University Council for Educational Administration, Cincinnati, OH. Hess, C., Wronkovich, M., & Robinson, J. (1999). Measured outcomes of learning under block scheduling. NASSP Bulletin; 83(611), 87-95. Lockwood, S. (1995). Semesterizing the high school schedule: The impact of student achievement in algebra and geometry. NASSP Bulletin, 79(575), 102. Lyons, R., & Terry, S. (2003). An evaluation of trends in student achievement for Kentucky high schools using different school day schedules. Unpublished manuscript. National Association of Secondary School Principals. (1996). Breaking ranks: Changing an American institution. Reston, VA: Author. National Commission on Excellence in Education. (1983). A nation at risk: The imperative for educational reform. Washington, DC: Author. National Education Association. (2001). Building student achievement through block scheduling. Retrieved September 7, 2001, from http://www.student-wea.org/misc/schedule.htm National Education Commission on Time and Learning. (1994). Prisoners of time. Washington, DC: Author. Northeast and Islands Regional Education Laboratory. (1998). Block scheduling: Innovations with time. Themes in education series. Providence, RI: Office of Educational Research and Improvement, Brown University. Pedersen, J. L. (2001). The effects of scheduling modes on high school student achievement in Iowa. Unpublished doctoral dissertation, Iowa State University, Ames. Pliska, A., Harmston, M. T., & Hackmann, D. G. (2001). The relationship between secondary school scheduling models and ACT Assessment scores. NASSP Bulletin, 85(625), 42-55. Raphael, D., Wahlstrom, M., & McLean, L. D. (1986). The semestered secondary school and student achievement: Results from the Second Ontario International Science Study. Canadian Journal of Education, 11(2), 180-183. Rettig, M. D., & Canady, R. L. (1999). The effects of block scheduling. The School Administrator, 56(3), 14-16,18-20. Sadowski, M. (1998, March/April). Time and learning. The Harvard Education Letter, 14(2), 46.
31 Senge, P. M. (1990). The fifth discipline: The art and practice of the learning organization. New York: Doubleday/Currency. Thayer, Y. V., & Shortt, T. L. (1998-1999). Block scheduling can enhance school climate. Educational Leadership, 56(4), 76-81. Veal, W. R., & Schrieber, J. (2000, April). Block scheduling effects on a state mandated test of basic skills. Paper presented at the 2000 Annual Meeting of the American Educational Research Association, New Orleans, LA. Wilson, C. (1995). The 4x4 block system: A workable alternative. NASSP Bulletin, 79(571), 6365. Wronkovich, M. (1998). Block scheduling: Real reform or another flawed educational fad? American Secondary Education, 26(4), 1-6. Wronkovich, M., Hess, C.A., & Robinson, J. E. (1997). An objective look at mathematics outcomes based on new research into block scheduling. NASSP Bulletin, 81(593), 32-41. Wyatt, L. D. (September, 1996). More Time, More Training. School Administrator, 53(8), 1618. Ziomek, R. L. (2000). Monitoring changes in high school average ACT Composite scores over time. ACT Information Brief Series, No. 2000-2.