Apr 28, 2010 - Page 1 ... take-off velocity, out-run velocity, height of flying at 17 m, height of flying at 75 m, ... Seo, Watanabe, & Murakami, 2004b; Schmölzer,.
Vodičar, J. and Jošt, B.: THE RELATIONSHIP BETWEEN SELECTED KINEMATIC ...
Kinesiology 43(2011) 1:74-81
THE RELATIONSHIP BETWEEN SELECTED KINEMATIC PARAMETERS AND LENGTH OF JUMPS OF THE SKI-FLYING COMPETITION Janez Vodičar and Bojan Jošt Faculty of Sport, University of Ljubljana, Ljubljana, Slovenia Original scientific paper UDC 796.925:577.3:531.1
Abstract: The objective of this study was to analyse selected kinematic parameters (time of flying, in-run velocity, take-off velocity, out-run velocity, height of flying at 17 m, height of flying at 75 m, height of flying at 120 m, aerodynamic index at 17 m, aerodynamic index at 75 m, aerodynamic index at 120 m) of the best world-class ski jumpers participating in the two final individual competitions (Friday and Sunday) of the Ski-Flying World Cup at Planica, Slovenia in 2009 (HS 215 m). All jumps were recorded with three video cameras operating at 50 fps, following the jumpers at the early flight phase (17 m from the take-off edge) and in the middle phase of flying (75 m and 120 m from the take-off edge). The ski jumpers were divided into three statistically significantly differentiated quality groups according to their jump lengths in all three rounds (Fprob.=.01). By means of correlation analysis and single-factor analysis of variance, a smaller number of statistically significant correlations between the defined kinematic variables and the jump length were determined. The differences in the vertical height of flying confirmed a tendency towards positive correlations between this variable and the jump length (r min=.42, r max=.79). The group of the best ski jumpers demonstrated a statistically significant higher vertical height of flying curve in all the three competitive rounds at the points of 75 m (Fprob. were between .00 and .08) and 120 m (Fprob.=.01). The best group of ski jumpers had better aerodynamic positions in the flight phase, especially at the point of 75 m (Sunday, the first round, r =-.73; p =.00) and 120 m (Sunday competition in both rounds, Fprob.=.01). Key words: ski jumps, kinematic flight analysis, Final World Cup Competition 2009, Planica HS 215 m
Introduction The competition in the finals of the 2009 World Cup in Ski Flight was selected to investigate the kinematic factors of the techniques used by ski jumpers on the ski flying jumping hill in Planica (HS 215 m). Jumps over 240 m can be realized on this hill; the flying time can be over 7 seconds; the flying velocity can be between 100 km/h and 115 km/h. The variability of length of the jumps on the biggest jumping hill is always much bigger than on normal jumping hills. This is an opportunity to discover some important differences between the best and the less successful ski jumpers with regard to the chosen kinematic parameters of the ski jumping technique. The variability of length of the jumps is represented by differences in the flying curve. The differences in the flying curves are significant on the bigger jumping hills. The kinematic characteristics of the flying curve are consequences of many kinetic factors of the inertial force environment (Vaverka, 1987). For experts and researchers of ski jumping, analysis of 74
the top-level performers’ ski-jumping technique is the most frequently used solution in the process of finding optimal technique allowing the ski jumpers to accomplish their best competitive performance. Some of these research studies were more focused on the study of the in-run, push-off and early flight phase techniques (Virmavirta & Komi, 1994; Arndt, Brügemann, Virmavirta, & Komi, 1995; Komi & Virmavirta, 1997; Vaverka, Janura, Elfmark, & Salinger, 1997; Jošt, Čoh, Pustovrh, & Ulaga, 1999; Sasaki, Tsunoda, & Hoshino, 2001; Virmavirta, Kiveskas, & Komi, 2001; Joo-Ho Song, Young-Jin Moon, & Young-Hoo Kwon, 2004; Ettema, Braten, & Bobbert, 2005). Some research studies were more focused on the study of the flight technique (Watanabe & Watanabe, 1993; Jošt, 1994; Hiroshi, Shunsuke, Tadaharu, Hirotoshi, & Kazutoshi, 1995; Jošt, Kugovnik, Strojnik, & Colja, 1997; Jošt, Vaverka, Kugovnik, & Čoh, 1998; Schmölzer & Müller, 2002; Seo, Murakami, & Yishida, 2004a; Seo, Watanabe, & Murakami, 2004b; Schmölzer, & Müller, 2005; Virmavirta, Isolehto, Komi, Brüggemann, Müller, & Schwameder, 2005).
Vodičar, J. and Jošt, B.: THE RELATIONSHIP BETWEEN SELECTED KINEMATIC ...
The first goal of the current study was to analyse the relation between in-run and take-off velocity, and the length of flying. The hypothesis was set that the group of best ski jumpers would have a significantly higher in-run velocity than the group of less successful ones. The in-run velocity and take-off velocity influence directly both the horizontal and vertical velocity in the first part of the flight. Performance of a ski jumper, from the aerodynamic factor aspect, first depends on the optimization of the push-off factors in the take-off phase (Virmavirta & Komi, 1994; Komi & Virmavirta, 1997). This means that take-off factors (vertical push-off acceleration, rotation, accuracy of the push-off and the activity of the arms) are aerodynamic efficiency causal factors during the take-off phase (Vaverka, et al., 1997). In the first part of the flying phase, the ski jumper has to assume the optimal aerodynamic position for flying. This will maximize the horizontal velocity and minimize the vertical velocity of flying. From this perspective, it could be expected that the best group of ski jumpers would have a higher flying curve than the group of less successful ones and a better aerodynamic position after the take-off. The flight phase represents a constituent part of the ski jumping technique, which significantly determines the length of the ski jump (Sasaki, et al., 2001; Schmölzer & Müller, 2002, 2005; Seo, et al., 2004). Further, the optimal technique activity of the ski jumper in the flight phase is extremely important. The first parameter that determines the ski-flying technique is the height of the flying curve. The group of least successful ski jumpers has a lower height of flying curve than the best group. The second parameter of the flying technique is the optimal aerodynamic position. The best ski jumpers are supposed to have a better aerodynamic position than the less successful ones. At the beginning of flying, the jumper has to solve two independent tasks of special ski jumping technique. The first one is to reach the optimal height of flying and the second one is to assume and maintain the optimal aerodynamic position (Schmolzer & Müller, 2005; Arndt, et al., 1995; Jošt, et al., 1998; Jošt, et al., 1999; Virmavirta, et.al., 2005). The combination of both parameters is crucial to the best ski jumping technique (Virmavirta, et al., 2005). The height of flying in the beginning of the flight first depends on the take-off force impulse on the take-off table (Virmavirta & Komi, 1994). One part of this take-off force is needed to reach the optimal aerodynamic position and one part to attain the higher curve of flying in the first part of flying. From the aerodynamic aspect of the ski jumping flying technique, the optimal aerodynamic forces (drag and lift force) must be present during the flight phase (Sasaki, et al., 2001). The maximization of lift force has a positive effect on minimizing the negative effect of drag force. In previous research,
Kinesiology 43(2011) 1:74-81
the most significant correlation with the length of the jump was found in the angle between the body and skis, and the ski angle of attack at the end of the first phase of the flight (Jošt, et al., 1998; Virmavirta, et al., 2004). Drag force, acting negatively in the horizontal plane of flying, has to be minimal throughout the flight phase. For this reason, a special aerodynamic index was developed as the vertical distance between the highest point on the body ski jumpers and the to-the-nearest point of the skis. This index would be in a significant negative correlation with the length of the jump. The best group of ski jumpers should have minimal values, and the below-average group of ski jumpers should have maximal values of the aerodynamic index. One of the goals of this research was to discover the correlation, if any, between the length of the jumps and the out-run velocity measured at the space distances from 245 m to 255 m. Namely, it could be hypothetically expected that the least successful group of ski jumpers had a higher out-run velocity than the best group.
Methods
In this research, the ski jumpers participating in three competitive rounds of the 2009 World Cup in Ski Flights at Planica (HS 215 m) were analysed. On the first day (Friday, 20th March, 2009), 40 jumpers competed in only one round (30 jumpers were analysed). In the second competition day (Sunday, 22nd March, 2009), 34 jumpers competed in the first and 30 jumpers in the final round. The ski jumpers were divided into three quality groups (Best, Average, Below Average) according to the jump length in a particular round. Values of the variables (length of the jumps in metres); time of flying in seconds; in-run velocity expressed in km/h, measured according to the FIS rules at a distance of 8 m, that is, 10–18 m before the take-off bridge; take-off velocity in km/h, measured for the last 10 m on the take-off table; out-run velocity in km/h, measured at the distance between the 245th m and 255th m) were obtained from the official records of the Competition Office. The variables of in-run, take-off and out-run velocity were measured with photocells placed .2 m above the snow profile. The kinematic variables ski-flying technique movement, the aerodynamic index of flying (m) and the height of the flying curve (m) were measured by means of a 2-D video analysis. The weather conditions were excellent during recording, with perfect visibility. The recording was carried out with video cameras with a frequency of 50 frames per second. The first camera recorded flying between the 10th and 25th m, the second camera recorded flying between the 60th and 80th m, and the third camera recorded flying between the 110thand 130th m. Digitalization of the selected frames at the 17th m, 75th m and 120th m was carried out manually. The flight position of 75
Vodičar, J. and Jošt, B.: THE RELATIONSHIP BETWEEN SELECTED KINEMATIC ...
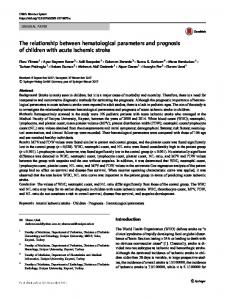
individual athletes was recorded at an average height level of the flying curve. Distances between the ski jumper and cameras depended on the given terrain (between 12.5 m and 80 m). For the calibration of the space dimensions at a chosen point of flying, a specially made cross-shaped marker was used. In Figure 1, the method of space calibration at the point 120 m after the take-off bridge is presented.
Kinesiology 43(2011) 1:74-81
The significance of the correlation between the variable length of the jump and the measured variables was established by using Pearson correlation coefficient (r) for all the subjects in each competitive round. The statistical data were computed for each group separately and reported as means and standard deviations (M, SD). To establish statistical significance of the differences between
Height of flying
Aerodynamic index
Figure 1. Calibration of the space during a flying phase with the specially cross-measured procedure for taking the data of the variables height of flying and aerodynamic index at 120 m.
The 2D model of a jumper’s body and skis consisted of a three-segment model with three reference points. The first point on the body, the trochanter major point, was used to measure the variable height of flying (vertical distance between the snow profile of the jumping hill and the body point trochanter major). The second point was determined as the top of the head or the highest point of the body during the flying phase in the chosen reference space point. The third point was determined as the nearest vertical point of the ski position. The last two points were used to measure the variable aerodynamic index (see Figure 1). The aerodynamic index is the maximum vertical distance between the highest point of the ski jumper’s body and to the ground nearest point on the skis. The minimal values of that index indicate a better aerodynamic efficiency of flying. 76
the groups, a one-way single-factor analysis of variance (ANOVA) was used. The criterion of statistical significance was accepted with a 5% twosided alpha error in both statistical methods.
Results
The differences between the defined quality groups of ski jumpers in the variables of the jump length and the time of flying were statistically significant (Fprob.=.01). The maximal differences (45.7 m) existed in the first round of the second competition on Sunday (Table 1). In Table 2 the statistical results of the in-run, take-off and out-run velocity are shown. The correlation coefficients between the length of the jumps and variables height of flying at the point of 75 m and 120 m were statistically significant (Table 3).
Vodičar, J. and Jošt, B.: THE RELATIONSHIP BETWEEN SELECTED KINEMATIC ...
Kinesiology 43(2011) 1:74-81
Table 1. Analysis of variance for the dependent variables: length of the jump (m) and time of flying (s) Name of the group
BEST
Competitive rounds
n
AVERAGE
M (m)
SD (m)
BELOW AVERAGE
n
M (m)
SD (m)
n
M (m)
Fprob.
SD (m)
Length of the jump (m) 6
199.7
2.7
11
187.5
5.0
23
164.3
15.6
.00**
Sunday 1st round
11
208.2
9.6
12
187.0
4.7
11
162.5
24.5
.00**
Sunday 2nd round
14
205.6
7.0
11
189.4
5.1
5
165.2
18.6
.00**
Friday 1st round
Time of flying (s)
r 6
6.45
.11
11
6.15
.19
23
5.48
.58
.00*
.96**
Sunday 1st round
11
6.99
.32
12
6.36
.16
11
5.62
.76
.00*
.98**
Sunday 2 round
14
6.91
.27
11
6.32
.11
5
5.65
.64
.00*
.95**
Fprob.
r
Friday 1 round st
nd
Table 2. Results of analysis of variance and correlation of the independent variables of velocity Name of the group Competitive rounds
BEST n
AVERAGE
M (m)
BELOW AVERAGE
SD (m)
n
M (m)
SD (m)
n
M (m)
SD (m)
In-run velocity according to FIS (km/h) Friday 1st round
6
103.8
.45
11
103.6
.77
23
103.6
.42
.70
.01
Sunday 1 round
11
101.1
.47
12
100.9
.47
11
101.0
.73
.70
.27
Sunday 2 round
14
101.6
.52
11
101.8
.46
5
101.2
.54
.14
.31*
.58
23
103.0
.56
.86
-.06
st
nd
In-run velocity on the take-off table (km/h) Friday 1st round
6
103.2
.55
11
103.0
Sunday 1 round
11
100.5
.53
12
100.3
.48
11
100.1
.67
.41
.34*
Sunday 2nd round
14
101.0
.52
11
101.0
.55
5
101.0
.43
.98
.15
6
116.9
1.52
11
114.9
1.90
23
116.9
3.40
.16
-.35*
Sunday 1 round
11
109.1
2.44
12
109.4
3.13
11
109.7
2.89
.88
.03
Sunday 2 round
14
108.8
3.43
11
110.0
2.43
5
109.8
2.37
.54
-.28
st
Out-run velocity (km/h) Friday 1st round st
nd
Table 3. Results of analysis of variance and correlation of dependent variables: height of flying at different points of jumping hill Name of the group Competitive rounds
BEST n
M (m)
AVERAGE SD (m)
BELOW AVERAGE
n
M (m)
SD (m)
n
M (m)
SD (m)
.08
11
3.34
.09
23
3.37
.09
Fprob.
r
.18
.07
Height of flying 17m after the take-off edge (m) Friday 1st round
6
3.42
Sunday 1 round
11
3.42
.09
12
3.37
.11
11
3.43
.07
.41
-.05
Sunday 2nd round
14
3.36
.09
11
3.33
.14
5
3.24
.08
.17
.23
3.06
.44
.04*
.59**
st
Height of flying 70m after the take-off edge (m) Friday 1st round
6
3.59
.34
11
3.28
.52
23
Sunday 1 round
11
3.54
.59
12
2.98
.53
11
3.11
.69
.08
.42**
Sunday 2nd round
14
3.70
.47
11
2.92
.65
5
2.59
.69
.00*
.58**
3.98
.98
23
2.85
1.30
.00*
.74**
st
Height of flying 120m after the take-off edge (m) Friday 1st round
6
5.42
.83
11
Sunday 1 round
11
5.34
1.71
12
3.55
.84
11
2.83
1.12
.00*
.79**
Sunday 2nd round
14
5.58
1.12
11
3.85
1.27
5
2.22
.79
.00*
.73**
st
77
Vodičar, J. and Jošt, B.: THE RELATIONSHIP BETWEEN SELECTED KINEMATIC ...
Kinesiology 43(2011) 1:74-81
Table 4. Results of analysis of variance and correlation of independent variables: index of aerodynamic efficiency of flying at different points of the jumping hill Name of the group Competitive rounds
BEST n
M (m)
AVERAGE SD (m)
n
M (m)
BELOW AVERAGE SD (m)
n
M (m)
SD (m)
.16
Fprob.
r
.16
-.17
Index of aerodynamic efficiency of flying 17 m after the take-off edge (m) Friday 1st round
6
1.11
.12
11
1.21
.08
23
1.24
Sunday 1 round
11
1.13
.12
12
1.14
.07
11
1.23
.19
.24
-.13
Sunday 2nd round
14
1.15
.12
11
1.11
.11
5
1.21
.21
.43
.03
.10
23
.54
.09
.17
.07
st
Index of aerodynamic efficiency of flying 70 m after the take-off edge (m) Friday 1st round
6
.49
.08
11
Sunday 1 round
11
.50
.05
12
.57
.05
11
.60
.10
.01*
-.73**
Sunday 2nd round
14
.52
.07
11
.54
.06
5
.57
.05
.49
-.13
st
.59
Index of aerodynamic efficiency of flying 120 m after the take-off edge (m) Friday 1st round
6
.87
.13
11
.94
.13
23
.94
.18
.66
-.18
Sunday 1st round
11
.70
.17
12
.80
.11
11
.91
.16
.01*
-.56**
Sunday 2 round
14
.64
.10
11
.70
.12
5
.98
.45
.01*
-.40**
nd
Legend: n – number of jumpers in selected group, M – arithmetic mean of the group; SD – standard deviation within the group; Fprob. – significance of the F-test, r – Pearson correlation coefficient with the variable length of the jump, (*) – asterisk denotes statistically significant differences between the quality groups of the ski jumpers (*p