Jul 28, 1998 - dependence, Matching sequences, Functional magnetic resonance ... Brie y, spectral analysis has to do with partitioning the variance of a stationary time series, fXt; t = ... Thus, the spectral density can be thought of as the variance density of a ..... Calculate the discrete Fourier transform (DFT) of the data:.
The Spectral Envelope and Its Applications David S. Stoffer�, David E. Tylery, and David A. Wendt� July 28, 1998
Abstract. The concept of the spectral envelope was recently introduced as a statistical basis for the frequency domain analysis and scaling of qualitative-valued time series. In the process of developing the spectral envelope methodology, many other interesting extensions became evident. In this article we explain the basic concept and give numerous examples of the usefulness of the technology. These examples include analyses of DNA sequences, nding optimal transformations for the analysis of real-valued time series, residual analysis, detecting common signals in many time series, and the analysis of textures. Key words. Spectral envelope, Optimal scaling, Fourier analysis, Latent roots and vectors, Principal components, Canonical correlation, Signal detection, Optimal transformations, Coherency, Random elds, Categorical-valued time series, EEG sleep states, DNA, US GNP growth rate, Residual analysis, Long range dependence, Matching sequences, Functional magnetic resonance imaging (fMRI), Pain perception, Textures, Image Retrival. \The reader will note that the various statistics presented are immediate functions of the discrete Fourier transforms of the observed values of the time series. : : : The discrete Fourier transform is given such prominence because it has important empirical and mathematical properties. Following the work of Cooley and Tukey (1965), it may be computed rapidly. The de nitions, procedures, techniques, and statistics discussed are, in many cases, simple extensions of existing : : : multivariate analysis techniques. This pleasant state of a�airs is indicative of the widely pervasive nature of the important statistical and data analytic procedures." David Brillinger (1975, p. viii)
1 Introduction The concept of spectral envelope for the spectral analysis and scaling of categorical time series was rst introduced in Sto�er, Tyler & McDougall (1993a). Since then the idea has been extended in various directions (not only restricted to categorical time series) and we will explore these problems as well. Most of the reference material is reserved for the discussion in Section 7. Before going any further, we will explain what we mean by the emphasized words in the opening sentence.
1.1 Spectral Analysis
Brie y, spectral analysis has to do with partitioning the variance of a stationary time series, fXt ; t = 0; �1; �2; :::g, into components of oscillation indexed by frequency !, and measured in cycles per � y
Department of Statistics, University of Pittsburgh, Pittsburgh, PA 15260. Department of Statistics, Rutgers University, New Brunswick, NJ 08903.
unit of time, for ?1=2 � ! � 1=2. Given a numerical-valued time series sample, Xt ; t = 1; :::; n, that has been centered by its sample mean, the sample spectral density (or periodogram) is de ned in terms of frequency !:
n
2
n
2
n
2
X X X In(!) = n?1=2 Xt exp(?2�i!t) = n?1 Xt cos(2�!t) + n?1 Xt sin(2�!t)
t=1
t=1
t=1
: (1.1)
The periodogram is essentially the squared-correlation of the data with a sines and cosines that oscillate at frequency !. For example, if Xt represents hourly measurements of a persons body temperature that happens to oscillate at a rate of one cycle every 24 hours, then In (1=24) will be large because the data will be highly correlated with the cosine and/or sine term that oscillates at a cycle of ! = 1=24, but other values of In (!) will be small. Although not the optimal choice of a de nition, the spectral density f (!) of the time series can be de ned as the limit as the sample size n tends to in nity of E [In (!)] provided that it exists (details can be found in many time series texts, see Section 7 for a list). It is worthwhile to note that f (!) � 0, f (!) = f (?!), and =
Z 1 2
?1=2
f (!) d! = 2
=
Z 1 2 0
f (!) d! = �2 ;
(1.2)
where �2 = var(Xt ). Thus, the spectral density can be thought of as the variance density of a time series relative to frequency of oscillation. That is, for positive frequencies between 0 and 1/2, the proportion of the variance that can be attributed to oscillations in the data at frequency ! is roughly 2f (!)d!. If the time series Xt is white noise, that is, E (Xt ) is independent of time t, and cov(Xs ; Xt ) = 0 for all s 6= t, then f (!) � �2 . This is interpreted as all frequencies being present at the same power (variance) and hence the name white noise. If n is a highly composite integer, the fast Fourier transform provides for extremely fast calculation of In (j=n), for j = 1; 2; :::; [n=2], where [n=2] is the greatest integer less than or equal to n=2. The frequencies !j = j=n are called the fundamental (or Fourier) frequencies. The sample equivalent of the integral equation (1.2) is: 2
n? 1)=2] X
[(
j =1
n?1 In (j=n) + n?1 In (1=2) = s2 ;
(1.3)
where s2 is the sample variance of the data; the last term is dropped if n is odd. One usually plots the periodogram, In (!j ), versus the fundamental frequencies !j = j=n, for j = 1; 2; :::; [n=2], and inspects the graph for large values. As previously mentioned, large values of the periodogram at !j indicate that the data are highly correlated with the sinusoid that is oscillating at a frequency of j cycles in n observations.
2
Figure 1:
Time series generated from (1.4).
As a simple example, Figure 1 shows a time plot of 128 observations generated by
Xt = cos(2�[!0 t + �]) + �t ; t = 1; :::; 128
(1.4)
where !0 = 13=128 is the frequency of oscillation, � = 10=128 is a phase shift, and �t � iid N(0; 1). Figure 2 shows the standardized periodogram, In (!)=s2 , of the data shown in Figure 1. Note that there is a large value of the periodgram at ! = 13=128 and small values elsewhere (if there were no noise in (1.4) then the periodogram would only be non-zero at ! = 13=128).
Figure 2:
Periodogram of data generated from (1.4).
Because|no matter how large the sample size|the variance of periodogram is unduly large, the graph of the periodogram can be very choppy. To overcome this problem, a smoothed estimate
3
of the spectral density is typically used. One form of an estimate is:
fb(!j ) =
m
X
q=?m
aq In(!j+q );
(1.5)
where the weights are chosen so that aq = a?q are positive and mq=?m aq = 1. A simple average corresponds to the case where aq = 1=(2m + 1) for q = ?m; :::; 0; :::; m. The number m is chosen to obtain a desired degree of smoothness. Larger values of m lead to smoother estimates, but one has to be careful not to smooth away signi cant peaks. An analogous theory applies if one collects k numerical-valued time series, say X1t ; :::; Xkt , for t = 1; :::; n. In this case, write X t = (X1t ; :::; Xkt )0 as the k � 1 column vector of data. The periodogram is now a k � k complex matrix P
"
n
X In (!) = n?1=2 X t exp(?2�it!)
t=1
#"
n
X n?1=2 X t exp(?2�it!)
t=1
#
�
(1.6)
where * means to transpose and conjugate. Smoothing the periodogram also proceeds analogously P to the univariate case, that is, fb(!j ) = mq=?m aq In (!j +q ): The population spectral density matrix, f (!), is again de ned as the limit as n tends to in nity of E [In (!)]. The spectral matrix f (!) is Hermitian [f � (!) = f (!)] and non-negative de nite. The diagonal elements of f (!), say fii (!), for i = 1; :::; k, are the individual spectra and the o�-diagonal elements, say fij (!), for i 6= j = 1; :::; k are related to the pairwise dependence structure among the k sequences (these are called crossspectra). A frequency based measure of the cross-correlation between the series Xit and Xjt is the squared-coherency given by 2 (1.7) �2ij (!) = f j(f!ij)(f!)j(!) : ii
jj
Squared coherency has the same interpretation as squared correlation, that is, 0 � �2ij (!) � 1, with values close to one implying that the two time series are very coherent at frequency !.
1.2 Scaling Categorical Time Series Our work on the spectral envelope was motivated by collaborations with researchers who collected categorical-valued time series with an interest in the cyclic behavior of the data. For example Table 1 shows the per minute sleep-state of an infant taken from a study on the e�ects of prenatal exposure to alcohol. Details can be found in Sto�er et al. (1988), but brie y, an electroencephalographic (EEG) sleep recording of approximately two hours is obtained on a full term infant 24 to 36 hours after birth, and the recording is scored by a pediatric neurologist for sleep state. Sleep state is categorized, per minute, into one of six possible states: qt: quiet sleep - trace alternant, qh: quiet sleep - high voltage, tr: transitional sleep, al: active sleep - low voltage, ah: active sleep - high voltage, and aw: awake. This particular infant was never awake during the study. It is not too di�cult to notice a pattern in the data if one concentrates on active vs. quiet sleep (that is, focus on the rst letter). But, it would be di�cult to try to assess patterns in a longer sequence, or if there were more categories, without some graphical aid. One simple method would 4
Table 1: ah ah ah ah ah ah ah ah tr ah tr ah ah qh
Infant EEG Sleep States (per minute) (read down and across) qt qt qt qt qt tr qt qt qt qt qt qt qt qt
qt qt tr al al al al al tr ah al al al al
al ah ah ah ah ah ah ah tr tr ah ah ah ah
tr tr tr qh qh qt qt qt qt qt qt qt qt qt
qt qt qt qt qt qt qt qt qt tr al al al al
al al al al al al al al al al al al al ah
ah ah ah ah ah ah ah ah tr
be to scale the data, that is, assign numerical values to the categories and then draw a time plot of the scales. Since the states have an order, one obvious scaling is: 1 = qt 2 = qh 3 = tr 4 = al 5 = ah 6 = aw;
(1.8)
and Figure 3 shows the time plot using this scaling. Another interesting scaling might be to combine the quiet states and the active states: 1 = qt 1 = qh 2 = tr 3 = al 3 = ah 4 = aw:
Figure 3:
Time plot of the EEG sleep state data in Table 1 using the scaling in (1.8).
5
(1.9)
The time plot using (1.9) would be similar to Figure 3 as far as the cyclic (in and out of quiet sleep) behavior of this infant's sleep pattern. Figure 4 shows the periodogram of the sleep data using the scaling in (1.8). Note that there is a large peak at the frequency corresponding to 1 cycle every 60 minutes. As one might imagine, the general appearance of the periodogram using the scaling (1.9) (not shown) is similar to Figure 4. Most of us would feel comfortable with this analysis even though we made an arbitrary and ad hoc choice about the particular scaling. It is evident from the data (without any scaling) that if the interest is in infant sleep cycling, this particular sleep study indicates that an infant cycles between active and quiet sleep at a rate of about one cycle per hour.
Periodogram of the EEG sleep state data in Figure 1 based on the scaling in (1.8). The peak corresponds to a frequency of approximately one cycle every 60 minutes. Figure 4:
The intuition used in the previous example is lost when one considers a long DNA sequence. Brie y, a DNA strand can be viewed as a long string of linked nucleotides. Each nucleotide is composed of a nitrogenous base, a ve carbon sugar, and a phosphate group. There are four di�erent bases that can be grouped by size, the pyrimidines, thymine (T) and cytosine (C), and the purines, adenine (A) and guanine (G). The nucleotides are linked together by a backbone of alternating sugar and phosphate groups with the 50 carbon of one sugar linked to the 30 carbon of the next, giving the string direction. DNA molecules occur naturally as a double helix composed of polynucleotide strands with the bases facing inwards. The two strands are complementary so it is su�cient to represent a DNA molecule by a sequence of bases on a single strand. Thus, a strand of DNA can be represented as a sequence of letters, termed base pairs (bp), from the nite alphabet fA; C; G; Tg. The order of the nucleotides contains the genetic information speci c to the organism. Expression of information stored in these molecules is a complex multistage process. One important task is to translate the information stored in the protein-coding sequences (CDS) of the DNA. A common problem in analyzing long DNA sequence data is in identifying CDS that are dispersed throughout the sequence and separated by regions of noncoding (which makes up most of the DNA). Table 2 shows part of the Epstein-Barr virus (EBV) DNA sequence. The entire EBV DNA sequence consists of approximately 172,000 bp. 6
Table 2: AGAATTCGTC GAATCCAGTA CGCCTCGTGT ACTTCTACTC ACCGGTGACA ATGATGTTCG CTTTGCAATT ATTGCTGGCC ATGCAGGTTT TCTGGTGATG TTGTGGCGGC GCTGAGTCCC CGTCCTCTGG GGCAGCAGGT CAGGACTAAC GCACACTTAA CCCTTCCTTT TACAGTGGTT GGCACGACTG TGGCAGTATT
Part of the Epstein-Barr Virus DNA Sequence (read across and down)
TTGCTCTATT TGCCTGCCTG TTCACGGCCT TTGGCAGCAG GTGCTTACTG TGAGATTGAT TGCCTAACAT GCAGCTGGCG GACTTCATAT CTTGTGCTCC ATCATGTTTT CTCCTTGGAG CTCTCTTCGC AAGCCACACG CATGCCATCT CTTGACTACA AACTCATTAC CTCCTGATTT TTCCTATATG TTGCAAACAA
CACCCTTACT TAATTGTTGC CAGTTAGTAC TGGCCAGCTC CGGTTGTCAC CTGTCTCTAA GGAGGATTGA GACTACAAGG GTATGCCTTG TGATACTAGC TGGCATGTGT CTGTAACTGT CAGGGGGCCT TGTGACATTG CTGATTATAG ATGTTCCTTC TTGTTCTTTT GCTCTTCGTG CTCTCGCACT ACTTCAAGAG
TTTCTTCTTG GCCCTACCTC CGTTGTGACC ATATGCCGCT TTGTGAGTAC CAGTTCACTT GGACCCACCT CATTTACGGT GCATGACGTC GTACAGAAGG ACTTGTCCTC GGTTTCCATG AGGTACTCTT CTTGCCTTTT CTCTGGCACT TCATGCTCCT GTAATCGCAG CTCTTCATGT CTTGTTGCTA TTTAAGCAGC
CCCGTTCTCT TTTTGGCTGG GCCACCGGCT GCACAAAGGA ACACGCACCA CCTCTGCTTT TTTAATTCTC TAGTGTGCCT AACTTTACTT AGATGGCGCC ATCGTCGACG ACGCTGCTGC GGTGCAGCCC TGCCACATGT GCTAGCGTCA ATGGACACTT CTCTAACTTG CCACTGAGCA GCCTCCGCGC ACTGAATTTA
TTCTTAGTAT CGGCTATTGC TGGCCCTCTC AACTGCTGAC TTTACAATGC TCTCCTCAGT TTCTGTTTGC CTGTTATGAA TTATTTCAGT GTTTGACTGT CTGTTTTGCA TACTGGCTTT TTTTAACATT TTTCTGGACA CTGATTTTGG GGTAAGTTTT GCATCTCTTT AGATCCTTCT TAATCGCTGG TACCCAGTGA
One could try scaling according to the pyrimidine-purine alphabet, that is A = G = 0 and C = T = 1, but this is not necessarily of interest for every CDS of EBV. There are numerous possible alphabets of interest, for example, one might focus on the strong-weak hydrogen bonding alphabet C = G = 0 and A = T = 1. While model calculations as well as experimental data strongly agree that some kind of periodic signal exists in certain DNA sequences, there is a large disagreement about the exact type of periodicity. In addition, there is disagreement about which nucleotide alphabets are involved in the signals (for example, compare Ioshikhes et al., 1992 with Satchwell et al., 1986); more details are provided in the discussion in Section 7. If we consider the naive approach of arbitrarily assigning numerical values (scales) to the categories and then proceeding with a spectral analysis, the result will depend on the particular assignment of numerical values. For example, consider the arti cial sequence ACGTACGTACGT... . Then, setting A = G = 0 and C = T = 1, yields the numerical sequence 010101010101..., or one cycle every two base pairs (that is, a frequency of oscillation of ! = 21 cycle bp , or a period of oscillation of bp 1 length ! = 2 cycle ): Another interesting scaling is A = 1; C = 2; G = 3; and T = 4; which results in the sequence 123412341234..., or one cycle every four bp (! = 14 ). In this example, both scalings (that is, fA, C, G, Tg = f0, 1, 0, 1g and fA, C, G, Tg = f1, 2, 3, 4g) of the nucleotides are interesting and bring out di�erent properties of the sequence. It should be clear, then, that one does not want to focus on only one scaling. Instead, the focus should be on nding all possible scalings that bring out all of the interesting features in the data. Rather than choose values arbitrarily, the spectral envelope approach selects scales that help emphasize any periodic feature that exists in a 7
categorical time series of virtually any length in a quick and automated fashion. In addition, the technique can determine whether a sequence is merely a random assignment of categories.
2 The Spectral Envelope for Categorical Time Series As a general description, the spectral envelope is a frequency based, principal components technique applied to a multivariate time series. In this section we will focus on the basic concept and its use in the analysis of categorical time series. Technical details can be found in Sto�er et al. (1993a), and the relationship of the spectral envelope to other established techniques will be discussed in Section 7. To x ideas, we will use DNA sequences to explain the technique, but it should be clear that the technique is general. Using the nucleotide alphabet, let Xt ; t = 1; :::; n be a DNA sequence taking values in fA, C, G, Tg. For real numbers = ( 1 , 2 , 3 , 4 )0 , not all equal, denote the scaled (numerical) data by Xt ( ), where
Xt ( ) = 1 if Xt = A; Xt ( ) = 2 if Xt = C; Xt ( ) = 3 if Xt = G; Xt ( ) = 4 if Xt = T. Then, for each frequency, we call (!) the optimal scaling at frequency ! if it satis es (
)
(2.1) �(!) = sup f (!�2; ) ; 6=c1 where f (!; ) is the spectral density of Xt ( ), the scaled data, and � 2 is the variance of the scaled data. Note that �(!) can be thought of as the largest proportion of the power (variance) that can be obtained at frequency ! for any scaling of the DNA sequence Xt , and (!) is the particular scaling that maximizes the power at frequency !. Thus, �(!) is called the spectral envelope. The name spectral envelope is appropriate because �(!) envelopes the spectrum of any scaled process.
That is, for any assignment of numbers to letters, the standardized spectral density of a scaled sequence is no bigger than the spectral envelope, with equality only when the numerical assignment is proportional to the optimal scaling, (!): We say `proportional to' because optimal scaling (!) is not unique. It is, however, unique up to location and scale changes; that is, any scaling of the form a (!) + b1, where a 6= 0 and b are real numbers, and 1 = (1; 1; 1; 1)0 yields the same value of the spectral envelope �(!). For example, the numerical assignments fA, C, G, Tg = f0, 1, 0, 1g and fA, C, G, Tg = f-1, 1, -1, 1g will yield the same normalized spectral density. The value of �(!), however, does not depend on the particular choice of scales. For ease of computation, we set one element of (!) equal to zero (that is, for example, the scale for T is held xed at T = 0) and then proceed with the computations. Figure 5 shows an example that helps to explain the concept. The dashed line shows the standardized spectrum f (!; 1 ) of data using one particular scaling, 1 , that brings out the periodic component in the data at frequencies near ! = :11. The dotted line shows the spectrum, f (!; 2 ), of the same data using a di�erent scaling, say 2 that brings out the periodic component in the data at frequencies near ! = :32. The solid line shows the spectral envelope �(!). The individual spectra are never above the envelope with equality only when the particular scaling is the optimal 8
scaling at that particular frequency. Further information is gained from the spectral envelope in that we can see, because the envelope is small everywhere else, that there are no other interesting scalings or frequencies in this data.
The standardized spectrum f (!; 1 ) using the scaling, 1 (dashed line); the spectrum, f (!; 2 ), using a di�erent scaling, 2 (dotted line); the spectral envelope �(!) (solid line). Figure 5:
Evaluating the spectral envelope, �(!), and the corresponding optimal scaling, (!), is a relatively simple matter and we illustrate this with Xt being a DNA sequence (of course the method generalizes easily). Holding the scale for T xed at zero, form 3 � 1 vectors Y t : Y t = (1; 0; 0)0 if Xt = A; Y t = (0; 1; 0)0 if Xt = C; Y t = (0; 0; 1)0 if Xt = G; Y t = (0; 0; 0)0 if Xt = T. Now with = ( 1 ; 2 ; 3 )0 , the scaled sequence, Xt ( ), can be obtained from the Y t vector sequence by the relationship Xt ( ) = 0Y t . This relationship implies that 0 �(!) = sup f Y0 V(! ) 6=0 (
)
(2.2)
where fY (!) is the 3 � 3 spectral density matrix of the indicator (or point) process, Y t , and V is the variance-covariance matrix of Y t . Although fY (!) is complex, the following relationship holds: 0 fY (!) = 0fYre(!) , where fYre(!) denotes the real part of fY (!). It follows, subject to the constraint 0 V = 1, that �(!) and (!) can be easily obtained by solving an eigenvalue problem with real-valued nonnegative de nite matrices. That is, �(!) is the largest eigenvalue of fYre(!) in the metric of V and (!) is the corresponding eigenvector. In general, if a categorical time series can take on one of k + 1 possible categories, then Y t will be a k � 1 indicator vector and fY (!) will be a k � k Hermitian matrix. An algorithm for estimating the spectral envelope and the optimal scalings given a particular categorical time series (with k + 1 possible categories) is as follows: 9
� Given a sequence, Xt , of length n, form the k � 1 indicator vectors Y t, t = 1; :::; n as previously described.
� Calculate the discrete Fourier transform (DFT) of the data: n
X d(j=n) = n?1=2 Y t exp(?2�itj=n):
(2.3)
t=1
Note that d(j=n) is a k � 1 complex-valued vector. Calculate the periodogram, In (j=n) = d(j=n)d � (j=n), for j = 1; :::; [n=2], and retain only the real part, say Inre (j=n): We remark Pn that the DFT can be inverted so that Y t = n?1=2 j =1 d(j=n) exp(2�itj=n); this is called the inverse discrete Fourier transform (IDFT).
� Smooth the periodogram if desired, that is, calculate f re(j=n) = b
m
X
q=?m
aq Inre
�
j + q�; n
(2.4)
where aq are symmetric positive weights, and m controls the degree of smoothness.
� Calculate the k � k sample variance-covariance matrix, S = n?
1
where Y is the sample mean of the data.
P
n (Y ? Y )(Y t t=1 t
? Y )0 ,
� For each !j = j=n, j = 1; :::; [n=2], determine the largest eigenvalue and the corresponding eigenvector of the matrix 2n?1 S ?1=2 fbre(!j )S ?1=2 . Note that S 1=2 is the unique square root matrix of S:
� The sample spectral envelope �(!j ) is the eigenvalue obtained in the previous step. If b(!j ) b
denotes the eigenvector obtained in the previous step, the optimal sample scaling is b (!j ) = S ?1=2b(!j ); this will result in k values, the value corresponding to the k + 1-st category being held xed at zero.
Any standard programming language/package can be used to do the calculations; basically, one only has to be able to compute fast Fourier transforms, (2.3), and eigenvalues and eigenvectors of real symmetric matrices. Inference for the sample spectral envelope and the sample optimal scalings are described in detail in Sto�er et al. (1993a). A few of the main results of that paper are as follows. If Xt is an iid sequence, and if no smoothing is used (that is, m = 0 in (2.4)), then the following large sample approximation based on the chi-square distribution is valid for x > 0: Prfn2?1 �b (!j ) < xg � . Prf�22k < 4xg ? �1=2 x(k?1)=2 exp(?x)Prf�2k?1 < 2xg ?(k=2);
(2.5)
where k + 1 is the number of categories. In the general case, if a smoothed estimator is used and �(!) is a distinct root (which implies that �(!) > 0), then, independently, for large n and m (we put m � mn and take mn ! 1 as n ! 1 but with mn=n ! 0) : Result I
10
h
i.
� �m �(!) ? �(!) �(!) has a standard normal distribution, and h
b
i
� �m (!) ? (!) has a multivariate normal distribution, b
where the term �m depends on the type of estimator being used. In the case of weighted averaging, Pm ? 2 �m = q=?m a2q [if a simple average is used, aq = 1=(2m + 1), then �m2 = (2m + 1)]. Based on these results, asymptotic normal con dence intervals and tests for �(!) can be readily constructed. Similarly, for (!), asymptotic con dence ellipsoids and chi-square tests can be constructed; details can be found in Sto�er et al. (1993a, Theorems 3.1 - 3.3). As a note we mention that this technique is not restricted to the use of sinusoids. In Sto�er et al. (1993b), the use of a basis of square-waves (called Walsh functions) that take only the values �1 only, is described. Peak searching for the smoothed spectral envelope estimate can be aided using the following approximations. Using a rst order Taylor expansion we have log �b (!) � log �(!) + �(!�) (?!�) (!) ; b
(2.6)
so that �m [log �b(!) ? log �(!)] is approximately standard normal. It also follows that E [log �b(!)] � log �(!) and var[log �b (!)] � �m?2 . If there is no signal present in a sequence of length n, we expect �(j=n) � 2=n for 1 < j < n=2, and hence approximately (1 ? �) � 100% of the time, log �b(!) will be less than log(2=n) + (z� =�m ) where z� is the (1 ? �) upper tail cuto� of the standard normal distribution. Exponentiating, the � critical value for �b (!) becomes (2=n) exp(z� =�m ). Useful values of z� are z:001 = 3:09, z:0001 = 3:71, and z:00001 = 4:26, and from our experience, thresholding at these levels works well.
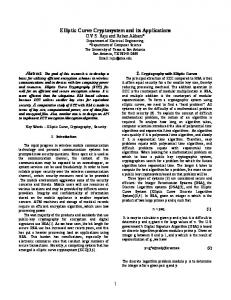
Figure 6:
Smoothed sample spectral envelope of the BNRF1 gene from the Epstein-Barr virus.
As a numerical example, we show how this technology can detect heterogeneities and wrongly assigned gene segments in DNA sequences. In particular, we focus on a dynamic (or sliding-window) analysis of the gene labeled BNRF1 (bp 1736-5689) of Epstein-Barr. Figure 6 shows the spectral envelope (using triangular smoothing with m = 5: a0 = 6=36; a1 = 5=36; :::; a5 = 1=36) of the entire 11
coding sequence (approximately 4000 bp). The gure shows a strong signal at frequency 1/3; the corresponding optimal scaling was A = 0:04; C = 0:71; G = 0:70; T = 0, which indicates that the signal is in the strong-weak bonding alphabet, S = fC; Gg and W = fA; Tg. Figure 7 shows the result of computing the spectral envelope over four 1000 bp windows across the CDS, namely, the rst, second, third, fourth quarters of BNRF1. An approximate 0.001 signi cance threshold is .69%. The rst three quarters contain the signal at the frequency 1/3 (Figure 7a-c); the corresponding sample optimal scalings for the rst three windows were: (a) A = 0:06; C = 0:69; G = 0:72; T = 0; (b) A = 0:09; C = 0:70; G = 0:71; T = 0; (c) A = 0:18; C = 0:59; G = 0:77; T = 0. The rst two windows are strongly consistent with the overall analysis, the third section, however, shows some minor departure from the strong-weak bonding alphabet. The most interesting outcome is that the fourth window shows that no signal is present. In other words, the fourth quarter of BNRF1 of Epstein-Barr is just a random assignment of nucleotides (non-coding).
Smoothed sample spectral envelope of the BNRF1 gene from the Epstein-Barr virus (a) rst 1000 bp, (b) second 1000 bp, (c) third 1000 bp, (d) fourth 1000 bp.
Figure 7:
3 The Spectral Envelope for Real-Valued Time Series The concept of the spectral envelope presented in the previous section was extended to real-valued time series, fXt ; t = 0; �1; �2; :::; g in McDougall et al. (1997). The process Xt can be vector-valued 12
but here, we will concentrate on the univariate case. Further details can be found in McDougall et al. (1997). Let G denote a k-dimensional vector space of continuous real-valued transformations with fg1 ; :::; gk g being a set of basis functions satisfying E [gi (Xt )] = 0 and E [gi (Xt )2 ] < 1, i = 1; :::; k: Analogous to the categorical time series case, de ne the scaled time series with respect to the set G , to be the real-valued process
Xt ( ) = 0Y t = 1 g1 (Xt ) + � � � + k gk (Xt ) obtained from the vector process �
0
�
Y t = g1 (Xt ); :::; gk (Xt )
where = ( 1 ; :::; k )0 2 Rk . If the vector process, Y t , is assumed to have a continuous spectral density, say fY (!), then Xt ( ) will have a continuous spectral density fX (!; ) for all 6= 0. Noting that fX (!; ) = 0 fY (!) = 0 fYre(!) , and �2 ( ) = var[Xt ( )] = 0 V , where V = var(Y t ) is assumed to be positive de nite, the optimality criterion 0 re �(!) = sup f Y0 V(! ) ; 6=0 (
)
(3.1)
is well de ned and represents the largest proportion of the total power that can be attributed to the frequency ! for any particular scaled process Xt ( ): This interpretation of �(!) is consistent with the notion of the spectral envelope introduced in the previous section and provides the following working de nition: The spectral envelope of a time series with respect to the space G is de ned to be �(!), for ?1=2 � ! � 1=2: As in the categorical case, �(!) = �(?!) so it is su�ces to consider �(!) for 0 � ! � 1=2: Similarly, the solution to this problem, as in the categorical case, is attained by nding the largest scalar �(!) such that fYre(!) (!) = �(!)V (!) (3.2) for (!) 6= 0. That is, �(!) is the largest eigenvalue of fYre(!) in the metric of V , and the optimal scaling, (!) is the corresponding eigenvector. If Xt is a categorical time series taking values in the nite state-space S = fc1 ; c2 ; :::; ck g, where cj represents a particular category, then an appropriate choice for G is the set of indicator functions gj (Xt ) = I (Xt = cj ). Hence, this is a natural generalization of the categorical case. Note that in the categorical case G does not consist of linearly independent g's, but it was easy to overcome this problem by reducing the dimension by one. In the vector-valued case, X t = (X1t ; :::; Xpt )0 , we consider G to be the class of transformations from Rp to R such that the spectral density of g(X t ) exists. One class of transformations of interest are linear combinations of X t . In Tiao et al. (1993), for example, linear transformations of this type are used in a time domain approach to investigate contemporaneous relationships among the components of multivariate time series. We will also discuss an interesting application of this in Section 5. Estimation and inference for the real-valued case are analogous to methods described in the previous section for the categorical case. We focus on two examples here; numerous other examples can be found in McDougall et al. (1997). First, a relevant situation may be when Xt is the residual process obtained from some modeling procedure. If the tted model is appropriate then the residuals should exhibit properties 13
similar to an iid sequence. Departures of the data from the tted model may suggest model misspeci cation, non-Gaussian data, or the existence of a nonlinear structure, and the spectral envelope would provide a simple diagnostic tool to aid in a residual analysis. The following is an example. The series considered here is the quarterly US real GNP from the rst quarter of 1947 to the rst quarter of 1991. Tiao & Tsay (1994) analyzed this seasonally adjusted time series by focusing on growth rate, that is, Zt = log(GNPt =GNPt?1 ), and n = 176. Analysis of the ACF (autocorrelation function) and PACF (partial autocorrelation function) of Zt suggested initially that an MA(2) or an AR(3) model would t the data. Both models were t to the data and were found to be similar, that is, the in nite AR representation of the tted MA(2) model was nearly the tted AR(3) model, and all parameters estimates were signi cant. Henceforth, we focus on the results from the MA(2) t. The residuals from this t are plotted in Figure 8. As Tiao & Tsay (1994) found, the residuals from the model t appear to be uncorrelated; there appears to be one or two outliers but their magnitudes are not that extreme. The usual residual analyses showed no obvious structure among the residuals.
Figure 8:
Residuals from an MA(2) t to the US GNP growth rate data.
Although the MA(2) [or AR(3)] model appears to be appropriate, Tiao & Tsay (1994) investigated the possibility of nonlinearities in GNP growth rate. Their overall conclusion was that there is (subtle) nonlinear behavior in the data attributed to the fact that the process behaves di�erently during expansion periods than during recession periods. The spectral envelope, used as a diagnostic tool on the residuals, clearly indicates that the MA(2) [or AR(3)] model is not adequate, and that further analysis is warranted. Here, the generating set G = fx, jxj, x2 g | which seems natural for a residual analysis | was used to get a (smoothed using m = 10 and triangular weighting, a0 = 11=121; a1 = 10=121; :::; a10 = 1=121) spectral envelope for the residuals from the MA(2) t, and the result is plotted in Figure 9. It is clear that the residuals are not iid, and that there is considerable power at the low frequencies. The presence of spectral power at very low frequencies in detrended economic series has been frequently reported and is typically associated with long range dependence. In fact, our choice of G was partly in uenced by the work of Ding et al. (1993) who applied transformations of the form jXt jd , for d 2 (0; 3], 14
to the S&P 500 stock market series. The estimated optimal transformation at the rst non-zero frequency, ! = 0:006 was b(0:006) = (1; 20; ?2916)0 , which leads to the transformation
y = x + 20jxj ? 2916x2 :
(3.3)
This transformation is plotted in Figure 10. The transformation, (3.3), is basically the absolute value (with some slight curvature and asymmetry) for most of the residual values, but note that the e�ect of extreme-valued residuals (outliers) is dampened.
Spectral envelope with respect to G = fx; jxj; x2 g of the residuals from an MA(2) t to the US GNP growth rate data.
Figure 9:
Figure 10:
Estimated optimal transformation, (3.3), for the GNP residuals at ! = 0:006.
15
In a second example, we consider a contrived data set where we known the optimal transformation, say g0 , and we determine whether or not the technology can nd the transformation when g0 is not in G . The data, Xt , are generated by the nonlinear model
Xt = expf3 sin(2�t!0 ) + �t g; t = 1; :::; 512
(3.4)
where !0 = 51=512 and �t is white Gaussian noise with a variance of 16. This example is adapted from Breiman and Friedman (1985) where the ACE algorithm is introduced. The optimal transformation in this case is g0 (Xt ) = ln(Xt ) wherein the data are generated from a sinusoid plus noise as in (1.4). Of the 512 generated data, about 98% were less than 4000. Occasionally, the data values were extremely large (the data exceeded 100,000 about 4 times). The periodogram of the data is shown in Figure 11 and provides no evidence of any dominant frequency, including !0 .
Figure 11:
Periodogram of data generated from (3.4).
Figure 12:
Spectral envelope with respect to G = fx; px; p3 xg of data generated from (3.4).
p p
In contrast, the sample spectral envelope (Figure 12) computed with respect to G = fx; x; 3 xg has no di�culty in isolating !0 . No smoothing was used here, so (2.5) applies with k = 3; this 16
yields an approximate 0.0001 null signi cance threshold of 4.84% (the null hypothesis being that Xt is iid). Figure 12 compares the estimated optimal transformation with respect to G with the log transformation for values less than 4000. The estimated transformation at !0 is given by p p (3.5) y = ?:6 + 0:0003x ? 0:3638 x + 1:9304 3 x; that is, b(!0 ) = (0:0003; ?0:3638; 1:9304)0 after rescaling so that (3.5) can be compared directly to y = ln(x).
Figure 13:
in (3.5).
Log transformation (solid line) and the estimated optimal transformation at !0 (dashed line) as given
Finally, it is worth mentioning the result obtained when the rather inappropriate basis, fx; x2 ; x3 g, was used. Surprisingly, the spectral envelope in this case (Figure 14) looks similar to that of Figure 12. Also, the resulting estimated optimal transformation at !0 , is also very close to the log transformation. In fact, it looks like what one would imagine as a linear approximation to y = ln(x) shown in Figure 13 between x=400 and x=4000.
Figure 14:
Spectral envelope with respect to G = fx; x2 ; x3 g of data generated from (3.4).
17
4 Matching Sequences In this section we consider the problem of quantifying the degree to which two categorical time series are coherent (see (1.7)). The goal is to discover whether the sequences contain similar patterns and the problem is motivated by the matching of two DNA sequences (for example, see Waterman & Vingron, 1994). This approach builds on the ideas used in de ning the spectral envelope for a qualitative-valued time series and technical details can be found in Sto�er & Tyler (1998). We continue to focus on methods that are computationally simple and fast, and can be applied to long sequences.
4.1 The General Problem
In the general case, X1t and X2t , t = 0; �1; �2; :::, are categorical time series taking values in possibly di�erent state-spaces of dimensions k1 +1 and k2 +1 respectively. Consider two nonconstant transformations g and h with g(X1t ) and h(X2t ) being real-valued time series such that g(X1t ) has continuous spectral density fgg (!) and h(X2t ) has continuous spectral density fhh(!). We denote the complex-valued cross-spectral density of the two series g(X1t ) and h(X2t ) by fgh(!). As discussed in Section 1.1, a measure of the degree of similarity between the sequences g(X1t ) and h(X2t ) at frequency ! is the squared coherency (!)j2 : �2gh (!) = f jf(gh !)f (!) gg
hh
(4.1)
Of course the value of �2gh (!) will depend on the choices of the transformations g and h. If X1t and X2t are independent, then so are g(X1t ) and h(X2t ), for any g and h, in which case �2gh (!) = 0 for all !. The main goal here is to nd g and h, under various constraints, to maximize the squared coherency �2gh (!). If the maximized value of �2gh (!) is small we can say that the two sequences X1t and X2t do not match at frequency !. If the maximized value of �2gh (!) is large, then the resulting transformations g and h can help in understanding the nature of the similarity between the two sequences. Analogous to Section 2, we identify the categorical sequence X1t with the multiple indicator process Y 1t . Recall that Y 1t is a k1 � 1 vector with a one in the j -th position if X1t is in state j (j = 1; :::; k1 ) at time t and zeros elsewhere. If X1t is in state k1 + 1, then Y 1t is the zero vector. Similarly, we identify X2t with the k2 � 1 multiple indicator processes Y 2t . We assume the existence of the ki � ki (i = 1; 2), nonsingular spectral density matrices f11 (!) and f22 (!) of Y 1t and Y 2t , respectively, and denote the k1 � k2 cross-spectral matrix between Y 1t and Y 2t by f12 (!). To describe the problem in terms of scaling categorical time series, let � = (�1 ; :::, �k1 )0 2 Rk1 , � 6= 0, be a vector of scalings associated with the categories of the rst series, X1t , and let = ( 1 ; :::, k2 )0 2 Rk2 , 6= 0, be a vector of scalings associated with the categories of the second series, X2t . That is, de ne the real-valued series
X1t (�) = �j if X1t is in state j for j = 1; :::; k1 , X2t ( ) = j if X2t is in state j for j = 1; :::; k2 ,
(4.2)
where, in addition, X1t (�) = 0 if X1t is in state k1 + 1, and X2t ( ) = 0 if X2t is in state k2 + 1. 18
Since the scaled series can be written as X1t (�) = �0Y 1t , and X2t ( ) = 0Y 2t , the squaredcoherency between X1t (�) and X2t ( ) can be written as 0 2 (4.3) �212 (!; �; ) = [�0 f rej(�!)f�12]([! )0 f jre(!) ] : 11 22 Setting a = f11re(!)1=2� and b = f22re(!)1=2 , subject to a0a = 1 and b0b = 1, de ne
Q(!) = f11re(!)?1=2 f12 (!)f22re (!)?1=2 = Qre (!) + i Qim (!)
(4.4)
and write (4.3) as
�212 (!; a;bb) = [a0 Qre (!)b]2 + [a0 Qim(!)b]2 : (4.5) The goal is to nd a and b to maximize (4.5) for each ! of interest. Several approaches to the maximization are available; one approach is based on the following observation:
Result II
Fix ! and drop it from the notation. Then (4.5) can be written as
(4.6) �212 (a;bb) = a0 (Qrebb0Qre + Qimbb0 Qim )a = b0 (Qreaa0 Qre + Qimaa0 Qim )b Let b0 be an arbitrary real-valued k2 � 1 unit length vector. De ne the sequence of vectors aj to be the eigenvector corresponding to the largest root of the at most rank 2, nonnegative de nite matrix
Qrebj?1b0j?1Qre0 + Qimbj?1b0j?1 Qim0
(4.7) and the sequence bj to be the eigenvector corresponding to the largest root of the at most rank 2, nonnegative de nite matrix
Qre0 aj a0j Qre + Qim0 aj a0j Qim;
(4.8)
for j = 1; 2; ::: . Then, from the rst part of (4.6) it follows that �2 (aj +1 ;bbj ) � �2 (a;bbj ) for any a of unit length, and from the second part of (4.6) it follows that �2 (aj+1 ;bbj+1 ) � �2 (aj+1;bb) for any b of unit length. Thus,
�2 (aj+1 ;bbj+1 ) � �2 (aj+1 ;bbj ) � �2 (aj ;bbj )
(4.9)
The algorithm described by Result II can be used to nd the optimal scalings at each frequency, !, of interest. The algorithm is initialized by setting b0 equal to either E1 [Qre (!)0 Qre (!)] or E1[Qim (!)0 Qim(!)], depending on which vector [we denote the eigenvector corresponding to the largest eigenvalue of matrix A by E1 (A)] produces the larger value of (4.5) for arbitrary a. In turn, �(!) and (!) can be taken proportional to f11re(!)?1=2a(!) and f22re(!)?1=2b(!), respectively, where a(!) and b(!) maximize (4.5). Note that the algorithm requires only the computation of latent roots and vectors of at most rank 2, nonnegative de nite matrices, regardless of the dimension of the state-spaces. Moreover, by (4.9), the objective function increases with each step. Unfortunately, it does not guarantee convergence to the global maximum. From simulations, however, it appears to be the case that the algorithm usually converges; Sto�er & Tyler (1998) also provide tight bounds for the maximum of (4.5). 19
4.2 Common Scalings
In many cases the processes X1t and X2t are de ned on the same state-space, S = fc1 ; :::; ck+1 g, for example, DNA sequences. To enhance the interpretation in such cases, it would be appropriate to choose common scalings. Henceforth, set k1 = k2 = k, and assume that Y 1t and Y 2t have the same spectra, that is, f11 (!) = f22 (!) = f (!), for at least all ! of interest. Realistic models that satisfy these conditions will be discussed later. Let = ( 1 ; :::; k )0 2 Rk , 6= 0, be a vector of scalings common to the categories of both series, that is, the real-valued series are
X1t ( ) = j if X1t = cj X2t ( ) = j if X2t = cj ; for j = 1; :::; k. The scale associated with category ck+1 is held xed at zero for both sequences. We restrict attention to the frequencies ! for which f11 (!) = f22 (!) = f (!). Since the scaled series are Xit ( ) = 0Y it , for i = 1; 2, the squared coherency between X1t ( ) and X2t ( ) can be written as 0 2 (4.10) �212 (!; ) = [j 0ff12re((!!)) j]2 :
Setting b = f re(!)1=2 , subject to the standardization b0b = 1, and writing
Q(!) = f re(!)?1=2 f12 (!)f re (!)?1=2 = Qre(!) + i Qim (!); we may write (4.10) as
(4.11)
�212 (!; b) = [b0Qre (!)b]2 + [b0 Qim (!)b]2 :
(4.12) Although Qre (!) and Qim (!) in (4.12) are not necessarily symmetric, we may assume, without loss of generality, that they are since 2 0 im 2 �212 (!; b) = [b0 Qre(!)b]2 + [b0Qim (!)b]2 = [b0 Qre s (!)b] + [b Qs (!)b] ;
(4.13)
where
re re 0 im im im 0 Qre (4.14) s (!) = [Q (!) + Q (!) ]=2 and Qs (!) = [Q (!) + Q (!) ]=2; Our goal is to nd b to maximize (4.13) for each ! of interest. The maximization can still be
accomplished iteratively via the algorithm (4.7)-(4.8) in conjunction with the following result: Result III
Under the conditions described in Section 4.1, if in Result II, k1 = k2 = k and the matrices Qre and Qim are symmetric, the maximum value of �212 (a;bb) is attained when a = b.
im Since Qre s (!) and Qs (!) are symmetric, Result III can be used to maximize (4.13), initializing 2 im 2 the algorithm by setting b0 equal to either E1 [Qre s (!) ] or E1 [Qs (!) ], depending on which vector produces the larger value of �212 (!;bb0 ). The sequence
0 re im 0 im bj = E1 [Qre s (!)bj ?1bj ?1 Qs (!) + Qs (!)bj ?1bj ?1 Qs (!)];
(4.15)
for j = 1; 2; :::; replaces the alternating sequences de ned in (4.7)-(4.8). Note that �212 (!; bj ) � �212 (!; bj?1). The optimal scaling, (!), is chosen proportional to f re(!)?1=2b(!), where b(!) 20
maximizes (4.13). Another important consequence of Result III is that it gives su�cient conditions under which choosing common scales is not only parsimonious but optimal. Speci cally, if Qre(!) and Qim (!) are both symmetric, then the maximum of �212 (!;aa;bb) [see (4.5)] is achieved when a = b.
4.3 Models and Applications For practical applications of the theory presented in Section 4.2, we address two problems. First is the case where the two sequences under investigation are in phase and contain at most one common pattern. They may be subsequences of larger sequences. This will be termed local alignment. The case of global alignment, where we do not assume that the sequences are in phase will be discussed next. The local model is
Y it = pi + S t + eit
(4.16)
where pi = (pi1 ; :::; pik )0 is the vector of positive probabilities pij = Pr(Xit = cj ), for i = 1; 2 and j = 1; :::; k. In addition, S t is a realization of a stationary k � 1 vector-valued time series that is uncorrelated with the stationary k � 1 vector-valued series eit , i = 1, 2. There may be some dependence structure between S t and eit ; refer to Sto�er (1987) for details. Furthermore, S t has k � k spectral density matrix f ss(!), and eit , i = 1, 2, have common k � k spectra denoted by f ee(!). It is hypothesized that the process S t is common to both sequences. Let = ( 1 ; :::, k )0 2 Rk , 6= 0, be a vector of scalings associated with the categories fc1 ; :::; ck g. As before, de ne the real-valued series Xi (t; ) = j if Xit = cj ; j = 1; :::; k, and Xi (t; ) = 0 if Xit = ck+1 , for i = 1, 2. It can be shown that, in this case, the conditions of Result III are met, and hence, the optimal strategy is to select the common scales for the sequences X1t and X2t . Note that Xit ( ) = 0Y it = 0pi + 0S t + 0eit , for i = 1; 2. Let f11 (!; ) be the spectrum of scaled process X1t ( ); similarly, let f22 (!; ) denote the spectrum of X2t ( ) and let f12 (!; ) denote the cross-spectrum between X1t ( ) and X2t ( ). The following conditions hold:
fii(!; ) = 0ffssre(!) + feere(!)g ; i = 1; 2; f12(!; ) = 0fssre(!) :
(4.17)
The coherence between X1t ( ) and X2t ( ) is seen to be 0 re (4.18) �12 (!; ) = 0[f re (!f)ss+(!f)re (!)] : ss ee If fss(!) = 0, then �12 (!; ) = 0 for any scaling . Thus, the detection of a common signal can be achieved by considering the maximal coherency under the model conditions. Setting b = [fssre(!) + feere(!)]1=2 , subject to b0b = 1, write (4.18) as
�12 (!; b) = b0 [fssre (!) + feere(!)]?1=2 fssre(!) [fssre(!) + feere(!)]?1=2 b:
(4.19)
Hence, the problem is again an eigenvalue problem, and the maximum value of (4.19) is the largest scalar �(!) such that [fssre(!) + feere(!)]?1=2 fssre(!) [fssre (!) + feere(!)]?1=2 b(!) = �(!)b(!): 21
(4.20)
The optimal scaling, (!), is taken proportional to [fssre(!) + feere(!)]?1=2 b(!). This value will maximize the coherency at frequency ! between the two sequences, with the maximum value being �(!). That is, �12 (!; ) � �12 (!; (!)) = �(!), with equality only when is proportional to (!): Estimation proceeds in an obvious way: Given consistent (smoothed) estimates fbij (!), for i; j = 1; 2 as described in Section 1.1, put fbssre(!) = [fb12re(!) + fb21re(!)]=2 and fbssre(!) + fbeere(!) = [fb11re (!) + fb22re(!)]=2: (4.21) A frequency based test for a common signal in the scaled sequences X1t ( ) and X2t ( ) is described in Sto�er & Tyler (1998), the null hypothesis being that fss(!) = 0. The basic requirement is that one smoothes by simple averaging (see (1.5)). In this case it was shown that the estimated coherence based on (4.21) is (we use a bar over the estimates to indicate simple averaging): 0 re 1; �12(!j ; ) = 0 re f ss (!j0) re = FF ((!!j ;; )) ? (4.22) +1 f ss (!j ) + f ee (!j ) j provided that F (!j ; ) � 1; otherwise, set �12 (!j ; ) = 0. Here, !j is a fundamental frequency, and for a xed value of !j and , F (!j ; ) has an asymptotic (n ! 1) F -distribution with 2(2m + 1) numerator and denominator df. It follows that the scaling (!j ) that maximizes F (!j ; ) also maximizes (4.22). Moreover, the maximum value of (4.22), under model (4.16), is f�F (!j ) ? 1g=f�F (!j ) + 1g, provided �F (!j ) � 1, where �F (!j ) = sup F (!j ; ); over 6= 0. Under the assumption that Y 1t and Y 2t are mixing, the asymptotic (n ! 1) null distribution of �F (!j ) is that of Roy's largest root. Finite sample null distributions under the additional model assumption that e1t and e2t are both white noise can be obtained by direct simulation. Details can be found in Sto�er & Tyler (1998). The model can be extended to include the possibility that there are more than one signal common to each sequence, and that the sequences are not necessarily aligned. The global model is
Y 1t = p1 +
q
X
j =1
S jt + e1t and Y 2t = p2 +
q
X
j =1
S j;t?� + e2t j
(4.23)
where S jt , j = 1; :::, q, are zero-mean realizations of stationary k � 1 vector-valued time series that are mutually uncorrelated, and in addition are uncorrelated with the zero-mean, stationary k � 1 vector-valued series e1t and e2t . Furthermore, S jt has k � k spectral density matrix fS (!), j = 1; :::, q, and eit , i = 1, 2, have common k � k spectra denoted by fee(!). It is hypothesized that the processes S jt are (stochastic) signals that are common to both time series X1t and X2t , or equivalently, Y 1t and Y 2t . There is no need to specify the phase shifts, �1 ; :::; �q , or the integer q � 0, however, the problem of their estimation is interesting. We consider the following method to help decide whether or not q = 0: Using the notation established in this section: j
f11 (!) = f22 (!) =
q
X
fS (!) + fee (!); and f12 (!) = j
j =1 k )0 2 Rk , 6= 0,
q
X
j =1
fS (!) exp(i!�j ): j
(4.24)
Let = ( 1 ; :::, be a vector of scalings, write Xit ( ) = 0Y it , for i = 1; 2, so that the squared coherency between X1t ( ) and X2t ( ) is Pq 0 f re(!) exp(i!�j ) 2 ; (4.25) �212 (!; ) = j=1 S0 re 2 f (!) j
22
where f (!) = f11 (!) = f22 (!). Setting b = f re(!)1=2 , with the constraint b0b = 1, write (4.25) as
8 1 time series fYjt , t = 1; :::; nj g for j = 1; :::; p, are collected with the primary interest being whether any|and how many|have common cyclic components. In this section we focus on one particular situation dealing with evoked responses. The series need not be in phase and the sample lengths, nj , need not be the same, but are of the same magnitude. In this case, a common sample length, n, that is highly composite is chosen and the data are padded or shortened accordingly. There are various methods to solve this type of problem (see MacNeill, 1977, for example), but here we look at an approach based on the spectral envelope. We take as the model
Yjt = �j + cj St?� + �jt j
(5.1)
where �j is the mean level of the j -th series, St is a zero mean, unit variance, random signal with spectrum fs (!), cj is the amplitude (which may be zero) corresponding to the j -th series and the �jt are independent white noise processes with variance �j2 and independent of St . This model can be extended to the case of more than one signal, as in (4.23), but we concentrate on (5.1) here. Denote the individual DFTs (see (2.3)) by dY (!) for j = 1; :::; p; they are evaluated over ! in the set of positive fundamental frequencies f! = n` ; ` = 1; 2; :::; [ n?2 1 ]g. In terms of the model (5.1), these can be written as dY (!) = aj dS (!) + d� (!) (5.2) where dS (!) and d� (!) represent the transforms of the signal and of the noise, respectively, and aj = cj exp(?2�i�j ). j
j
j
j
24
Let Y t = (Y1t ; :::; Ypt )0 be the vector of observations, and let dY (!) denote the p � 1 vector of transforms with j -th component dY (!). If component j does not contain the signal, then aj = 0, and we arrange the vectors so that for 0 � q � p, aq+1 = � � � = ap = 0, and none of the fa1 ; :::; aq g are zero. Then, the model (5.2) can be written as j
dY (!) = adS (!) + d�(!)
(5.3)
where a is the p � 1 complex vector a = (a1 ; :::; aq ; 0; :::; 0)0 , and d�(!) is the p � 1 vector of transforms with j -th component d� (!). Let fY (!) be the p � p spectral matrix of Y t . Then, we have the following decomposition: j
fY (!) = afS (!)a� + f�(!)
(5.4)
where afS (!)a� is a Hermitian block diagonal matrix, and f�(!) = diagf�12 ; :::; �p2 g. Rather than work with the original series, we prefer to work with the standardized series, Z t = V ?1=2Y t , where V = diagf�Y21 ; :::; �Y2 g; note that the diagonal elements of V get contributions from both the signal (if present) and the noise, that is, �Y2 = c2j + �j2 where cj could be zero. Writing (5.4) in terms of the standardized processes, Z t , we have p
j
fZ (!) = a(!)a� (!) + D(!);
(5.5)
note that (5.5) is a type of complex factor analytic representation for fZ (!) = V ?1=2 fY (!)V ?1=2 . That is, fZ (!) is the sum of a rank 1, non-negative de nite Hermitian matrix, a(!)a� (!), and a diagonal positive de nite matrix, D(!), where a(!) is a p � 1 complex-valued vector such that a(!)a� (!) = V ?1=2afS (!)a�V ?1=2 and the nal p ? q elements of a(!) are zero. In addition, we are restricting attention to case where D(!) = V ?1=2 f�(!)V ?1=2 is constant over !, that is, D(!) � diagf�12 =�Y21 ; :::; �p2 =�Y2 g. The value q corresponds to the number of elements that contain the signal. Since fS (!) is real, if the series are in phase, that is, �1 = � � � = �q = 0, then fZ (!) will also be real. Let 6= 0 be a complex-valued p � 1 vector of scalings and consider the standardized, scaled complex series, Xt ( ) = �Z t . We may now write p
fX (!; ) = � fZ (!) ;
(5.6)
where fX (!; ) is the spectral density of Xt ( ). If we believe that the series are in phase (�1 = � � � = �q = 0), then there is no particular advantage to considering complex-valued scales and we would restrict to be a vector of real scalings. For generality we focus on the complex case, the real case follows as in Sections 2 and 3. Our goal is to nd , at each !, to maximize (5.6), subject to the constraint � = 1. We will denote the solution by (!). Setting b = V ?1=2 leads to the optimality criterion � � � b f ( ! ) b Y (5.7) �(!) = sup b� V b : b6=0 The function �(!) is the spectral envelope because fX (!; ) � �(!), for any scaling , with equality when = (!). The corresponding scaling (!) is the optimal scaling. The idea in employing (5.7) is that the right (complex) linear combination of the p series, namely Xt ( (!)), will enhance 25
the signal and dampen the noise. Note that we have reversed the roles of and b in this section from their roles in the previous sections. The solution to (5.7) is obtained by nding, at each Fourier frequency !, the largest eigenvalue, �(!), and corresponding eigenvector, (!), of the matrix fZ (!) = V ?1=2 fY (!)V ?1=2 which, as we previously stated, is the sum of the block diagonal matrix (with nonzero values only in the upper q �q portion) a(!)a� (!) = aV ?1=2 fS (!)V ?1=2a� and the diagonal real matrix D(!) = V ?1=2 f�(!)V ?1=2 that is constant with respect to !. From this it is seen that if there is a harmonic component near ! in q of the p series, then �(!) will be `large' and the nal p ? q components of (!) will be zero. In regions where there is no harmonic component, fS (!) will be negligible so that �(!) will be
at and the nal p ? q components of (!) will not be zero|in fact, the modulus of those p ? q elements may dominate the rst q elements if the signal amplitudes are large. These facts will lead to reasonable conclusions about the nature of the signal and the number of elements q that contain the signal. We have also found that it is worthwhile to look at the unstandardized results, that is, replace V with the identity matrix in (5.7); this aids in the identi cation of interesting frequencies. Estimation is accomplished by the techniques discussed in the previous sections. For an example, we discuss part of an analysis that was performed in Sto�er et al. (1998); more details can be found there. The analysis focuses on a study that used functional magnetic resonance imaging (fMRI) to examine pain perception in humans (Antognini et al., 1998). Two types of stimuli were presented to awake subjects: electric shock (15 mA, 2 Hz) and non-painful brush. The e�ects of general anesthesia on pain perception were evaluated by comparing results from alert volunteers with those from the same volunteers while anesthetized and paralyzed with 0.15 mg/kg Vecuronium. Data were collected under two anesthetic conditions, 0.7% (low), and 1.3% (high) Iso urane. During the anesthetized conditions a supramaximal shock (50 mA, 100 Hz) stimulus was added. This stimulus was used to simulate surgical incision without in icting tissue damage. The stimulus conditions were: [1] Awake-Brush (5 subjects), [2] Awake-Shock (5 subjects), [3] Low-Brush (3 subjects), [4] Low-Supramaximal Shock (4 subjects), [5] High-Brush (4 subjects), and [6] High-Supramaximal Shock (5 subjects). The speci c locations of the brain where the signal was measured were: L1. L2. L3. L4. L5. L6. L7. L8. L9.
Cortex: Primary Somatosensory, Contralateal Cortex: Primary Somatosensory, Ipsilateral Cortex: Secondary Somatosensory, Contralateal Cortex: Secondary Somatosensory, Ipsilateral Caudate Thalamus: Contralateal Thalamus: Ipsilateral Cerebellum: Contralateral Cerebellum: Ipsilateral
The data consist of consecutive measures of blood oxygenation level dependent (bold) signal intensity; for details, see Ogawa et al. (1990 a,b). Areas of activation were analyzed over time at the level of the voxel, or three dimensional pixel; the voxel with the highest activation was chosen from each brain location. The sampling rate was one observation every two seconds for 256 26
seconds (n = 128). Each stimulus was applied for 32 seconds and then stopped for 32 seconds; thus, the signal period is 64 seconds. For this analysis, we averaged over subjects in each stimulus condition (these were evoked responses and all subjects were in phase) producing data, Yjt , for each stimulus condition [1]-[6]. Thus, for a given stimulus condition, Yjt represents the average bold signal intensity at location j , for j = 1; :::; 9, at time point t, for t = 1; :::; 128.
Figure 16:
The bold signal intensities at all nine locations for the stimulus condition Awake-Brush.
Figure 17:
The bold signal intensities at all nine locations for the stimulus condition High-Brush.
The types of data encountered in this experiment are quite varied. For example, Figure 16 shows the nine time series, one for each location, of the stimulus condition Awake-Brush. It is clear from the data, in this case, that most locations received the brush signal of approximately four cycles in 128 points. Figure 17, however, for the stimulus condition High-Brush, is quite di�erent than Figure 16, and it is not clear whether or not any location received any signal. If we focus on real scales, then the results of Section 2 (in particular Result I) apply . If the focus is on complex scales, then the rst part of Result I remains valid, but b(!) will have a complex multivariate normal distribution. In the analyses that we present here, it seems more appropriate to focus on the complex scaling case; the case of real-valued scalings gives approximately 27
the same results and leads to the same conclusions about the nature of pain perception. In this analysis we have n = 128, m = 2 with weights fa0 = 3=9; a�1 = 2=9; a�2 = 1=9g, so that p �m = 81=19 = 2:065, and using (2.6), the approximate 0:001 critical threshold for this example is expf3:09=2:065g=64 = 7%. Inference about the optimal (complex) scaling vector can be performed using Brillinger (1975, Theorems 9.4.3 and 9.4.4) wherein the asymptotic (n; m ! 1) covariance matrix of the sample optimal scaling, b(!), say � (!), is given by � (!) = �m?2 �1 (!)
p
X
`=2
�`(!) f�1 (!) ? �` (!)g?2 ` (!) �` (!);
where f�1 (!) = �(!); �2 (!); :::; �p (!)g are the latent roots of V ?1 fY (!) arranged in decreasing order, and f 1 (!) = (!); 2 (!); :::; p (!)g are the corresponding latent vectors. We may use this result to form con dence regions for the components, b1;j (!), j = 1; :::; p, of the optimal scaling vector by approximating the distribution of
2
2 b1;j (!) ? 1;j (!) s2j (!)
(5.8)
by a �2 distribution with 2 degrees of freedom. In (5.8), s2j (!) is the j -th diagonal element of �b (!), the estimate of � (!). We can use (5.8) to check whether or not the value of zero is in the con dence region by comparing 2j b1;j (!)j2 =s2j (!) with �22 (1 ? �), the 1 ? � upper tail cuto� of the �22 distribution.
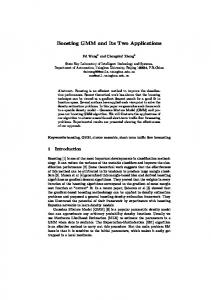
The sample spectral envelope, b�(!), for the Awake-Brush stimulus condition. The peak in the spectral 4 . envelope occurs at the frequency ! = 128 Figure 18:
First we describe the analysis of the stimulus condition Awake-Brush. We consider 7% to be an approximate signi cance threshold for the sample spectral envelope. Figure 18 shows the sample spectral envelope for the Awake-Brush condition. There is a clear peak in the sample spectral envelope, �b (4=128) = 34%, corresponding to frequency of ! = 4 cycles/128 points, or 4/256 Hz, which corresponds to the stimulation period of 64 seconds. The magnitudes of the optimal sample scalings for Awake-Brush at this frequency are listed in Table 3. In addition, Table 28
Scalings for the Brush Stimulus under Conditions Awake and High Anesthesia Table 3:
Location L1 L2 L3 L4 L5 L6 L7 L8 L9
Awake-Brush j b( 1284 ) j 0.46 0.40 0.45 0.40 0.08* 0.28 0.15 0.09* 0.39
High-Brush j b( 1284 ) j 0.50 0.28 0.48 0.43 0.34 0.24 0.16 0.14* 0.18
*The value of zero is in an approximate 99% con dence region for this component.
3 indicates whether an approximate 99% con dence region of an element of the sample optimal scaling includes zero; these regions are based on (5.8). Table 3 indicates that locations L5 (caudate) and L8 (cerebellum: contralateral) are probably not receiving the signal.
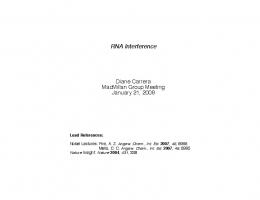
The sample spectral envelope, b�(!), for the High-Brush stimulus condition. The peak in the spectral 4 . envelope occurs at the frequency ! = 128 Figure 19:
Figure 19 refers to the stimulus condition High-Brush. In this case, the spectral envelope shows a peak, �b(4=128) = 18:8% at ! = 4=128, and Table 3 shows that at this frequency, only location L8 (cerebellum: contralateral) is probably not receiving the brush signal. Note that for the anesthetic condition, the sample spectral envelope (and hence the signal power) is about half that of the awake conditions. This is consistent across all stimulus-conditions and interpretation 29
of these results, as well as the results for the other stimulus-conditions, can be found in Sto�er et al. (1998). In summary, the analyses provided evidence that nociceptive inputs play a role in activating areas of the cortex that are traditionally considered to be involved primarily in tactile discrimination. Furthermore, the results contributed to a growing body of evidence suggesting that the basal ganglia are involved in the perception of pain.
6 Qualitative Random Fields Another extension of optimal scaling and the spectral envelope that is currently under exploration is the analysis of qualitative spatial data. Here, we let fXt ; t = (t1 ; t2 ); t1 ; t2 = 0; �1; �2; :::g be a homogeneous, categorical-valued, 2D random eld taking values in the nite set C = fc1 , c2 ; :::, ck+1 g. For example, C could be an eight bit grayscale or a 256 color palette (k + 1 = 256). Analogous to Section 2, for = ( 1 , 2 ,..., k )0 2 Rk , let Xt ( ) denote the real-valued stationary 2D random eld corresponding to the scaling that assigns the category cj the numerical value j , j = 1, 2,..., k, and ck+1 the value 0. The goal is to nd scalings so that the spectral density (or wave number spectrum) of Xt ( ), say fX (! ; ), with ! = (!1 ; !2 ) 2 [?1=2; 1=2]2 , is in some sense interesting. As in the 1D case, we choose (! ) at each fundamental frequency (or wave number) ! so that � � (6.1) �(! ) = sup fX�(2!( ; ) ) ; 6=0 where �2 ( ) = varfXt ( )g: Building on the ideas of Section 2, identify the categorical random eld, Xt , with the k � 1 multiple indicator process Y t de ned by Y t = ej if Xt = cj ; j = 1; :::; k; and Y t = 0 if Xt = ck+1 , where ej is a k � 1 vector with a one in the j -th position and zeros elsewhere, and 0 is a k � 1 vector of zeros. Assume the existence of the k � k nonsingular spectral density fY (! ) . The scaled series can be written as Xt ( ) = 0Y t and hence the wave spectrum of Xt can be written as fX (! ) = 0 fYre(! ) . The optimality criterion is 0 re (6.2) �(! ) = sup f Y0 V(! ) 6=0 where V is the variance-covariance matrix of Y t : Again the problem is reduced to an eigenvalue problem. The optimality criterion �(! ) and the resulting optimal scaling (! ) have interpretations analogous to the 1D case described in Section 2. In addition, inference and estimation of �(! ) and (! ) follow from Section 2 results. (
)
The applications that motivate this are automated image retrieval and pattern recognition with potential use in computer vision. E�orts of digitizing massive archives of image, lm, and video have created a demand for automated retrieval systems. Such systems would save the time and e�ort needed to browse entire databases, for example, in medical image query; see Liu & Picard (1996) for a recent discussion. In particular, the spectral envelope appears to have potential in the analysis of textures. Textures are homogeneous patterns or spatial arrangements of pixels that regional intensity or color alone does not su�ciently describe. Textures may consist of structured and/or random 30
placement of elements, but also may be without fundamental subunits. Texture is an important element to human vision and has been found to provide cues to scene depth and surface orientation. Due to the diversity of textures appearing in natural images it is di�cult to narrowly de ne texture. Most research on texture is conducted on the Brodatz (1966) texture collection which provides a set of mostly homogeneous texture images. It has been hard to adequately model texture and the substantial body of work on texture has not yet produced any clear solutions for the problems of texture analysis, classi cation, and synthesis. Several recent content-based image retrieval systems utilize texture feature sets to aid in the retrieval of images. Within the applications of satellite image retrieval, recent systems by Li and Turek (1996), for example, use texture to retrieve images based upon the detection of various features of the earth's terrain. The IBM QBIC system (Niblack et al., 1993) uses several texture features for the retrieval of photographic images. Both the whole images and manually identi ed regions are indexed by texture in the QBIC system. For our example, we use the herringbone weave texture. Figure 20 shows the original 256 � 256 texture using an 8-bit grayscale. In Figure 21(1; 1) [that is, the picture in row 1, column 1 of Figure 21], we have reduced the image to 64 � 64; in addition, the 8-bit gray scale was binned by a factor of 4, resulting in 26 = 64, rather than 28 = 256, gray levels. This gives the image its noisy appearance. Figure 22 shows the smoothed (using a Gaussian smoother) sample spectral envelope, where any value below 19% is zeroed out. The value of 19% corresponds to an approximate � = 10?6 threshold. In Figure 22, noting that there is folding, that is, �b(!x ; !y ) = �b(?!x ; ?!y ), it is seen that there are about four major peaks in the spectral envelope at frequencies: [1] (!x ; !y ) = (0; :5); where the spectral envelope accounts for about 51% of the total variation, [2] (!x ; !y ) = (:5; 0); accounting for about 45% of the variation, [3] (!x ; !y ) = (?:25; :25); accounting for about 26% of the total variation, and [4] (!x ; !y ) = (:05; :45); where the spectral envelope accounts for about 20% of the variation.
Figure 20:
Herringbone weave from the Brodatz texture collection; this is a 256 � 256 image in 8-bit gray levels.
31
30
40
50
60
0
10
20
30
40
50
60
60 0
10
20
30
40
50
60
0
10
20
30
40
50
60
10
20
30
40
50
60
0
10
20
30
40
50
60
50 0
10
20
30
40
50 0
10
20
30
40
50 40 30 20 10 0
0
60
20
60
10
60
0
0
10
20
30
40
50
60 50 40 30 20 10 0
0
10
20
30
40
50
60
Figures 21(1; 2) (1; 3) (2; 1) (2; 2) show the image associated with a peak in the spectral envelope as follows. If b[i], for i = 1; 2; 3; 4, represents the scaling associated with the spectral envelope at one of the (!x ; !y ) pairs listed above, then Figures 21(1; 2) (1; 3) (2; 1) (2; 2) show Xt ( b[i] ) = b0[i]Y t , in the order of magnitude associated with the spectral envelope. That is, Figure 21(1; 2) shows Xt ( b[1]), Figure 21(1; 3) shows Xt ( b[2]), Figure 21(2; 1) shows Xt ( b[3] ), and Figure 21(2; 2) shows Xt ( b[4]). For a general description, the palettes b[i], for i = 1; 2; 3; 4, are basically three gray levels: white, black, and a mid-level gray. In addition, each b[i] palette, in general, sets one gray level to white, a few gray levels to mid gray, and the majority of levels to black.
Figure 21: (1; 1) The noisy herringbone weave image (compare to Figure 20); this is 64 � 64 using a 6-bit gray scale; (1; 2) reconstruction Xt ( b[1] ) as de ned in the text; (1; 3) reconstruction Xt ( b[2] ); (2; 1) reconstruction Xt ( b[3] ); (2; 2) reconstruction Xt ( b[4]); (2; 3) reconstruction of the image using the four peaks [1]-[4] in the spectral envelope.
Optimal reconstruction of the image using all of the pertinent information in the spectral envelope and the corresponding palettes (scalings) is currently under investigation. One simple idea is to invert the spectral information back to the time domain and then redraw the picture. For example, if Xt is the original image, and g is the original gray scale, then Xt = g 0Y t , where Y t is the indicator process de ned prior to (6.2). If dY (! ) represents the DFT of Y t , then Y t is the IDFT of dY (! ). One may think of obtaining a less noisy process, say Yb t , by thresholding dY (! ), that is, at any particular ! , set dY (! ) = 0 if its modulus is smaller than some predetermined value, and then inverting the thresholed DFT. We use this idea, getting an approximate thresholded DFT, say dbY (! ) by putting dbY (! ) = 0, except when ! = [1]; [2]; [3]; [4], the frequencies listed above (and their folding values). In these cases, we set dbY ([i]) = �b1[i=] 2 b[i], for i = 1; 2; 3; 4, where �b [i] is the estimated spectral envelope at those particular frequencies (as shown in Figure 22). Figure 21(2; 3) shows a 32
0
0.1
Spectral Envelope 0.2 0.3 0.4 0.5
0.6
reconstruction of the image based on inverting dbY (! ) to obtain a less noisy process Yb t , and then reconstructing the image as Xbt = g 0Yb t .
0.4 0.2 Cy cle
s p0 er C
0.4
olu-0.2 mn
0.2
-0.
4
-0.2 -0.4
Cycles
0 w per Ro
The sample spectral envelope, b�(! ), for the 64 � 64 herringbone weave image, using a 6-bit gray scale, as shown in Figure 21(1; 1) . For clarity, values less than 19% are shown as zero.
Figure 22:
7 Discussion and Other References There are a number texts devoted primarily to spectral analysis, for example Bloom eld (1976), Brillinger (1975), Hannan (1970), Priestley (1981), and Percival & Walden (1993). There are also many texts on time series analysis that present spectral analysis integrated with time domain (regression) analysis, for example, Brockwell and Davis (1991), Chat eld (1989), Fuller (1995), and Shumway (1988). The material on scaling time series is rather sparse and we do not know of any particular references besides those already mentioned. The basic idea, however, has been extensively used for the analysis of contingency tables and regression with qualitative variables; these come under the titles of dual scaling, for example, Nishisato (1980) and correspondence analysis, for example, Greenacre (1984). These and related topics are also discussed in Breiman & Friedman (1985) where the focus is on obtaining optimal transformations, numerically, in various situations. Fourier analysis of categorical time series has been applied successfully in molecular genetics for quite some time. For example, McLachlan & Stewart (1976) and Eisenberg et al. (1984) studied the periodicity in proteins with Fourier analysis. They used prede ned scales (or alphabets) and observed the ! = 31:6 frequency of amphipatic helices. Because predetermination of the scaling is arbitrary and may not be optimal, Cornette et al. (1987) reversed the problem and started with a frequency of !0 = 31:6 and proposed a method to establish an `optimal' scaling at !0 = 31:6 . In this setting, optimality roughly refers to the fact that the scaled (numerical) sequence is maximally correlated with the sinusoid that oscillates at a frequency of !0 . Viari et al. (1990) generalized this approach to a systematic calculation of a type of spectral envelope (which they called �-graphs) and of the corresponding optimal scalings over all fundamental frequencies. While the aforementioned 33
authors dealt exclusively with amino acid sequences, various forms of harmonic analysis have been applied to DNA by, for example, Tavar�e and Giddings (1989), and in connection to nucleosome positioning by Satchwell et al. (1986) and Bina (1994). The basic technique of the spectral envelope for categorical time series is similar to the methods established in Tavar�e and Giddings (1989) and Viari et al. (1990), however, there are some di�erences. In particular, the techniques di�er by the optimality criterion. Also, the spectral envelope methodology is developed in a statistical (rather than visual) setting to allow the investigator to distinguish between signi cant results and those results that can be attributed to chance. As indicated in Section 2, the spectral envelope and related topics could come under the general titles of principal component analysis or canonical analysis of time series in the spectral domain. These topics are discussed in detail in Chapters 9 and 10 of Brillinger (1975) and there is a connection between Brillinger's work and ours. Speci cally, the spectral envelope can be viewed as a special case of Brillinger's principal components. In the language of Brillinger (1975, Section 9.3), suppose we want to approximate Y t , a k � 1 stationary time series with mean �Y , variancecovariance matrix VY , and spectral matrix fY (!), by nding a scalar process, Zt , de ned by
Zt =
1
X
j =?1
b0t?j Y j ;
(7.1)
and absolutely summable k � 1 lters fbt g and fct g, so that the error of approximation, Y t ? Yb t is P1 small relative to mean squared error, where Yb t = �Y + j =?1 ct?j Zj . If b(!) is the transform of bt , and fZ (!) the spectral density of Zt , then the problem becomes one of nding a complex vector b(!), subject to the constraint that b� (!)VY b(!) = 1 such that
fZ (!) = b� (!)fY (!)b(!) is maximized. The solution, of course, is that b(!) is the eigenvector corresponding to the largest eigenvalue of fY (!) in the metric of VY , say �(!), and fZ (!) = �(!) with b(!) so chosen in (7.1) [also, the transform of ct is b� (!)]. In the language of scaling, we would state the same problem as: Given a vector process Y t , nd a complex vector, b such that, at a given frequency !, the time series Zt (b) = b�Y t has the largest possible spectrum (subject to b� VY b = 1). The solution is to choose b = b(!), that is, the eigenvector corresponding to the largest eigenvalue of fY (!) in the metric of VY . In this case the spectrum of Zt (b(!)), say fZ (!;bb(!)), attains the largest possible value, �(!). Hence, Brillinger's approach can be seen as a scaling problem with complex-valued scales. If we restrict b(!) to be real, then Sections 2 and 6 have Y t being the multiple indicator process associated with a categorical-valued process. In Section 3, b(!) was also restricted to be real, but the Y t process was generated by a space of transformations. In Section 5, we took the scalings b(!) to be real or complex depending on whether or not it was advantageous to do so. In the real case, the material in Sections 2 and 3 apply, and in the complex case, Brillinger (1975, Ch 9) applies. The discussion of matching sequences, Section 4, is related to canonical analysis. Let Y 1t and Y 2t be as de ned in Section 4. Brillinger (1975, ch 10) discusses a time series extension of canonical correlation analysis that could be used in Section 4 as a special case. Brie y, consider real constants 34
�i and ki � 1 linear lters fbit g such that P kbitk < 1, i = 1, 2. The real-valued univariate series Z1t = �1 +
1
X
j =?1
b01;t?j Y 1j and Z2t = �2 +
1
X
j =?1
b02;t?j Y 2j
having maximum squared-coherency �212 (!) at each ! subject to b�i (!)fii (!)bi (!) = 1, for i = 1, 2, where bi (!) is the Fourier transform of fbit g, are given by nding the largest scalar �(!) such that, with f21 (!) = f12� (!),
f22(!)?1=2 f21 (!)f11 (!)?1 f12 (!)f22 (!)?1=2 (!) = �(!) (!): The maximum squared-coherency achieved between Z1t and Z2t is �(!), and b1 (!) and b2 (!) are taken proportional to f11 (!)?1 f12 (!)f22 (!)?1=2 (!) and f22 (!)?1=2 (!), respectively. An interpretation of the maximal squared coherency that is consistent with the notion of scaling and the spectral envelope established in Section 4 can be given. Speci cally, we may regard �(!) as a `coherency envelope' in the following sense. Let bi be complex-valued ki � 1 vectors, i = 1; 2, and consider the scaled complex-valued processes Z1t (b1 ) = b�1Y 1t and Z2t (b2 ) = b�2Y 2t having squared coherency �212 (!;bb1 ;bb2 ). If we nd b1 and b2 so that the squared coherency between Z1t (b1 ) and Z2t (b2 ) is maximized at a particular frequency ! = !0, then the maximum squared coherency at frequency !0 is �(!0 ), and the complex-valued scalings for which the maximum squared coherency is achieved are proportional to b1 (!0 ) = f11 (!0 )?1 f12 (!0 )f22 (!0 )?1=2 (!0 ), and b2 (!0 ) = f22 (!0 )?1=2 (!0 ): Thus, for any non-zero complex vectors b1 and b2 , �212 (!;bb1 ;bb2) � �(!), with equality when b1 is proportional to b1 (!) and b2 is proportional to b2 (!). The material in Section 4 focuses on the case where b1 and b2 are restricted to be real-valued, and in some cases, they are further restricted to be equal.
Acknowledgment
This research was supported, in part, by separate grants to D. Sto�er and to D. Tyler from the National Science Foundation.
References
Antognini, J. F., Buonocore, M. H., Disbrow, E. A., Carstens, E. (1998) Iso urane
anesthesia blunts cerebral responses to noxious and innocuous stimuli: A functional MRI study. Life Sciences. In press. Bina, M. (1994). Periodicity of dinucleotides in nucleosomes derived from siraian virus 40 chromatin. Journal of Molecular Biology, 235, 198-208. Bloomfield, P. (1976). Fourier Analysis of Time Series: An Introduction. New York: Wiley & Sons. Breiman, L. & Friedman, J. (1985). Estimating optimal transformations for multiple regression and correlation (with discussion). Journal of the American Statistical Association, 80, 580-619. Brillinger, D. R. (1975). Time Series: Data Analysis and Theory. 2nd ed: 1981. San Francisco: Holden-Day. 35
Brillinger, D.R. (1980). Analysis of variance problems under time series models. Handbook of
Statistics (Vol. 1), ed. P.R. Krishnaiah, Amsterdam: North Holland, pp 237-278. Brockwell, P.J. & Davis, R.A. (1991). Time Series: Theory and Methods, 2nd ed. New York: Springer. Brodatz, P. (1966). Textures: A Photographic Album for Artists and Designers. New York: Dover Publications. Chatfield, C. (1989). The Analysis of Time Series: An Introduction, 4th ed. London: Chapman & Hall. Cooley, J.W. & Tukey, J.W. (1965). An algorithm for the machine calculation of the complex Fourier series. Math. Comp., 19, 297-301.
Cornette, J.L., Cease, K.B., Margaht, H., Spouge, J.L., Berzofsky, J.A. & DeLisi, C. (1987). Hydrophobicity scales and computational techniques for detecting amphipathic
structures in proteins. Journal of Molecular Biology, 195, 659-685. Ding, Z., Granger, C.W.J., & Engle, R.F. (1993). A long memory property of stock market returns and a new model. Journal of Empirical Finance, 1, 83-106. Eisenberg, D., Weiss, R.M. & Terwillger, T.C. (1984). The hydrophobic moment detects periodicity in protein hydrophobicity. Proceedings of the National Academy of Science, 81, 140-144. Fuller, W.A. (1995). Introduction to Statistical Times Series. 2nd ed. New York: Wiley & Sons. Greenacre, M. J. (1984). Theory and Applications of Correspondence Analysis. London: Academic Press. Hannan, E. J. (1970). Multiple Time Series. New York: Wiley & Sons. Ioshikhes, I., Bolshoy, A. & Trifonov, E.N. (1992). Preferred positions of AA and TT dinucleotides in aligned nucleosomal DNA sequences. Journal of Biomolecular Structure and Dynamics, 9, 1111-1117. Li, C.-S. & Turek, J. (1996). Content-based indexing of earth observing satellite image database with fuzzy attributes. In Symposium on Electronic Imaging: Science and Technology - Storage & Retrieval for Image and Video Databases IV, Vol. 2670, pages 438 - 449. IS&T/SPIE, 1996. Liu, F. & Picard, R.W. (1996). Periodicity, directionality, and randomness: Wold features for image modeling and retrieval. IEEE Trans. Pattern Analysis and Machine Intelligence, 18, 722-733. MacNeill, I. (1977). A test of whether several time series share common periodicities. Biometrika, 64, 495-508. McDougall, A. J., Stoffer, D.S. & Tyler, D. E. (1997). Optimal transformations and the spectral envelope for real-valued time series. Journal of Statistical Planning and Inference, 57, 195-214. McLachlan, A.D. & Stewart. M. (1976). The 14-fold periodicity in alpha-tropomyosin and 36
the interaction with actin. Journal of Molecular Biology, 103, 271-298. Niblack, W., Barber, R., Equitz, W., Flickner, M., Glasman, E., Petkovic, D., Yanker, P., & Faloutsos. C. (1993). The QBIC project: Querying images by content
using color, texture, and shape. IBM RJ 9203 (81511), February 1993. Nishisato, S. (1980). Analysis of Categorical Data: Dual Scaling and its Applications. Toronto: University of Toronto Press. Ogawa, S., Lee, T.M., Nayak, A. and Glynn, P. (1990a). Oxygenation-sensitive contrast in magnetic resonance image of rodent brain at high magnetic elds. Magnetic Resonance in Medicine, 14, 68-78. Ogawa, S., Lee, T.M. (1990b). Magnetic resonance imaging of blood vessels at high elds: in vivo and in vitro measurements and image simulation. Magnetic Resonance in Medicine, 16, 9-18. Percival, D.B. & Walden, A.T. (1993). Spectral Analysis for Physical Applications: Multitaper and Conventional Univariate Techniques. Cambridge University Press. Priestley, M.B. (1981). Spectral Analysis and Time Series. Vols 1 and 2. London: Academic Press. Satchwell, S.C., Drew, H.R. & Travers, A.A. (1986). Sequence periodicities in chicken nucleosome core DNA. Journal of Molecular Biology, 191, 659-675. Shumway, R.H. (1988). Applied Statistical Time Series Analysis. Englewood Cli�s: Prentice Hall. Stoffer, D.S. (1987). Walsh-Fourier analysis of discrete-valued time series. Journal of Time Series Analysis, 8, 449-467. Stoffer, D.S., Scher, M., Richardson, G., Day, N. & Coble, P. (1988) A Walsh-Fourier Analysis of the E�ects of Moderate Maternal Alcohol Consumption on Neonatal Sleep-State Cycling. Journal of the American Statistical Association, 83, 954-963. Stoffer, D.S. & Tyler, D.E. (1998). Matching sequences: Cross-spectral analysis of categorical time series Biometrika, 85 201-213. Stoffer, D.S., Tyler, D.E. & McDougall, A.J. (1993a). Spectral analysis for categorical time series: Scaling and the spectral envelope. Biometrika, 80, 611-622. Stoffer, D.S., Tyler, D.E., McDougall, A.J.& Schachtel, G. (1993b). Spectral analysis of DNA sequences (with discussion). Bulletin of the International Statistical Institute, Bk I, pp 345-361; Discussion: Bk IV, pp 63-69, 1994. Stoffer, D.S., Shumway, R.H. & Disbrow, E.A. (1998). The spectral envelope and a multivariate analysis of fMRI signals from a study of pain perception. To appear in Statistics in the Health Sciences, an IMA Volume in Mathematics and its Applications. New York: Springer-Verlag. Tavar�e, S. & Giddings, B.W. (1989). Some statistical aspects of the primary structure of nucleotide sequences. In Mathematical Methods for DNA Sequences, M.S. Waterman ed., pp. 37
117-131, Boca Raton, Florida: CRC Press. Tiao, G. C. & Tsay, R. S. (1994). Some advances in nonlinear and adaptive modeling in time series analysis. Journal of Forecasting, 13, 109-131. Tiao, G. C., Tsay, R. S. & Wang, T. (1993). Usefulness of linear transformations in multivariate time series analysis. Technical Report, Statistics Research Center, Graduate School of Business, University of Chicago. Viari, A., Soldano, H. & Ollivier, E. (1990). A scale-independent signal processing method for sequence analysis. Computer Applications in the Biosciences, 6, 71-80. Waterman, M. S. & Vingron, M. (1994). Sequence comparison signi cance and Poisson approximation. Statistical Science, 9, 367-381.
38