managed learning environment (MLE) was used to support lectures, .... based upon a relational database and a web server that is accessed by users' browsers.
The use of managed learning environments and automated assessment for supporting large group teaching by Christian Hicks
There are many pedagogical and resource issues associated with very large group teaching. These relate to the delivery of course materials, student support and assessment. This paper describes the delivery and assessment of a course in Accounting and Finance studied by 310 students in the Faculty of Engineering at the University of Newcastle upon Tyne. Blackboard, a web-based managed learning environment (MLE) was used to support lectures, providing access to a study guide, detailed notes and case studies. The Speedwell multiple choice examination system was used for summative assessment. Introduction In the United Kingdom the engineering profession is regulated by the Engineering Council and by the professional institutions. Standards and Routes to Registration (SARTOR) is a policy statement that defines the standards of education and initial professional education required for registration with the Engineering Council1. SARTOR identifies that engineers should be aware of the financial, economic, social and environmental factors of significance to engineering and relevant legal, statutory and contractual obligations.
The Faculty of Engineering at the University of Newcastle upon Tyne offers a wide range of MEng degree programmes that satisfy the requirements of SARTOR and are accredited by the various engineering institutions. All engineering students study the module “Introduction to Business Management” which consists of two half modules “Accounting and Finance” and “Law”, which are taught and assessed separately.
The Introduction to Business Management module was the Faculty’s first experience of very large group teaching, with 310 students enrolled in 2000/2001. Teaching contact was limited to one hour per week due to timetable constraints that
1
arose from the large number of degree programmes that included the module. This paper describes the design, delivery and assessment of the accounting and finance part of the module.
Background The level of funding per student in British higher education in 2000 was 38% less than in 1989, which in turn was 20% lower than in 19762. The Quality Assurance Agency (QAA) was established in 1997 to review the quality and standards of UK higher education. The QAA imposed an accreditation regime that reviews academic standards and the quality of teaching and learning in each subject area. This has led to the publication of league tables containing statistics associated with the QAA results. Universities are therefore seeking to improve quality whilst simultaneously increasing teaching efficiency to achieve cost savings.
The Dearing Report3 makes clear the belief that computing and information technology (C&IT) presents great opportunities for improving quality, flexibility and effectiveness in higher education. There is a potential to reduce future costs but there is a requirement for investment in the short-term. This arises from the need for hardware, software and infrastructure, including networking and effective audiovisual support. These technologies offer the prospect of saving academic time in the long-term, but place greater demands in the short-term on staff already working under extreme pressure4. Very large group teaching has many similarities with distance learning approaches due to the limited amount of contact between students and staff. Computer and information technology including managed learning environments and Internet based resources have been widely applied for distance learning applications.
Pedagogical issues The student group was diverse in terms of nationality, prior experience, linguistic ability, maturity, learning styles and motivation. Current trends in teaching stress the role of the learner in acquiring new information. The teacher’s role is to provide learning materials and to guide the learner to appropriate sources of information. Learners may use information technology as a direct source of information provided by the teacher5. This view represents a shift from a teacher-centred, behavioural approach towards a student-centred humanistic approach. The objective is to provide the flexibility to support the various modes of learning used by students with different backgrounds, objectives and values6. In the context of very large group teaching, the development of a student-centred approach implied the adoption of some aspects of distance learning methodology for providing a variety of learning resources.
2
Learning materials A variety of learning materials are provided that aim to reinforce learning by using different modes of presentation and content. At the highest level a study guide describes the structure of the course and its assessment. Each topic is introduced and learning objectives, content and outcomes are identified. The use of various resources is explained and self-assessment questions are provided. Twelve Microsoft PowerPoint based lectures help pace learning and introduce other materials. At the lowest level detailed notes are provided for each topic to supplement the lectures and course texts. The production of these notes proved particularly time consuming as it was necessary to ensure that the material was approachable, complete and concise, whilst meeting the learning requirements of a very disparate group. The structure was designed to be consistent with the study guide and the lecture notes, yet the style is more formal with more detailed explanations. In addition, there are two case studies that illustrate the practical application of spreadsheets, which are commonly used for financial modelling and analysis. A tutorial sheet with worked solutions and a self-assessment test are also provided.
Feedback from students identified that they were very concerned about printing costs. A double column, newspaper style format with 8 and 10 point Times Roman fonts was used to minimise the size of documents. This approach has been well received by students.
Large group lecturing The large group size has a significant impact on delivery and imposes many constraints. Firstly, it is necessary to ensure that those at the rear of a very large lecture theatre can easily read materials. A high quality data projector and large screen were used together with carefully designed PowerPoint slides to ensure good visibility. It was found that a minimum font size of 24 points was appropriate and that figures needed to be reproduced using a graphics package (Microsoft Visio) because scanned images lacked the necessary clarity. The slides were produced in black and white to ensure a high contrast and to avoid problems for those suffering from colour blindness. A cordless microphone and sound system was also used.
The use of handout materials was found to be very disruptive. Additional materials were therefore provided using the Blackboard managed learning environment (http://www.blackboard.com). This approach, which is described in the next section, was intended to encourage self-study.
3
Managed learning environment The architecture of Blackboard is based upon a relational database and a web server that is accessed by users’ browsers. Figure 1 shows an example of the user interface that provides information on the lecturing staff. Users can navigate their way through the system using the tabs on the left hand side of the screen.
Figure 1 Blackboard user interface - staff information
When a user logs onto the system any current announcements are displayed. The Module Summary Sheet that outlines the learning objective, syllabus, assessment and timetabling information is provided under the course information section.
Online computer aided assessment can be provided using several formats: multiple choice, true/false, fill in the blank, ordering and short Answer/Essay. This facility was used to provide formative assessment on several topic areas. A tutorial sheet together with model answers was also provided as a rich text document.
4
Figure 2 shows the course documents associated with the financial accounting part of the course. There are detailed notes on each topic that are provided in rich text format (.rtf). A case study contained in a subdirectory includes a copy of an annual report in Adobe Portable Document Format (.pdf). A Microsoft Excel spreadsheet (.xls) is provided to illustrate the analysis of trends and ratios. Microsoft Internet Explorer version 5 contains all the plug-ins necessary for all these file types to be displayed directly through the browser.
Figure 2 Financial accounting content Figure 3 shows some of the external links that are provided for the accounting part of the module.
5
Figure 3 External links
Blackboard provides very helpful facilities for tracking the usage of materials by selected students or the whole group. It provides aggregated information including the total number of accesses per area, the number of accesses over time and detailed data on the use of the system by each student. 310 registered students accessed the accounting materials within the Blackboard system 30,590 times during a single semester. This indicates a high level of enthusiasm for this mode of teaching.
Multiple choice assessment The Speedwell (http://www.speedwell.co.uk) multiple choice examination software was used for setting and marking the exam. The software has two components: “Item Bank” that contains examination questions, their history and statistics; “Multiquest” that processes the student answer sheets to produce marks lists, a histogram of performance, an item analysis report and audit trails. The particular style used was single correct answer with four distracters. Students were not penalised for incorrect answers.
Multiple choice questions (MCQ) are particularly well suited to questions that involve factual information. There are several question setting strategies that were used: •
lists with an incorrect element;
6
•
a set of five sequences;
•
calculation based questions with numerical responses;
•
“case study” based questions - five cases are offered and candidates are invited to associate statements with the most appropriate case;
•
the identification of a correct/incorrect assumptions for some theory / calculation.
Figure 4 Item analysis report Figure 4 shows the item analysis report for question 5, which includes various statistics, including the answer frequency. The histogram on the right shows the percentage of each category of student that obtained a correct answer. Category 1 relates to the top 20% of students based upon overall performance, whereas category 5 is the bottom 20%. This “staircase” profile indicates that it is a good question because a large proportion of category 1 students got the question right, whereas a small proportion of category 5 students were correct. The item analysis report shows which questions were found to be easy, particularly difficult or poorly taught.
MCQ questions are particularly difficult to set and the number of potential questions for a given amount of material is limited. A core aspect of MCQ methodology is that questions should be reused. The quality of the statistical analysis improves as the sample size increases. It also allows questions to be improved over time by changing the incorrect responses known as “distracters”. Areas of difficulty can also be pinpointed which helps identify parts of the course that require improved materials or delivery. Automated MCQ provides an effective mechanism for administrative staff to mark a large volume of answer sheets very quickly, which eases the load on academics. It also helps with examination timetabling because the examination period can be extended with MCQ exams scheduled close to deadline for returning marks. However, the reuse of questions makes it necessary to have examination procedures that ensure that all question papers are returned. In practice, this has proved to be the greatest problem.
7
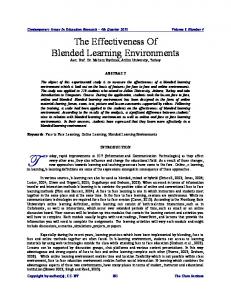
Learning outcomes Figure 5 shows a scatter plot that shows the relationship between the marks obtained by students in the Department of Mechanical, Materials and Manufacturing Engineering on the Introduction to Business Management module and their stage average. It can be seen that the progression rate was good with only one student failing the module. However, it can be seen that the students’ marks on the module tend to be better than their stage average. Business Management vs Stage Average Results (Department of Mechanical, Materials & Manufacturing Engineering) 100.0 90.0 80.0
Stage Average
70.0 60.0 50.0 40.0 30.0 20.0 10.0 0.0 0
10
20
30
40
50
60
70
80
90
100
Introdution to Business Management
Figure 5 Scatter plot of module marks vs. stage average (MMME) The style of multiple choice question used was single correct answer, with four distracters with no penalty for incorrect answers. This approach tends to inflate marks because the expected mark for random selection would be 20%. It was therefore decided to evaluate the effect of this bias. Equation 1 shows a compensation formula that takes into account the expected impact of guessing.
Adjusted mark = actual mark – expected benefit from guessing = actual mark – ((100 – actual mark) X 0.25) Equation 1 Compensation formula to offset the expected impact of guessing
The adjusted marks are compared with the stage average mark in Figure 6. It can be seen that the number of failure increased from one to seven, but there is a better correlation between the Introduction to Business Management mark and the Stage average. In fact the correlation was better than for many other modules that used traditional examination methods. This suggests that MCQ is a good method of assessment. However, the use of the compensation formula raises several issues. Firstly, it is based upon the expected impact of guessing, whereas the actual impact of guessing for
8
a particular student is a random variable. Secondly, the formula assumes that all candidates answered all questions, which may not be the case. Finally, the students were not informed in advance that a compensation formula would be used. For these reasons it was decided that it would be unfair to apply compensation retrospectively.
Business Managem ent vs Stage Average Results (Departm ent of Mechanical, Materials & Manufacturing Engineering)
100.0 90.0 80.0
Stage Average
70.0 60.0 50.0 40.0 30.0 20.0 10.0 0.0 0
20 40 60 80 100 "Corrected" Introduction to Business Managem ent Mark
120
Figure 6 Scatter plot of “corrected” module marks vs. stage average (MMME) Evaluation The module was evaluated using the University’s standard questionnaire. Table 1 compares the results with those obtained by the same lecturer with smaller group sizes. It can be seen that the feedback is very similar. This suggests that the provision of substantial learning materials through the managed learning environment, appears to have offset the negative effects of the very large group size.
9
Mean score (range 1 – 5) Group size
42
102
312
Overall Teaching
3.71
3.9
3.8
Well Prepared
4.36
4.52
4.36
Structured Notes
3.81
4.1
3.8
Lectures Understood
3.82
4.16
3.74
Module Difficulty
3.32
3.08
3.36
(1=easy, 5 = hard)
Table 1 Feedback from student questionnaires for three different modules The use of the Blackboard managed learning environment on the module was independently evaluated by the Learning Technology Support Network (http://www.ltsn.ac.uk) based at Loughborough University8. There were 114 completed questionnaires returned, a response rate of 37%. A focus group meeting provided further information. 93% of students accessed the system using University PCs. 78% of the students indicated that they could use Blackboard at a time that was convenient for them. The materials provided through Blackboard for this particular course was regarded as being of particularly high quality and very comprehensive in its scope (81% of respondents). The vast majority of students (86%) felt that access to materials in this way had helped to increase their depth of understanding of the subject matter. However, some students criticised the potential for “over-complication”. With such an extensive range of resources available through Blackboard, some students were unsure what was the most important material to revise for the examination.
Conclusions Universities in the UK have experienced significant reductions in funding per student. The Quality Assurance Agency was established in 1997 as an attempt to improve standards. This process has been encouraged through the publication of league tables. These factors have increased the emphasis on both the effectiveness and efficiency of teaching.
The large group teaching approach adopted emphasised pedagogical issues, content and technology. The structure, content and presentation of materials to suite a variety of different learning styles are particularly important issues.
10
It has been shown that large group teaching supported by a web-based managed learning environment and computer assisted assessment has provided an efficient and effective learning environment. This mode of teaching changes the nature of teaching in many ways. Significant staff time is spent preparing materials and administering their delivery. Non-contact time is not always fully recognised by management. This mode of teaching requires academics to have strong IT skills. These are possible barriers to the widespread adoption of large group teaching methods.
The use of multiple choice assessment was found to be both efficient and effective for the type of material examined. Progression rates were good and the correlation of module marks with the stage average were good, particularly when a compensation formula was used that took into account the expected effect of guessing.
References 1.
ENGINEERING COUNCIL: ‘Standards and Routes to Registration’, www.engc.org.uk (1997)
2.
UNIVERSITIES UK: ‘New directions for higher education funding: Funding Options Review Group final report’, www.universitiesuk.ac.uk/bookshop (2000)
3.
DEARING, R.: ‘Higher education in the learning society’, National Committee for Inquiry into Higher Education , www.leeds.ac.uk/educol/ncihe (1997)
4.
RAINE, J.: ‘Towards the introduction of institution wide computer assisted assessment: a service department experience’, Third Annual Computer Assisted Assessment Conference, University of Loughborough, 16th-17th June 1999.
5.
SAJENIEMI, J. and KUITTINEN, M.: ‘Three-level teaching material for computer-aided lecturing’, Computers and Education, 32, pp269-284 (1999)
6.
DICK, W. and CAREY, L.: ‘The systematic design of instruction’, Scott, Foresman And Company, US, ISBN 0-673-15122-0 (1978)
7.
CARR-CHELLMAN, A. and DUCHASTEL, P.: ‘The ideal online course’, British Journal of Educational Technology, 31(3) pp229-241 (2000)
8.
MARPLES, G.: ‘The use of Blackboard (virtual learning environment) within the Department of Mechanical, Materials and Manufacturing Engineering at the University of Newcastle upon Tyne’, Learning Technology Support Network, Loughborough University (2001)
11