... ordered from our website www.bi.no (Research - Research Publications) ... of either valueâcreating networking or valueâdestroying director overload, multiple directorships has ..... Because employees are stakeholders (Free- man and Reed ...
The value-creating board: Theory and evidence by
Øyvind Bøhren and R. Øystein Strøm
Research Report 8/2005
BI Norwegian School of Management Department of Financial Economics
Øyvind Bøhren and R. Øystein Strøm: The value-creating board: Theory and evidence ISSN 0803-2610
c
Øyvind Bøhren and R. Øystein Strøm 2005
Research Report 8/2005
BI Norwegian School of Management N-0442 Oslo Phone: 4641 0000 06600 www.bi.no
Printing: Nordberg
BI Norwegian School of Management’s research reports may be ordered from our website www.bi.no (Research - Research Publications)
Preface The Corporate Governance Program This report is part of the The Corporate Governance Program1 at the Norwegian School of Management. This research program has two overall objectives. The first is to construct a high-quality data base on a wide set of corporate governance characteristics for Norwegian firms. The second objective is to empirically explore the determinants of a firm’s corporate governance characteristics and the relationship between such governance characteristics and the firm’s behavior as an economic entity. The Corporate Governance Program, which consists of a series of individual projects, is sponsored by the Norwegian School of Management and the Research Council of Norway.
The issues analyzed in this report Existing evidence shows that concentrated ownership (i.e., investors with large equity stakes) per se destroys value in most Norwegian listed firms. However, if the large owners enter the board or the management team, the expected value creation is considerable. To illustrate, Bøhren and Ødegaard (2001b) estimate that the market value of the assets for the average firm increases by 1% (NOK 20 mill.) when the equity fraction of board members increases by one percentage unit. In such a perspective, the objective of this report is to empirically explore how the structure of the board relate to the firm’s value creation process. We examine how firm behavior relates to a wide range of externally observable board characteristics, such as the directors’ equity stakes in the firm, the board’s independence of the CEO, board size, directors’ tenure, directorships held in other 1 http://finance.bi.no/~governance
i
ii firms (network), director age heterogeneity, and gender mix. We also include control variables such as other governance mechanisms, industry type, and firm size. This project contributes to the understanding of boards in several ways. First, it is among the very few studies to include board independence, director network, employee directors, and gender as joint determinants of board behavior. Second, the richness of the data set allows for a test design which captures both the interactions between many different characteristics, their behavior over time, and a possible reverse causation between board characteristics and firm performance. Third, whereas almost all existing studies are from the US, our European setting reflects a quite different institutional environment. Therefore, compared to earlier research on this issue (see Bhagat and Black (1999) and Hermalin and Weisbach (2003) for surveys), our study is more comprehensive and quite different. The innovative features of our study stem primarily from the analysis of board independence, director networks, and board heterogeneity. For example, the standard measure of board independence is the fraction of directors who are not employed by, or otherwise affiliated with, the firm (Byrd and Hickman, 1992). However, this anglo-saxon inside/outside director dimension is irrelevant for Norway, where there is never more than one officer on the board (the CEO). In addition, the empirical success of the outside/inside variable in extant studies is quite mixed. We try to overcome these problems by constructing a measure for board independence which reflect the tenure of the person to be monitored (the CEO) relative to the tenure of the monitors (the directors). This proxy is is the average number of years since the board members were elected minus the number of years since the CEO was appointed. The larger the difference, the higher the board’s independence of the CEO. Earlier research has analyzed the effect on CEO compensation of interlocking boards, i.e., officers who sit on several boards in general and on each others’ boards in particular (Hallock, 1997). However, if one thinks of interlocking boards as a sign of either value–creating networking or value–destroying director overload, multiple directorships has potentially a broader impact on performance than through CEO compensation alone. Since we know the identity of every director and every CEO in every sample firm, we can establish such network and overload proxies and explore their role in value creation. The relationship between gender and board behavior has hardly been analyzed empirically. Moreover, political moves are currently made to ensure by law that larger Norwegian firms assign women to at least 40% of the board seats. Both
iii factors make it particularly interesting to include gender on top of age dispersion and the use of employee directors in a study of board diversity.
Our findings Using a sample of all non-financial listed Norwegian firms over the period 19892002, we explore empirically how board composition influences the conflict of interest between agents and principals, the production of information for monitoring and support, and the board’s effectiveness as a decision-maker. We find that potential agency costs are high because the typical firm’s ownership structure produces low incentives to monitor the management team. Boards are small, gender diversity is low, less than half the firms have employee directors, and most CEOs are neither directors in their firm nor elsewhere. Using a wide set of such board design mechanisms and new measures of board independence and director networking, static fixed effects panel data models show that value-creating boards are aligned with the shareholders and dependent on the CEO. Multiple directorships create valuable information networks, but diversity in terms of gender, board size, and employee directors reduces the board’s decisiveness. Dynamic panel data models accounting for endogeneity between the board design mechanisms and reverse causation between the mechanisms and performance support these findings. These results suggest that designers of value-creating boards should encourage insider stock ownership, ensure the CEO is a board member even if it reduces independence, hire directors with professional business competence rather than arms-length monitoring capacity, recognize the network value of directors with multiple seats rather than worry about potential overstretching, and construct boards that are homogeneous rather than diverse. Some of these conclusions are politically incorrect, run counter to recent recommendations in corporate governance codes, and pull board design into opposite directions than those implied by conventional wisdom. We think this reflects a situation where practical board design has been shaped by practitioners and regulators based on their limited personal experience, political agendas, and recently also by their concern with scandal prevention rather than firm value maximization. Our findings support the claim that much more academic research is needed in order to ensure a well-founded economic rationale for the regulation of board design.
iv
Acknowledgements We have benefited from comments by Paul Guest, Richard Priestley, Bernt Arne Ødegaard, and participants in the 6th International Workshop on Corporate Governance and Investment in Palma, Mallorca (February 2005). Bernt Arne Ødegaard has also guided us in the data collection. Financial support from the Research Council of Norway (grant no. 154949/510) is gratefully acknowledged. Keywords: Corporate governance, Board composition, Panel data methods, Endogeneity, Reverse causation JEL classification codes: G32, G34
Contents 1 Introduction
1
2 Theory, evidence, and methodology
5
2.1
Interest alignment . . . . . . . . . . . . . . . . . . . . . . . . . . .
2.2
Information provision . . . . . . . . . . . . . . . . . . . . . . . . .
8
2.3
Decisiveness . . . . . . . . . . . . . . . . . . . . . . . . . . . . . . .
10
2.4
Reverse causation and endogeneity . . . . . . . . . . . . . . . . . .
12
3 Descriptive statistics
6
14
3.1
Institutional setting and sample selection . . . . . . . . . . . . . .
14
3.2
Interest alignment . . . . . . . . . . . . . . . . . . . . . . . . . . .
17
3.3
Information provision . . . . . . . . . . . . . . . . . . . . . . . . .
18
3.4
Decisiveness . . . . . . . . . . . . . . . . . . . . . . . . . . . . . . .
21
3.5
Performance . . . . . . . . . . . . . . . . . . . . . . . . . . . . . . .
23
3.6
Comovement among the board design mechanisms . . . . . . . . .
27
3.7
Summary . . . . . . . . . . . . . . . . . . . . . . . . . . . . . . . .
29
4 Statistical tests
30
4.1
The basic model . . . . . . . . . . . . . . . . . . . . . . . . . . . .
30
4.2
Static fixed effects estimation . . . . . . . . . . . . . . . . . . . . .
33
4.3
Endogeneity and reverse causation . . . . . . . . . . . . . . . . . .
37
4.4
The dynamic model . . . . . . . . . . . . . . . . . . . . . . . . . .
39
4.5
Summary . . . . . . . . . . . . . . . . . . . . . . . . . . . . . . . .
41
5 Robustness
42
5.1
A differenced model . . . . . . . . . . . . . . . . . . . . . . . . . .
42
5.2
Empirical proxies . . . . . . . . . . . . . . . . . . . . . . . . . . . .
45
i
ii
CONTENTS 5.3 5.4
The pooled sample . . . . . . . . . . . . . . . . . . . . . . . . . . . Summary . . . . . . . . . . . . . . . . . . . . . . . . . . . . . . . .
49 51
6 Summary and conclusions
53
A Definitions
56
Bibliography
58
List of Tables 3.1
Summary statistics for board design mechanisms in all non-financial firms listed on the Oslo Stock Exchange 1989-2002 . . . . . . . . .
16
3.2
The relative frequency of equity ownership by firm insiders . . . .
17
3.3
The CEO’s inside and outside directorships . . . . . . . . . . . . .
19
3.4
The average fraction of female directors by board size . . . . . . .
22
3.5
The average fraction of female directors per year . . . . . . . . . .
23
3.6
The relative frequency of employee directors by year and number .
24
3.7
Board characteristics across performance deciles . . . . . . . . . . .
25
3.8
Bivariate correlations between variables used in the regression models 28
4.1
Firm performance explained by board design mechanisms, using GLS to estimate seven fixed effects models. . . . . . . . . . . . . .
4.2
Firm performance explained by board design mechanisms, using GMM to estimate seven fixed effects models. . . . . . . . . . . . .
4.3
35
Reverse causation and endogenous board design mechanisms estimated in separate GMM regressions of four fixed effects models. The instruments correspond to those used in table 4.2. . . . . . . .
4.4
34
38
Dynamic relationships between performance, board design mechanisms and lagged performance, using GMM to estimate seven fixed effects models. The estimation uses lagged performance and the instruments from table 4.2. . . . . . . . . . . . . . . . . . . . . . . iii
40
iv
LIST OF TABLES 5.1
Dynamic relationships between firm performance and board design mechanisms estimated in a modified Arellano and Bond (1991) approach and GMM. Instruments are squared, differenced explanatory variables, including the lagged, differenced Tobin’s Q. Each regression uses only instruments belonging to the same class of explanatory variables. . . . . . . . . . . . . . . . . . . . . . . . . . . .
5.2
44
The fixed effects model estimated with GMM under alternative empirical proxies for board independence and director network. The regressions use the same instrument set as in table 4.2, but with
5.3
new variable definitions. . . . . . . . . . . . . . . . . . . . . . . . . The fixed effects model and GMM estimation under alternative op-
46
erationalizations of independence, board size, and gender. The instrument set is as in table 4.2, except for new variable definitions.
48
5.4
Firm performance explained by board design mechanisms, using the pooled sample and OLS estimation. . . . . . . . . . . . . . . . . . .
50
5.5
Individual effects and time effects in the error term in an OLS regression of model (4.1) under the pooled sample. . . . . . . . . . .
51
A.1 Definition of variables used in the empirical analysis . . . . . . . .
56
Chapter 1
Introduction How should regulators and shareholders design the board of directors in a way that fosters value creation? According to theory and existing evidence, the three major concerns in board design are to align the interests of principals and agents (Jensen and Meckling, 1976), provide information for the board’s monitoring and support functions (Fama, 1980), and to enhance its decisiveness, i.e., the decisionmaking efficiency (Fama and Jensen, 1983). This report addresses this question empirically by analyzing how firm performance relates to a wide set of board design mechanisms, such as director equity ownership in the firm, board independence, director network, age and gender heterogeneity within the board, board size, and the use of employee directors. Earlier research has focused on just one or a few of these mechanisms, such as insider ownership (Mørck et al., 1988; McConnell and Servaes, 1990), board independence (Baysinger and Butler, 1985; Hermalin and Weisbach, 1991), director networks (Mizruchi and Stearns, 1988; Hallock, 1997), and board size (Yermack, 1996; Eisenberg et al., 1998). However, boards have multiple tasks, such as hiring and firing the CEO, monitoring the firm’s investment and financing projects, and setting the corporate strategy. This multidimensional task may not be successfully solved with just one board mechanism, such as insider ownership alone or the director network alone. Moreover, since board mechanisms may be internally related, the value-creation effect of any one of them cannot be validly analyzed without simultaneously accounting for the others. For instance, if monitoring by the owners is a substitute for the CEO’s incentive to maximize firm value, information for monitoring purposes may be more valuable the smaller the CEO’s 1
2
CHAPTER 1. INTRODUCTION
equity stake in the firm (Rediker and Seth, 1995; Agrawal and Knoeber, 1996). We use an empirical approach which explicitly recognizes this multidimensional nature of board design. This is our first contribution to the research on valuecreating boards. Our second contribution is to introduce new empirical proxies for board independence and director network. Important parts of the board literature (Byrd and Hickman, 1992; Hermalin and Weisbach, 1991) and most national corporate governance codes (www.ecgi.org/codes) classify directors as dependent if they are affiliated, i.e., if they have past or present business or family relations to the firm. A possible reason why this measure has produced inconclusive evidence on the relationship between board independence and firm performance is that the proxy is theoretically ad–hoc. According to Hermalin and Weisbach (1998), which is the first rigidly developed theoretical model in this field, what matters for director independence is not affiliation. Rather, the key is the relative timing of entry, i.e., whether the director was appointed before or after the current CEO took office. Our new independence proxy reflects this characteristic. Similarly, existing literature measures director network simply by the number of board seats held in other firms (Shivdasani, 1993; Kiel and Nicholson, 2003). In contrast, our network proxy tries to pick up the separate insight gained from each individual seat by estimating its unique information centrality in the overall corporate landscape. The richness of the data set and special features of the institutional setting drive our third contribution. We observe every non-financial firm listed on the Oslo Stock Exchange (OSE) from 1989 to 2002. This time series, which is unusually long by international standards, allows us to study board dynamics over extensive periods. For example, Bhagat and Black (2002) classify board independence in their sample firms based on one single year, while performance is measured six years before and four years after. Also, our ownership structure data are unusually detailed, accounting for every equity holding of every owner in every firm at every year-end over fourteen years. Our sample firms are exposed to two board design regulations which are uncommon internationally. Norwegian corporate law rules that the CEO cannot be the chairman. Although not by law, it is also an empirical fact that other members of the management team are never directors in their firm, and the CEO is not on the board in roughly two thirds of the cases. Thus, in contrast to the US, regulation and a voluntary restriction on board composition jointly reduce the tendency to use the firm’s officers as the firm’s directors. The second unusual regulation is that
3 when a listed firm employs more than 200 people, the employees have the right to elect one third of the directors. Since roughly 40% our sample firms have employee directors, the cross-sectional variation of this board design mechanism allows us to analyze the performance effect of employee directors, which is quite unexplored in the literature (Becht et al., 2002). As our sample includes repeated observations of the same firm over time, we use panel data methods to separate the performance impact due to the firm only from that of general factors influencing every firm. The unobserved firm heterogeneity is controlled for in a fixed effects model, using the generalized least squares (GLS) and the general method of moments (GMM) as estimation methods. GMM panel data methods also allow us to analyze potential board mechanism endogeneity and reverse causation between mechanisms and performance (Hermalin and Weisbach, 2003) in a novel way. Mechanism endogeneity occurs when one board design mechanism is determined by other design mechanisms, whereas reverse causation happens when performance drives board composition and not just the other way around. Because the underlying structural relationship between the variables is unknown, this setting is intractable with the simultaneous equations methodology, which has been used earlier in similar settings (Agrawal and Knoeber, 1996). In particular, because the instruments have no proper theoretical rationale, the findings from such models may be misleading. In contrast, we estimate each equation separately, using a wide set of instruments constructed from conditional moments of the data’s panel structure. Additionally, reverse causation is further analyzed in dynamic versions of the models. Our findings show that potential agency costs in our sample firms are high, as both outside and inside ownership concentration is low. Also, these two mechanisms for aligning the interests of owners and managers are complements rather than substitutes. The board’s average independence is medium in the Hermalin and Weisbach (1998) sense, as the CEO and the average director are appointed at roughly the same point in time. The CEO is a director in the firm he manages in approximately one third of the cases, and those who are also sit more often on other boards. Our information centrality measure shows that boards differ substantially in how their directors’ outside board memberships generate access to valuable information from other boards. As for board heterogeneity, most boards are unusually small and gender diversity is low. In contrast, large director age differences and the use of employee directors both contribute to high diversity. Average director age per board varies
4
CHAPTER 1. INTRODUCTION
by almost fifty years across the sample, and less than half the firms have employee directors. Over time, the CEO is gradually less often a director, female directors become considerably more common, and the use of employee directors is declining. Our regression models show that value creation is significantly higher when ownership concentration is high, directors are dependent of the CEO, the CEO is a director on his own board but not elsewhere, outside CEOs are absent, nonCEO directors hold outside directorships, boards are small, gender diversity is low, age diversity is high, and when the board has no employee directors. These results are robust to alternative specifications of the panel data models and to different operationalizations of the theoretical variables. They are not invalidated by mechanism endogeneity and reverse causation. The results are both different and less reliable when we ignore the panel data structure and use OLS regressions on the pooled sample. These findings suggest that value-creating boards have directors who are dependent on the CEO. Moreover, multiple directorships seem to produce information networks whose value more than offsets the potential cost of having overstretched directors. Increased diversity in terms of more female directors, larger board size, and more employee directors are value-reducing board design mechanisms, probably because they reduce the board’s effectiveness as a decision-maker. These results run counter to conventional wisdom and most corporate governance codes, but are reasonably consistent with theoretical arguments and the limited empirical evidence from other studies. The rest of the report is organized as follows. Chapter 2 reviews the literature and explains where our methodology deviates from that used by others. Section 3 describes the institutional framework, explains the data selection procedure, and presents the descriptive statistics. We formally test the relationship between board design mechanisms and economic performance in chapter 4, whereas chapter 5 provides robustness checks. Chapter 6 summarizes and concludes.
Chapter 2
Theory, evidence, and methodology In their recent survey of corporate governance research, Becht et al. (2002) conclude that the theory of board design is grossly underdeveloped: ”. . . formal analysis of the role of boards of directors and how they should be regulated is almost non-existent. . . . In sum, the formal literature on boards is surprisingly thin given the importance of the board of directors in policy debates. This literature mainly highlights the complexity of the issues. There is also surprisingly little common ground between the models.” These characteristics of a young, immature paradigm produce challenges for empirical research. Although the board design problem is multidimensional by nature, each existing theory is partial and addresses one or a few board design mechanisms. This means we cannot use theory to predict what the full set of value-creating board mechanisms looks like in equilibrium. Neither can we specify the expected internal relationship between key mechanisms. For instance, theories of interest alignment (Jensen and Meckling, 1976) ignore potential links to decisiveness (Gjølberg and Nordhaug, 1996) and vice versa. Consequently, we cannot validly predict whether insider equity holdings and board size are substitute, complementary or independent mechanisms. The only feasible way to go is to specify expected performance effects of each individual mechanism from each partial theory. Therefore, we regard the estimated relationship between the mechanisms and how they jointly drive performance as observed empirical regularities rather than tests of well-founded hypotheses. 5
6
CHAPTER 2. THEORY, EVIDENCE, AND METHODOLOGY
In the following, we motivate our focus and methodology by reviewing the existing literature. We organize the discussion around the three major concerns underlying the choice of any specific board design mechanism, which are to align the interests of principals and agents (section 2.1), provide information for monitoring and support (section 2.2), and to enhance the board’s efficiency as a decision-maker (section 2.3).
2.1
Interest alignment
Interest alignment in a board context concerns the firm’s ownership structure and the degree of independence between the monitoring directors and the monitored officers. The theory of corporate governance argues that outside and inside ownership concentration matter for interest alignment because they influence the principal’s incentives and power to monitor the agent (Shleifer and Vishny, 1986; Mørck et al., 1988). Both effects are stronger the higher the ownership concentration, and inside ownership concentration (equity holdings by officers and directors) is more powerful than outside because inside owners are better informed and have direct access to the firm’s decision-making process. However, because powerful insiders may entrench themselves and exploit their outside co-owners, the expected relationship between inside ownership concentration and market value is positive in the beginning and declining thereafter. The empirical evidence on the relationship between outside concentration and firm performance is mixed and inconclusive (Gugler, 2001). The prediction on inside concentration, which is what matters for board design, has received consistent support by studies that ignore other board design mechanisms than insider ownership (Mørck et al., 1988; McConnell and Servaes, 1990; Gugler, 2001). In contrast, the board literature reports mixed results for the alignment effect of insider ownership, both when proxying by the aggregate equity held by the firm’s directors and by the CEO’s holdings alone. Hermalin and Weisbach (1991); Byrd and Hickman (1992); Yermack (1996); Cotter et al. (1997) and Bhagat and Black (2002) all find a positive relationship, but it is only significant in Hermalin and Weisbach (1991) and Yermack (1996). Thus, adding more mechanisms to a board design model than just ownership structure may easily blur the mostly clean empirical relationship between insider ownership and firm performance found in simpler models. Our comprehensive model allows us to study this issue more closely.
2.1. INTEREST ALIGNMENT
7
We measure outside ownership concentration by the Herfindahl index based on all outside owners.1 Insider ownership is proxied for by the directors’ aggregate equity holdings in the firm. The board literature and existing corporate governance codes argue that monitoring quality is higher the stronger the independence between the firm’s directors and the management team. Such independence generally reflects the directors’ ability to closely monitor the firm without being biased by pressure from the CEO. Arguing that this involves more than just the distinction between outside and inside directors, Byrd and Hickman (1992) introduce a finer partition by distinguishing between inside, affiliated outside, and independent outside directors. Only the latter type has no past or present business or family ties to the firm. The empirical evidence on the relationship between such independence measures and firm performance is inconclusive. Baysinger and Butler (1985) found a ten-year lagged positive effect, but such a lag seems unrealistically long. Hermalin and Weisbach (1991) found no significant link, while Yermack (1996), Agrawal and Knoeber (1996), Klein (1998), Bhagat and Black (1999), and Bhagat and Black (2002) all find a negative, significant relationship. After having surveyed the evidence, Hermalin and Weisbach (2003) conclude that the empirical literature cannot justify a positive relationship between board independence and firm performance. One possible reason for the low consistency between these studies is the missing theoretical justification for their affiliation-based independence measure. A quite different definition of independence is implied by the Hermalin and Weisbach (1998) model. Here, board independence is driven by firm performance, and the CEO’s ability to recruit dependent directors is better the stronger the firm’s past performance. The model predicts that the longer the history of good performance under the current CEO, the less independent the current directors. Thus, the key independence criterion is not affiliation, but whether the director was appointed before or after the CEO took office. The second reason to drop the conventional independence definition is our institutional framework. The CEO of our sample firms is also a director in just one third of the cases. Also, he cannot be the chairman by law, and other members of the management team are never on the board. This means that although most 1 The Herfindahl index for outside ownership concentration is the sum of squared ownership fractions across all the firm’s outside owners. Its maximum value is one (a single investor owns every share held by the outsiders), approaching its minimum value of zero as the ownership structure gets increasingly diffuse.
8
CHAPTER 2. THEORY, EVIDENCE, AND METHODOLOGY
directors in our sample are independent in the Byrd-Hickman sense, they may be dependent according to the Hermalin and Weisbach (1998) criterion. This idea is not new. CEO tenure has been used as an independence proxy in the strategic management literature (Finkelstein and Hambrick, 1989). Although not based on an underlying theoretical model, Westphal and Fredrickson (2001) did in fact use the fraction of directors appointed after the CEO took office as one of several measures of board independence. Thus, consistent with the HermalinWeisbach model and following the Westphal and Fredrickson (2001) logic, we measure a board’s independence as the difference between the average tenure of the non-CEO directors and the tenure of the CEO: m
Independence ≡
1X non-CEO director tenurei − CEO Tenure n i=1
(2.1)
where non-CEO director tenurei is the number of years since non-CEO director i took office, and m is the number of directors elected by shareholders. The average director has longer (shorter) tenure than the CEO when expression (2.1) is positive (negative). According to Hermalin and Weisbach (1998), the board is more independent the higher the value of (2.1). Unlike Hermalin and Weisbach (1998), Carter and Lorsch (2004) argue that board independence is driven by the director’s absolute rather than relative tenure, and that independence decreases rather than increases as tenure grows. This happens because directors become emotionally more attached to the firm and its management the longer they stay.2 Under this logic, a higher value of (2.1) means less independence rather than more. However, since (2.1) also reflects the tenure of the CEO, which is irrelevant under the Carter-Lorsch hypothesis, we also use board tenure, CEO tenure, and chair tenure as separate proxies in the robustness tests of section 5.
2.2
Information provision
The quality of the board’s monitoring and support functions depends on the quality of the directors’ information used. Internal information sources influenced by 2 ”Long service helps a director to understand the company better, but emotional attachment means she can’t be truly independent. She identifies with the company, its management, and her fellow directors. She is certainly aligned with management, with the broader interests of the company, and its success, but may find it difficult to be truly independent in deciding what’s in the shareholders’ best interests.” (Carter and Lorsch, 2004, p. 49).
2.2. INFORMATION PROVISION
9
board design are CEO directorship and employee directors. External sources are the CEO’s directorships in other firms (which we call exported CEO director), another firm’s CEO on our firm’s board (imported CEO director), and non-CEO directors holding board seats in other firms (director network). Agency theory suggests the CEO should not be on a board which is supposed to monitor him. In contrast, Carter and Lorsch (2004) posit that since the CEO has superior information about the firm and its environment, he should be a fully voting member. As this happens in about every third of our sample firms, we can explore the validity of these competing predictions. While the CEO-chairman duality has been studied in many papers, the use/non-use of a CEO director has not been analyzed in the literature so far.3 Similarly, whereas the agency logic suggests that the CEO should pay full attention to his firm, the information perspective would argue that the firm may benefit from the information gained when the CEO is on other firms’ boards. We use the exported CEO director variable to capture this design characteristic. Perry and Peyer (2005) show that in firms with high agency costs, the announcement of a new outside directorship for the CEO causes a negative share price reaction. Correspondingly, a CEO from another firm on our board (imported CEO director) may contribute little if he is already overstretched as a busy CEO. Also, Gilson and Kraakman (1991) argue that imported CEO directors are bad monitors because they have the same role in the principal-agent setting as the CEO they are supposed to monitor. Again, the counterargument is the information idea that the imported CEO director brings new perspectives and makes all directors better informed. The net impact of these alignment and information effects can only be determined empirically. Just like the CEO, non-CEO directors with multiple directorships may bring back information, but may also become uncommitted and overstretched monitors (Ferris et al., 2003). Fama (1980) argues that the average number of outside directorships held by the firm’s directors proxies for the market value of the board’s monitoring quality. This measure, which is predominant in finance-based board research and used in papers such as Byrd and Hickman (1992), Cotter et al. (1997), Shivdasani (1993), and Perry and Peyer (2005), is simple, but problematic. Although the information benefit may be positively related to the number of directorships, the measure is noisy because it ignores the uniqueness of each seat. For 3 Because both alignment and information issues are involved, the CEO director mechanism may be classified under either the alignment or the information heading. Although we choose the latter, there is no implicit assumption about relative importance.
10
CHAPTER 2. THEORY, EVIDENCE, AND METHODOLOGY
the same reason, the proxy does not distinguish between n director links to one other firm and one link per firm to n different firms. Finally, it only captures direct links, neglecting the indirect links created when a director from our firm is on another firm’s board with someone who holds a seat in still another firm. In order to avoid these problems, we apply the information centrality concept from social network analysis, which is based on graph theory (Wasserman and Faust, 1994).4 The information centrality measure captures the firm’s direct and indirect links to other firms that are established when our firm’s directors meet other firms’ directors. It treats each seat individually, and it does not double count. The centrality score increases with the number of direct and indirect paths from our firm to other firms, and it is higher the shorter the path.5 The higher the centrality score, the stronger the information effect of the directors’ network. We will illustrate the the information centrality measure in chapter 3.
2.3
Decisiveness
Given the board design mechanisms used to align conflicting interests (section 2.1) and generate information (section 2.2), the third set of mechanisms is supposed to improve the board’s effectiveness as a decision-making unit. The mechanisms we explore are board size, director gender, director age, and the use of employee directors. 4 The use of multiple directorships in social network analysis has a long tradition in sociology and strategy (Pfeffer, 1972; Dalton et al., 1998, 1999; Kiel and Nicholson, 2003). 5 Network theory employs concepts such as nodes and lines. In our setting, a node is a firm, and a line between two firms represents a joint director in the two firms. We define geodesic gjk as the shortest path between two nodes j and k, and G as the total number of nodes. The node (here: firm) i is designated as ni . Using Wasserman and Faust (1994, p. 192-197), the Information centrality measure is constructed in the following way: Form the G × G matrix A with diagonal elements aii = (1 + sum of values for all lines incident to ni ) and off-diagonal elements aij , where ( 0 if nodes ni and nj are not adjacent aij = 1 − xij if nodes ni and nj are adjacent
xij is the value of the tie from firm ni to firm nj , that is, 0 or 1. The inverse of A, C = A−1 , has PG PG elements {cij }, where we define T = i=1 cii and R = j=1 cij . The information centrality index for firm ni is: Ci (ni ) =
1 cii + (T − 2R)/G
The index measures the information content in the paths that originate and end at a specific firm.
2.3. DECISIVENESS
11
Yermack (1996) and Eisenberg et al. (1998) show empirically that performance decreases with increasing board size. This finding is consistent with the theoretical model of Gjølberg and Nordhaug (1996), who show that increased board size is potentially valuable only if new members bring new insights and new information. This is because larger boards take longer time to decide and make more conventional decisions than smaller boards. Thus, performance suffers in their model because increased board size means less creativity and less decisiveness. Increased board size may also produce more diversity, which according to Cadbury (2002) is a valuable board characteristic. Public choice theory (Buchanan and Tullock, 1962; Mueller, 2003) suggests there is a tradeoff here, as the negative effect of longer decision time and stronger pressure on consensus may be offset by the positive impact of a wider opportunity set.6 Thus, the issue is not just whether board size grows per se, but whether it does with new directors who differ sufficiently from the existing ones. Gender and age are potential ways to create such diversity. The empirical evidence on how performance correlates with gender and age is scant and conflicting. Welbourne (1999) finds that the higher the fraction of women in the management team, the higher the firm’s short- and long–term performance after the IPO. Shrader et al. (1997) document a negative relationship between female directors and firm performance, whereas Carter et al. (2003) and Smith et al. (2005) find the opposite. As far as we know, age has not been studied in this setting. We will use the fraction of female directors and the variance of the directors’ age to proxy for gender diversity and age diversity, respectively. The presence of employee directors is potentially a mechanism for both alignment, information, and decisiveness. Because employees are stakeholders (Freeman and Reed, 1983) with contractual claims on the firm’s cash flow, the hold-up problem suggests that shared control with employees who invest in firm-specific human capital may benefit owners (Becht et al., 2002). However, Williamson (1996) argues that since employees have a contractual claim, they should not have a residual claim as well. Because employees will defend their sunk human capital investments, they may oppose restructurings which threaten their position. This is the alignment dimension of employee directorships. 6 In the public choice literature, committee size determines the decision time costs and the so called external costs. Increased committee size increases decision time costs and reduces external costs, which are costs that the committee imposes on others. In a board setting, proponents of large boards argue that such external costs can be reduced by increased board size, for instance, by including stakeholders such as lenders and employees.
12
CHAPTER 2. THEORY, EVIDENCE, AND METHODOLOGY
Noe and Rebello (1997) and Raheja (2005) argue that outside directors are better monitors when firm-internal information comes through several channels and not only from the CEO. Thus, employee directors supplement the CEO as a firm-internal information source. Decisiveness is the third dimension of employee directorships. Because of the potential conflict of interest between owners and employees, decision complexity will increase and the board will be a less effective decision maker according to the Gjølberg and Nordhaug (1996) logic. This is the major reason why Cadbury (2002) thinks boards should be unitary. FitzRoy and Kraft (1993) and Schmid and Seger (1998) show that employee directors have a negative effect on owners’ wealth in German firms. Similarly, recent evidence from Canada shows that the overall effect of employee directors is negative from the owners’ point of view. In particular, Falaye et al. (2004) find that firms where employees hold director positions due to their large shareholdings in their company spend less on new assets, take fewer risks, grow more slowly, create less new jobs, deviate more from value maximization, have more serious cash flow problems, and are less productive. Employees in Norwegian firms with more than 200 people have the right to elect one third of the directors. Because many listed firms are either smaller or exempted from this rule, only 41% of our sample firms have employee directors. We measure employee participation by the fraction of the firm’s directors employed by the firm.
2.4
Reverse causation and endogeneity
By reverse causation we mean that the firm’s performance drives its board design mechanisms. This happens in the Hermalin and Weisbach (1998) model, where the board becomes less independent the better the firm performs. Raheja (2005) recently extended this logic to board size, arguing that the reverse causation is driven by the independent directors’ need to evaluate the information provided by the CEO. With an increased demand for balanced information after a period of declining performance, the board is enlarged with inside directors, who provide a new source of firm-internal information. In contrast Palia (2001) posits that insider ownership increases when performance improves, as options and other equity-related compensation instruments are more often exercised when firms do well.
2.4. REVERSE CAUSATION AND ENDOGENEITY
13
We use the term endogeneity to characterize the situation where the board design mechanisms are internally related, driven by a set of exogenous variables. An early example in corporate governance research is Demsetz and Lehn (1985), who argue that when value-maximizing owners can freely choose their firm’s governance mechanisms, equilibrium occurs when each mechanism’s marginal performance impact is identical across all mechanisms. This implies that the governance mechanisms are internally related, being either substitutes or complements in a valuation sense. The optimal set of governance mechanisms depends upon exogenous factors which are not driven by the firm’s governance mechanisms, such as the firm’s industry, its operational risk, and the stage of the business cycle. This is also the logic followed by Raheja (2005) when relating governance mechanisms to governance-exogenous characteristics. Thus, the Hermalin and Weisbach (1998) model predicts that increased (decreased) performance decreases (increases) independence, while the Raheja (2005) model predicts the opposite, positive relationship. In addition, the Raheja (2005) model implies that this reverse causation between performance and independence also produces mechanism endogeneity between size and independence. The two will be negatively related, as large boards are less independent than small boards. We explore reverse causation and endogeneity by focusing on the directors’ equity ownership, board independence, and board size. We also include the information network variable because it turns out to be an important driver of performance. Since the exact theoretical relationships between the variables is unknown , we do not construct a system of simultaneous equations. Instead, we argue in section 4.3 that this situation is better analyzed with single-equation estimation and GMM.
Chapter 3
Descriptive statistics 3.1
Institutional setting and sample selection
The Oslo Stock Exchange (OSE) had an aggregate market capitalization of 68 bill. USD equivalents by year-end 2002, ranking the OSE sixteenth among the twenty–two European stock exchanges for which comparable data is available. During our sample period from 1989 to 2002, the number of firms listed increased from 129 to 203, market capitalization grew by 8% per annum, and market liquidity, measured as transaction value over market value, increased from 52% in 1989 to 72% in 2002.1 Norwegian firms have a less concentrated ownership structure than any other European country except the UK. For example, the average largest owner holds close to 50% of voting equity in a continental-European listed firm, 30% in Norway, and 15% in the UK. The corresponding US figure is 3% (Barca and Becht, 2001; Bøhren and Ødegaard, 2001a). Norway has a civil law regime, which is generally considered less investor–protective than common law. Nevertheless, La Porta et al. (2000) find that Norway’s regulatory environment provides better protection of shareholder rights than the average common law country. According to their theory of institutionally determined ownership structures, the strong investor protection is a major reason why Norway’s ownership concentration is so low. A Norwegian firm may and may not have a two-tiered board. The major function of the supervisory board is to elect the members of the regular board and rubber–stamp its decisions. Firms with more than 200 employees must have a 1 Sources:
http://www.ose.no and http://www.fibv.com.
14
3.1. INSTITUTIONAL SETTING AND SAMPLE SELECTION
15
supervisory board, although a majority vote among the employees may replace the supervisory board by an extra employee director seat in the regular board. If both owners and employees agree, also smaller firms can choose to have a supervisory board. Moreover, firms in the newspaper, shipping, petroleum extraction, and financial industries are exempted from the supervisory board system. However, some of these may have negotiated solutions with their local union. The law on employee directors was passed in 1973 and was written into the constitution seven years later (Aarbakke et al., 1999). If the firm employs more than 200 people, one third of the directors must be elected by and from the employees. In firms employing less than 201, labor representation presupposes majority vote among the employees. They may elect up to one third and at least two directors if the firm employs between 51 and 200. Labor may also elect one director in firms with more than 30 and less than 51 employees. Overall, this system implies that many firms have no labor representation on the board. Among the firms that do, the fraction of employee directors will vary considerably. Our sample is all non-financial firms listed on the OSE at year-end at least once over the period 1989 to 2002. To reduce censoring bias in the tenure measures, we start collecting board data in 1986. Ownership structure data, which covers every equity holding by every investor in every sample firm at year-end, was provided by the public securities register (Verdipapirsentralen). Accounting and share price data is from the OSE’s data provider (Oslo Børs Informasjon), and board data was collected manually from Kierulf ’s H˚ andbok and a public electronic register (Brønnøysundregistrene). Since 1988, every sample firm must report every director’s name, birth date and board position to this register.2 Table 3.1, which is organized according to the three major concerns in board design (interest alignment, information provision, and decisiveness), summarizes key properties of the frequency distributions for each board design mechanism. Table A.1 in the appendix defines the variables used. We will use table 3.1 as a point of reference throughout this section. We start out with summary statistics for a specific board mechanism in table 3.1, continue to a new table which provides more details, and then return to table 3.1 to consider a new mechanism. 2 We faced two problems with the board data. First, the two data sources did not always match. When in doubt, Kierulfs H˚ andbok was used for 1986–1992, and the electronic register thereafter. This is because the electronic register lacked some precision in the first period. Second, because employee directorships were not always properly recorded in either Kierulfs H˚ andbok or Brønnøysundregistrene, we checked both when the two deviated. When information was incomplete in a given year, we compared the information on the firm’s employee directors in the preceding and the subsequent year.
16
CHAPTER 3. DESCRIPTIVE STATISTICS
Table 3.1 Summary statistics for board design mechanisms in all non-financial firms listed on the Oslo Stock Exchange 1989-2002 Variable Alignment Insider ownership Directors’ holdings CEO holdings Herfindahl index Three largest owners Largest outside owner Independence Board tenure CEO tenure Chair tenure Information CEO director dummy Exported CEO Imported CEO Outside directorships Network Decisiveness Size Size1 Gender Gender1 Gender2 Gender3 Gender4 CEO age Board age Board age dispersion Employee directors Fraction employee directors Controls Firm size Risk Performance Q
Mean Stdev Median
Min
Max
N
0.074 0.064 0.036 0.176 0.498 0.293 -0.301 1.886 2.161 1.874
0.194 0.190 0.140 0.201 0.220 0.233 2.110 1.695 2.445 2.321
0.001 0.000 1.000 1688 0.000 0.000 1.000 1861 0.000 0.000 1.000 1865 0.111 0.003 1.000 1784 0.478 0.047 1.000 1735 0.220 0.000 1.000 1718 0.000 -12.857 10.333 2205 1.500 0.000 11.333 2204 1.000 0.000 16.000 2205 1.000 0.000 16.000 2205
0.296 0.348 0.281 0.536 0.184
0.457 0.747 0.538 0.547 0.077
0.000 0.000 0.000 0.400 0.203
0.000 0.000 0.000 0.000 0.069
1.000 6.000 4.000 4.333 0.320
2207 2207 2207 2207 2207
6.024 5.087 0.047 0.025 0.078 0.034 0.150 47.033 50.186 8.004 0.938 0.128
1.961 1.330 0.097 0.079 0.110 0.090 0.270 7.701 5.514 3.163 1.206 0.158
6.000 5.000 0.000 0.000 0.000 0.000 0.000 47.000 50.333 7.789 0.000 0.000
2.000 2.000 0.000 0.000 0.000 0.000 0.000 24.000 27.200 0.000 0.000 0.000
15.000 15.000 0.556 0.500 0.556 0.667 1.000 72.000 73.500 21.920 4.000 0.500
2207 2207 2207 1273 934 2207 934 2192 2207 2207 2207 2207
13.313 2.029 0.772 0.657
13.074 0.709
5.366 23.006 1635 -0.994 8.127 1733
1.482 1.105
1.138
0.361
9.465 1678
The table shows descriptive statistics for the board mechanisms, the control variable, and the performance measure. The board mechanisms are classified according to their primary function (interest alignment, information provision, and decisiveness) as discussed in section 2. Table A.1 in the appendix defines the variables.
3.2. INTEREST ALIGNMENT
3.2
17
Interest alignment
As we argued in section 2.1, the alignment of interest between principals and agents may be influenced by the firm’s ownership structure and by the degree of independence between the board and the CEO. According to table 3.1, the three largest owners as a group have on average a simple majority (49.8% of the equity). The average largest owner has less than one third (29.3%), which means the largest owner cannot alone block a charter amendment, which requires a two thirds majority.3 This pattern supports the impression from section 3.1 that the ownership concentration of Norwegian firms is low by international standards. The important implication in our setting is that the resulting separation between outside ownership and insider control makes the board a particularly important vehicle for reducing potentially large agency costs. Because inside ownership increases the directors’ incentives to monitor the CEO, it also reduces outside owners’ need to monitor the board. According to table 3.1, insiders (officers and directors) as a group hold on average 7.4% of the equity, and the CEO owns 3.6%. These figures reflect that large, powerful owners are mostly absent as inside monitors. Table 3.2 spells out the relationship between the equity holdings of the CEO and of the non-CEO directors. Table 3.2 The relative frequency of equity ownership by firm insiders Directors CEO owns Average own no shares shares Total N holding, % no shares 35.9 14.3 50.2 937 shares 6.0 43.8 49.8 928 12.9 Total % 41.9 58.1 100.0 N 782 1083 1865 Average holding, % 6.4 16.7 Value df p-value Pearson χ2 676.4 1 0.000 The table shows the relative frequency by which the firm’s CEO and the non-CEO directors hold equity in the firm. The two-sided Pearson χ2 statistic tests the null hypothesis that the joint distribution of the cell counts in a two-dimensional contingency table equals the product of the row and column marginals (Agresti, 1990, p. 42-47).
More than 40% of the CEOs do not own shares in the firm they run, and half 3 Bøhren
and Ødegaard (2006) show that there is little need to distinguish between cash flow rights (which is used in table 3.1) and voting rights in our setting. The figures are almost identical if non-voting shares are ignored in the table.
18
CHAPTER 3. DESCRIPTIVE STATISTICS
the firms have boards where no director owns any of the firm’s equity. The average holdings when the CEO (the directors) do invest is 6.4% (12.9%). The table also shows that the tendency to hold the firm’s shares is positively correlated across the two insider types in a statistically significant way. Neither the directors nor the CEO holds equity in 35.9% of the firms, whereas both do in 43.8% of the cases, when the average sum of their holding is 19.5%. Thus, unlike what would be expected from an agency logic, the two insider ownership characteristics are used as complementary rather than substitute ways of reducing agency costs: The directors’ economic incentives to monitor are stronger (high director equity stakes) the smaller the need for such monitoring (high CEO equity stake) and vice versa. This suggests owners tend to either overinvest or underinvest in these two alignment mechanisms.4 The average value of the independence proxy as defined in expression (2.1) is -0.275. The same value follows from the separate tenure figures reported for these two insider types, which are 2.2 and 1.9 years, respectively. This means the average CEO has slightly longer tenure than the firm’s average director.5 However, the large difference between the extreme values of the tenure variables and also the high standard deviation of the independence proxy reflect considerable cross-sectional variation in expression (2.1), which is necessary to validly test the independence hypothesis. For instance, the average director took office almost 13 years before the CEO in the strongest independence case and more than 10 years after in the strongest dependence case.
3.3
Information provision
Table 3.1 shows that the CEO is not a director in the firm in 70% of the cases. Every third CEO sits on another listed firm’s board (exported CEO director), and 4 As documented by the maximum value of 1 for every ownership structure variable in table 3.1, we have not yet weeded out all data errors. However, since the averages are so close to what has been found in a similar sample earlier (Bøhren and Ødegaard, 2006), we do not think these errors have any noticeable effect on our conclusions. 5 CEO tenure and chair tenure in the table both have higher maximum values (16) than the number of sample years (14). This is because we collect board data from 1986 in order to reduce the censoring bias for firms listed in the beginning of the sample period. Still, as we do not have access to backward-looking board and CEO data for firms that became listed after 1989, tenure is certainly underestimated. However, since the independence proxy we use in the statistical tests is the difference between director tenure and CEO tenure, we have no reason to believe that this measure is biased.
3.3. INFORMATION PROVISION
19
the maximum is six outside seats.6 Still, the typical (median) CEO has no outside directorships. More details are given in table 3.3. Table 3.3 The CEO’s inside and outside directorships CEO is director on own board? Yes No Either N Pearson χ2
Number of CEO’s outside directorships 0 1 2 3 4 5 6 N 69.4 18.8 5.8 4.4 0.8 0.3 0.5 653 79.2 15.4 3.9 1.2 0.2 0.1 0.0 1554 76.3 16.4 4.4 2.2 0.4 0.1 0.1 1684 363 98 48 8 3 3 2207 Value df p-value 48.2 6 0.000
The table shows the frequency with which the CEO holds directorships in other firms, conditional on whether the CEO is (’Yes’) or is not (’No’) a director on own board. The two-sided Pearson χ2 tests the null hypothesis that the joint distribution of the cell counts in a two-dimensional contingency table equals the product of the row and column marginals (Agresti, 1990, p. 42-47).
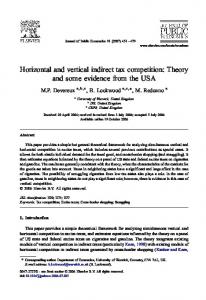
The second column and the bottom row show that a CEO sits significantly more often on other firms’ boards when he is also a director in the firm he runs (30.6%) than otherwise (20.8%). This holds for any number of outside directorships. Thus, a potentially problematic principal-agent relationship inside the firm (the agent monitors himself) tends to make the CEO create the same problem in other firms (one agent by profession monitors another agent by profession). The dominating pattern is still that CEOs are not also directors, neither in the firm they run nor elsewhere. By necessity, the same holds for imported CEO directors. For the board as a whole, the average number of outside directorships per member is roughly one half. It also turns out that these frequencies have decreased over the sample period. For instance, whereas 34.7% of the CEOs were on their own board and held on average 0.4 outside board seats in 1989, the corresponding figures are 25.1% and 0.3 in 2002. Figure 3.1 uses the sample firms for 1997 to illustrate the logic of the information centrality measure, which we use to construct the director network variable. A node represents a firm, and a line reflects a connection between two firms created by multiple directorships. The more lines that pass through a node, the stronger the firm’s information centrality. Firms that do not share any director with any other firm have no lines and are isolated from the network. Such firms 6 Since we only have directorship data for listed firms, we are underestimating the true number of outside directorships.
20
CHAPTER 3. DESCRIPTIVE STATISTICS
Figure 3.1 The sample firms in 1997 and their connections. Each dot represents a firm, and each line represents a joint director. Dots without lines attached indicate a firm with no joint director. The graph has a random layout, and some unconnected firms are ignored for expositional reasons.
constitute 33.8% of the sample in 1997. When a director sits on other boards, he meets directors who may be on other boards with still other directors, and so on. This means the firm gets access to a network which is determined by both direct and indirect director overlap. The more direct and indirect links, the better connected the firm is, and the shorter it needs to travel in order to reach key parts of the information network. The mean score on the network variable is 0.184, varying between 0.069 and 0.320.
3.4. DECISIVENESS
3.4
21
Decisiveness
The third section of table 3.1 reports summary statistics for board size, gender, age, and employee directors. Because the incentives of employee directors may make them behave differently in boards than stockholder-elected directors, we measure board size both with (Size) and without (Size1) employee directors. The average board size is six directors, and one less if we ignore employee directors. This is a very small board by international standards.7 Although the largest boards become less common over time, average size is quite stable. For instance, the largest board observed over the sample period has 15 members, but the maximum in 2002 is 12. The 25% largest boards had on average 8.97 members in the first half of the sample period and 8.67 in the second. The average fraction of women on the board is 4.7% (Gender). It drops to 2.5% if we exclude boards with employee directors (Gender1), and rises to 7.8% in boards with employee directors (Gender2). Thus, employees elect women considerably more often than the owners. On average, the fraction of elected women is 3.4% among the owners (Gender3) and 15% among the employees (Gender4).8 Table 3.4 shows how the use of female directors varies with board size under the five different definitions of gender diversity. Although the proportion of females tends to decrease with board size when the board has no employee directors and otherwise when boards are small, the overall relationship between board size and the fraction of female directors is positive and significant for the full sample. The dynamics of gender diversity over the sample period is shown in table 3.5. The message is that although the substitution of male directors by female has been going on all the time, the tendency is particularly strong after 1995. The fraction of female directors is two to three times higher in the end of the sample period than in the middle. Like gender, director age is a potential source of board diversity. Table 3.1 shows that the average CEO is 47 years old and roughly three years younger than the directors. The average age per board varies between 27.2 and 73.5 years. We measure a board’s age diversity by the standard deviation of its directors’ age. 7 Wymeersch (1998, p. 1105-1109) reports an average board size of 10.07 in the UK, 12.05 in France, 10.44 in Belgium, 12.00 in Italy, and 6.54 in the Netherlands. The average size of the German supervisory board is 13.25 (Hopt, 1998, p. 248). Carter and Lorsch (2004) find that the average US board has about 12 directors, which is down from 16 in the 1980s. 8 The number of observations for Gender2 (the proportion of females in firms with employee directors) and Gender4 (the proportion of females among employee directors) is lower than for other variables. This is because Gender2 and Gender4 are only defined for the subsample of firms with employee directors.
22
CHAPTER 3. DESCRIPTIVE STATISTICS
Table 3.4 The average fraction of female directors by board size Board size gender N gender1 N gender2 N gender3 N gender4 N 2 0.093 27 0.046 27 0.089 28 3 0.036 204 0.012 204 0.035 242 4 0.012 252 0.003 244 0.063 8 0.014 439 0.016 8 5 0.028 464 0.005 419 0.211 45 0.030 726 0.015 45 6 0.044 387 0.004 257 0.218 130 0.045 510 0.014 130 7 0.055 382 0.004 88 0.128 294 0.049 203 0.009 294 8 0.064 255 0.004 28 0.125 227 0.060 44 0.008 227 9 0.104 146 0.002 5 0.131 141 0.049 9 0.012 141 10 0.076 51 0.116 51 0.100 2 0.008 51 11 0.154 33 0.356 33 0.014 33 12 0.083 2 0.000 2 0.007 2 13 0.000 2 14 0.000 1 0.000 1 0.000 2 15 0.000 3 0.000 3 0.000 3 Avg 0.047 0.025 0.078 0.034 0.150 Corr 0.208 -0.041 -0.018 -0.042 0.078 N 2207 1273 934 2207 934 The table shows the percentage of female directors across different board sizes. ’Avg’ is the average of the variable, ’Gender’ is the fraction of female directors in all boards, ’Gender1’ (’Gender2’) is the fraction of female directors in boards without (with) employee directors, and ’Gender3’ (’Gender4’) is the fraction of female stockholder-elected (employee-elected) directors. Underlined Pearson’s correlations (’Corr’) between size and gender (2-tailed) are significant at the 5% level.
This measure is eight years on average, varying between zero (every director has the same age) and 21.9 years. Table 3.1 shows that when we consider all boards regardless of whether or not they have employee directors, there is about one employee director per board on average. According to the second column of table 3.6, 41.5% of the sample firms have employees on their boards. This proportion has declined over the years from a typical value of 50% in the first half of the sample period to less than 40% in the second. The reason may be a higher proportion of firms in exempted industries, a relative increase in the fraction of small firms or a larger proportion of firms organized as holding companies. The table also shows that when employees are represented, they have between one and four directors. Two or three are the dominating cases, three gradually becoming the most common number.
3.5. PERFORMANCE
23
Table 3.5 The average fraction of female directors per year Year Gender N Gender1 N Gender2 N Gender3 N Gender4 N 1989 0.028 95 0.016 49 0.042 46 0.008 95 0.134 46 1990 0.036 99 0.028 50 0.043 49 0.019 99 0.112 49 1991 0.027 93 0.007 46 0.047 47 0.009 93 0.135 47 1992 0.030 95 0.011 44 0.046 51 0.014 95 0.118 51 1993 0.031 91 0.006 45 0.055 46 0.017 91 0.128 46 1994 0.038 101 0.020 53 0.059 48 0.027 101 0.104 48 1995 0.040 186 0.018 115 0.075 71 0.029 186 0.140 71 1996 0.046 192 0.027 118 0.075 74 0.037 192 0.120 74 1997 0.037 215 0.018 135 0.069 80 0.028 215 0.131 80 1998 0.047 217 0.018 128 0.089 89 0.031 217 0.180 89 1999 0.055 213 0.026 122 0.095 91 0.037 213 0.190 91 2000 0.057 209 0.034 122 0.090 87 0.046 209 0.156 87 2001 0.061 202 0.033 123 0.104 79 0.047 202 0.173 79 2002 0.081 199 0.051 123 0.130 76 0.068 199 0.207 76 Avg 0.047 0.025 0.078 0.034 0.15 N 2207 1273 934 2207 934 The table shows the mean number of female directors for each year. ’Avg’ is the average of the variable, ’Gender’ is the fraction of female directors in all boards, ’Gender1’ (’Gender2’) is the fraction of female directors in boards without (with) employee directors, and ’Gender3’ (’Gender4’) is the fraction of female stockholder-elected (employee-elected) directors.
3.5
Performance
We measure economic performance by Tobin’s Q and operationalize it as the market value of assets per unit book value. The market value of debt is set equal to its book value. The average (median) Q in the sample firms is 1.48 (1.14), with a minimum of 0.36 and a maximum of 9.47. Since we will later regress Q on board characteristics while controlling for firm size, we use sales rather than assets to measure size because Q is defined in terms of assets. Table 3.7 reports the mean value of each board characteristic across the performance deciles. The rightmost column shows the difference between the highest and lowest decile and its statistical significance. In this univariate setting, most board mechanisms are related to extreme values of performance in a statistically significant way. Under the alignment perspective, inside (outside) ownership concentration relates positively (negatively) to performance, and both directors and CEOs perform better in the early years of their service period than later. The information mechanisms suggest that a CEO should not be on his own board, whereas outside directorships for non-CEOs is beneficial
24
CHAPTER 3. DESCRIPTIVE STATISTICS
Table 3.6 The relative frequency of employee directors by year and number Year 1989 1990 1991 1992 1993 1994 1995 1996 1997 1998 1999 2000 2001 2002 Average N
No. of employee directors 0 1 2 3 4 N 52,6 2,1 30,5 13,7 1,1 95 49,5 5,1 32,3 13,1 0,0 99 49,5 5,4 26,9 18,3 0,0 93 45,3 9,5 26,3 18,9 0,0 95 49,5 7,7 24,2 18,7 0,0 91 53,5 6,9 23,8 15,8 0,0 101 64,5 5,9 17,7 11,3 0,5 186 63,0 5,2 17,7 13,5 0,5 192 62,3 7,0 17,2 13,0 0,5 215 58,1 6,5 18,0 16,6 0,9 217 57,3 5,2 18,3 18,3 0,9 213 62,7 6,2 14,8 15,3 1,0 209 62,9 5,9 13,9 16,3 1,0 202 61,8 6,0 13,6 17,6 1,0 199 58,5 6,0 19,3 15,6 0,6 2207 1292 132 425 344 14 2207
and more so the wider the information network it creates. The decisiveness mechanisms indicate that more age dispersion is unfavorable, that younger officers and CEOs perform the best, and that more women increase (decrease) performance on boards with (without) employees. There is no significant relationship between extreme values of Q and board independence, board size (except when we exclude employee directors), and the use of employee directors.
Variable Alignment Insider holdings Directors’ holdings CEO holdings Herfindahl index Three largest owners Largest outsider Insider ownership Independence Board tenure CEO tenure Chair tenure Information CEO director Exported CEO Imported CEO Outside directorships Network
Decile of Tobin’s Q 5 6 7
1
2
3
4
0.08 0.06 0.03 0.21 0.56 0.34 0.08 -0.03 2.38 2.42 2.55
0.06 0.06 0.05 0.15 0.50 0.27 0.06 -0.42 2.38 2.80 2.27
0.09 0.07 0.03 0.16 0.50 0.28 0.09 -0.40 2.29 2.69 2.13
0.05 0.04 0.03 0.16 0.48 0.28 0.05 -0.65 2.06 2.72 2.22
0.06 0.07 0.02 0.16 0.49 0.28 0.06 -0.34 2.17 2.52 1.96
0.04 0.02 0.02 0.16 0.48 0.27 0.04 -0.08 2.37 2.46 2.31
0.28 0.39 0.04 0.56 0.18
0.26 0.28 0.05 0.43 0.17
0.28 0.34 0.05 0.45 0.19
0.25 0.39 0.04 0.51 0.18
0.24 0.36 0.05 0.55 0.20
0.23 0.47 0.06 0.58 0.19
8
9
10
10-1
0.04 0.03 0.02 0.15 0.46 0.25 0.04 -0.75 2.38 3.13 2.33
0.06 0.05 0.05 0.15 0.47 0.26 0.06 -0.22 2.20 2.42 2.33
0.11 0.11 0.06 0.13 0.43 0.22 0.11 -0.13 1.81 1.94 2.00
0.14 0.13 0.05 0.09 0.37 0.18 0.14 -0.22 1.64 1.86 1.70
0.06** 0.06** 0.02 -0.12** -0.19** -0.16** 0.06** -0.19 -0.74** -0.55** -0.84**
0.23 0.36 0.05 0.51 0.20
0.31 0.22 0.17 -0.11** 0.36 0.33 0.30 -0.09 0.06 0.05 0.06 0.01 0.57 0.68 0.84 0.28** 0.20 0.21 0.21 0.03** continued on next page
3.5. PERFORMANCE
Table 3.7 Board characteristics across performance deciles
25
Decile of Tobin’s Q 5 6 7
2
3
4
6.14 5.25 0.06 0.05 0.10 52.16 8.56 48.15 0.90 0.12
6.03 5.24 0.03 0.03 0.05 51.19 8.58 47.17 0.79 0.10
6.55 5.51 0.04 0.03 0.10 51.62 8.48 48.01 1.04 0.13
6.50 5.50 0.03 0.02 0.06 50.96 8.12 47.48 1.00 0.13
6.66 5.45 0.04 0.03 0.10 50.74 7.93 47.53 1.22 0.15
6.42 5.31 0.05 0.03 0.17 51.73 8.36 47.25 1.10 0.14
6.68 5.28 0.06 0.04 0.17 51.64 8.09 48.42 1.39 0.18
8
9
10
10-1
6.40 5.29 0.06 0.04 0.22 51.77 8.01 47.37 1.10 0.14
6.11 5.12 0.04 0.02 0.17 49.87 7.61 46.00 0.99 0.13
6.00 5.04 0.06 0.02 0.32 49.86 7.84 44.65 0.96 0.13
-0.14 -0.20* 0.00 -0.03** 0.22** -2.30** -0.71** -3.50** 0.06 0.02
12.97 13.48 13.40 13.44 13.72 13.57 13.91 13.39 13.05 12.29 -0.68** 0.70 0.70 0.64 0.70 0.71 0.74 0.80 0.85 0.91 1.01 0.31** 0.71
0.88
0.95
1.02
1.10
1.19
1.31
1.52
2.00
4.17
3.46**
The table shows the average value of variables listed in the first column for each decile of Tobin’s Q. The rightmost column shows the difference between deciles 10 (highest Q decile) and 1 (lowest Q decile). Based on a z test, one (two) star(s) reflects a difference which is statistically significant at the 10% (5%) level. There are 167 firms in deciles 1 and 10 and 168 in the others. The variables are defined in table A.1.
CHAPTER 3. DESCRIPTIVE STATISTICS
1
26
Variable Decisiveness Size Size1 Gender Gender1 Gender2 Board age Board age dispersion CEO age Employee directors Fraction employee directors Controls Firm size Risk Performance Q
3.6. COMOVEMENT AMONG THE BOARD DESIGN MECHANISMS
3.6
27
Comovement among the board design mechanisms
Table 3.8 shows the bivariate correlations between any pair of independent variables to be used in the regression models of chapter 4 and also their partial correlations with Tobin’s Q. Significant correlations at the five per cent level are underlined. The table shows that although many variables have a bivariate correlation coefficient which differs significantly from zero at the 5% level, they are still small. A rule of thumb suggests the correlation coefficient must exceed 0.7 before multicollinearity problems become problematic in regressions.9 Also, in order to avoid high correlations, our regressions will only use definitions of size and gender that exclude employee directors. To illustrate, the Pearson correlation between board size and the percentage of employee directors is 0.646 when employee directors are included in the size measure (Size). As shown in the table, the correlation is only 0.068 when the size measure ignores employee directors (Size1).
9 Moreover, Hsiao (1986, p. 2-3) points out that multicollinearity is unlikely to cause trouble in panel data settings, since this normally involves more data points and larger data variability than in a cross-section.
The table shows the Pearson bivariate correlation coefficients between variables used in the regressions. Underlined correlations are significantly different from zero at the 5% level. ’Tobq’ is Tobin’s Q, ’Dirs’ is director ownership, ’Herfx’ is the Herfindahl index for outside owners, ’Indep’ is Independence, ’Ceodir’ is CEO director, ’Expceo’ is Exported CEO, ’Impceo’ is Imported CEO, ’Netw’ is Network, ’Size’ is board size (employee directors excluded), ’Gend’ is Gender (employee directors excluded), ’Agediv’ is Board age dispersion, ’Edfra’ is the Fraction of employee directors, and ’Fisize’ is firm size. The variables are defined in table A.1.
CHAPTER 3. DESCRIPTIVE STATISTICS
Dirs Herfx Indep Ceodir Expceo Impceo Netw Size Gend Agediv Edfra Fisize Risk Tobq 0.102 -0.151 0.028 -0.042 -0.039 0.032 0.105 -0.094 -0.061 -0.073 0.002 -0.188 0.141 Ob 1.000 -0.079 0.013 0.000 0.031 -0.009 0.033 0.056 -0.002 -0.073 0.002 -0.054 -0.094 Herfx 1.000 -0.036 0.058 -0.014 -0.019 -0.128 -0.048 0.121 -0.007 0.020 -0.002 -0.173 Indep 1.000 -0.026 -0.083 -0.001 -0.020 -0.089 0.026 -0.019 -0.046 -0.077 0.043 Ceodir 1.000 0.142 -0.085 -0.089 -0.050 -0.040 0.032 -0.193 0.035 0.090 Expceo 1.000 0.019 0.150 0.008 0.042 0.001 0.004 0.133 0.073 Impceo 1.000 0.046 -0.060 -0.069 -0.044 -0.067 -0.026 0.060 Network 1.000 0.172 -0.057 -0.016 0.065 0.190 0.155 Size1 1.000 0.064 0.145 0.070 0.234 -0.062 Gender 1.000 -0.032 0.091 0.081 -0.074 Agestd 1.000 -0.075 -0.028 -0.083 Edpst 1.000 0.258 -0.082 Lnaccinc 1.000 0.093 Risk 1.000
28
Table 3.8 Bivariate correlations between variables used in the regression models
3.7. SUMMARY
3.7
29
Summary
This chapter on descriptive statistics was organized according to the three major functions that board design mechanisms may have. The findings on interest alignment show that because both outside and inside ownership concentration are low in our sample firms, potential agency costs are high. Also, insider ownership by the CEO and by the directors tend to be complements rather than substitutes. This setting makes the board’s monitoring function questionable from an agency standpoint, particularly in firms where low inside equity holdings produce both weak value maximization incentives for the CEO and weak monitoring incentives for the directors. The board’s independence of the CEO is medium in the sense that the CEO and the average director have roughly the same tenure. The CEO is a director in the firm he runs in less than one third of the cases, and those who are sit on other listed firms’ boards more often than others. This is still the exception than the rule, and more common at the beginning of the sample period than in the end. Our information centrality measure, which reflects the direct and indirect nature of multiple board positions per director, shows that boards differ considerably in their director-driven access to outside information. The board’s decisiveness is strong if small size helps, as the average board has only six directors. If more diversity reduces decision speed, the gender mix should be beneficial as well. The average fraction of female directors is only 5%, although ten percent points higher in firms with employee directors and increasing considerably over time. Age represents much more diversity than board size and gender. The typical director is forty seven years old, average director age per board varies by almost fifty years across the sample firms, and there are often large age variations within the board. Less than half the firms have employee directors, and the fraction declines over time. These board mechanisms have low pairwise correlations, suggesting that multicollinearity will not be a problem in regressions. Most of these mechanisms are significantly different in firms with particularly low versus particularly high performance. The next chapter explores the relationship between board design and performance in a systematic, multivariate way.
Chapter 4
Statistical tests 4.1
The basic model
Based on the theoretical discussion in chapter 2 and the descriptive statistics in chapter 3, we want to investigate the following relationship between economic performance and board design mechanisms: Q = Constant + β1 Directors’ holdings + β2 (Directors’ holdings)2
(4.1)
+ β3 Outside concentration + β4 Independence + β5 CEO director dummy + β6 Exported CEO + β7 Imported CEO + β8 Network + β9 Size + β10 Gender + β11 Board age dispersion + β12 Fraction employee directors + γ1 Firm size + γ2 Risk + uit Because table 3.2 showed that insider ownership by non-CEO officers and by the CEO are strongly correlated, we use only the directors’ aggregate holdings in (4.1). We also remove employee directors from the proxies for independence, age diversity, network, size, and gender. This approach reduces multicollinearity problems and also enables us to separate the effects of shareholder directors from those of employee directors. On the other hand, several predictions from chapter 2 do not distinguish between director types, such as the relationship between board size and decisiveness. We return to that issue in chapter 5 by including employee 30
31
4.1. THE BASIC MODEL
directors in the size, independence, and gender proxies. Finally, we account for the control variables firm size and risk. Firm size is measured by the log of accounting income, and risk is measured as the firm’s equity beta. Our data set involves repeated observations of the same firm for up to fourteen years. Since this is a panel data setting, we will use the firm level fixed effects (FE) model and estimate it by GLS and GMM. Although the FE model is the most frequently used panel data method, most corporate governance research has ignored the time-series nature of the data and instead used a pooled cross section approach to analyze cross-sectional time-series data. A serious problem with this method is that it ignores possible correlation between observable and non-observable variables in general and the unobserved heterogeneity of firms in particular. This happens because each firm, which turns up several times in the data set, changes its identity only slowly over time. A panel data approach controls for such correlated, time-invariant heterogeneity across firms, even if it cannot be observed. We may, so to speak, control for the firm’s identity. In contrast, researchers using cross-sectional regressions on a pooled sample include control variables such as age and industry in order to capture this persistent, unobserved heterogeneity across firms. But two shipping firms founded in the same year may still have different optimal board design mechanisms. This is because they differ in terms of exogenous characteristics such as location, stage in the life-cycle, and risk. We analyze the seriousness of ignoring this heterogeneity in chapter 5, where we compare the results from OLS estimation in pooled crosssectional models to those we find with panel data methods. A further advantage of panel methods is that the moments needed for GMM estimation are readily available from the data structure itself. This property is discussed in section 4.2. The disadvantage of FE models is that because time invariant variables cannot be included, the separate impact of characteristics like firm type and industry membership must be ignored. Still, the FE model will take account of firm heterogeneity far better than what is possible under alternative techniques. Moreover, the is no time invariant explanatory variables in our model as specified in (4.1). The basic FE model is defined by Woolridge (2002, p. 251) (see also Green (1993, p. 615-623)) as
Qit = θ + βXit′ + ci + uit
i = 1, 2, . . . , N
(4.2)
t = 1, 2, . . . , T
Here, i is the firm, t is the time period, θ is a constant, Xit = (xi1t , xi2t , . . . , xiKt ) is
32
CHAPTER 4. STATISTICAL TESTS
a vector of K +1 explanatory variables, β is the corresponding vector of coefficients, ci is the unobserved individual, time-independent effect of firm i, and uit is the idiosyncratic error, which varies across firms and time periods. We observe Qit and Xit and want to estimate β while holding the unobserved individual effect ci constant. The error term uit is assumed to be uncorrelated with Xit and ci . For each variable and each individual firm, the model amounts to subtracting the year’s observation from the overall mean of the variable for that firm. The resulting time demeaned dependent variable is T X ˜ it = Qit − 1 Qit Q T t=1
(4.3)
Using the same procedure for the independent variables by demeaning {Xit into ˜ it , the FE estimation equation may now be written as: X ˜ it = β X ˜ it′ + u Q ˜it
i = 1, 2, . . . , N
(4.4)
t = 1, 2, . . . , T
Since the unobserved, individual heterogeneity ci is constant over time per firm, it disappears through the time-demeaning procedure because each year’s value of ci is identical to its mean value. Thus, the individual firm heterogeneity is controlled for. The need to use control variables becomes less important under a fixed effects model. Nevertheless, in order to take account of possible performance effects of firm size and risk, we include the log of accounting income as a measure of firm size, and equity beta as a risk proxy. The inclusion of risk may be motivated by the Raheja (2005) model, where monitoring becomes more valuable the more risky the environment. Thus, risk is a truly exogenous variable. In the robustness section (table 5.2) we also run a model without the control variables. We will use the FE approach in a number of settings. First, we estimate the basic model (4.1) with time-demeaned variables in section 4.2, using GLS and GMM techniques. Subsequently, we explore reverse causation and endogeneity of board design mechanisms in section 4.3. Finally, reverse causation and endogeneity is analyzed in a dynamic FE model in section 4.4, where we introduce lagged performance and thereby allow for feedback from past firm performance to current board design. Section 4.5 summarizes our test results.
4.2. STATIC FIXED EFFECTS ESTIMATION
4.2
33
Static fixed effects estimation
Tables 4.1 and 4.2 show the estimates for the fixed effects model under GLS and GMM estimation, respectively. The full specification in expression (4.1) is estimated as model (A) in the tables, and the remaining models (B)-(G) are partial versions of (A). A partial model includes the control variables and either one or two of the three sets of board design mechanisms. The assumption underlying these models is that all governance mechanisms and control variables are strictly exogenous. That is, E (uit |Xi1 , . . . , XiT , ci ) = 0 when t = 1, . . . , T . These are the moment conditions, from which instruments may be constructed. Thus, unlike under simultaneous equations estimation, instruments may be constructed from within the panel data structure itself. In order to identify the coefficients in the GMM models, we had to construct a number of instruments. First, we used the raw (Amemiya and MaCurdy, 1986), the time-demeaned, and the squared time-demeaned explanatory variables. Furthermore, we included the average and standard deviation of firm-demeaned explanatory variables (Breusch et al., 1989). Firm-demeaning is achieved by taking the average of the governance mechanism or control variable across firms for each time period. Thus, the specific instruments used in each regression in table 4.2 varies with the explanatory variables included in each model. Our choice of instruments illustrates the advantage of panel data that modified variables used in the model can also be used as instruments. Finally, variables not included in the regressions, such as the CEO’s age and ownership stake, are used as instruments as well. These sets of instruments are used for all GMM models in chapter 4. Overall fit as measured by R2 is high in every GLS model in table 4.1. The F statistics are significant, and the Breusch-Pagan tests show that the error terms are homoscedastic. Correspondingly, the GMM estimations in table 4.2 show that according to Hansen’s J statistic, the instruments are relevant in most regressions. The overidentification test statistic suggests that the instruments are uncorrelated with the error term in every regression except in model (B), where only alignment variables are retained.
34
CHAPTER 4. STATISTICAL TESTS
Table 4.1 Firm performance explained by board design mechanisms, using GLS to estimate seven fixed effects models. Variable Alignment Directors’ holdings Directors’ holdings sqrd Herfindahl index Independence Information CEO director Exported CEO Imported CEO Network Decisiveness Size Gender Board age dispersion Employee directors Controls Firm size Risk N Centred R2 F -test (p-value) Breusch-Pagan (p-value)
(A)
(B)
0.507 -0.414 0.283 -0.014
0.558 -0.522 0.339 -0.014
0.058 -0.026 -0.052 1.621∗∗ -0.077∗∗ -0.808∗∗ 0.002 -1.252∗∗
(C)
(D)
0.078 -0.018 0.015 1.625∗∗
(E)
(F)
0.464 -0.431 0.379 -0.012
0.592 -0.502 0.237 -0.015
0.074 -0.024 0.014 1.641∗∗ -0.055∗∗ -1.053∗∗ 0.000 -1.255∗∗
(G)
0.061 -0.018 -0.049 1.621∗∗ -0.063∗∗ -0.072∗∗ -1.010∗∗ -0.842∗∗ 0.002 0.000 -1.272∗∗ -1.249∗∗
-0.056∗∗ -0.066∗∗ -0.062∗∗ -0.059∗∗ -0.063∗∗ - 0.060∗∗ -0.055∗∗ 0.025 0.060 0.038 0.031 0.044 0.038 0.018 1510 1510 1520 1520 1510 1510 1520 0.665 0.658 0.657 0.657 0.659 0.659 0.664 0.000 0.000 0.000 0.000 0.000 0.000 0.000 0.000 0.000 0.000 0.000 0.000 0.000 0.000
The table shows estimates of GLS regression models where the dependent variable is the time demeaned Tobin’s Q, which we measure as the market value of the firm over its book value. The full specification in equation (4.1) is estimated as model (A), and models (B)-(G) are partial versions of (A). Besides the control variables, a partial model includes one or two of the three sets of board design mechanisms (alignment, information, and decisiveness). For each firm and each variable, time demeaning involves subtracting a given year’s observation from the firm’s overall mean. Significant results at the 5% (10%) level are marked with ∗∗ (∗).
Thus, both estimation methods show satisfactory test statistics. Furthermore, estimated coefficient signs and significant results are very consistent across the two estimation methods, and the coefficients are quite similar across the six model specifications for a given estimation method. To simplify the discussion, we focus initially on the full model (A) and GMM as reported in table 4.2, limiting the attention to estimated coefficients with a p-value of 10% or less.
35
4.2. STATIC FIXED EFFECTS ESTIMATION
Table 4.2 Firm performance explained by board design mechanisms, using GMM to estimate seven fixed effects models. Variable Alignment Directors’ holdings Directors’ holdings sqrd Herfindahl index Independence Information CEO director Exported CEO Imported CEO Network Decisiveness Size Gender Board age dispersion Employee directors Controls Firm size Risk N J statistic J’s p-value Over ID test ID test p-value
(A)
(B)
0.924∗ -0.712 0.192 -0.011∗
0.694 -0.702 0.182 -0.011∗
0.081∗ -0.030 -0.055 1.385∗∗
(C)
(D)
(E)
(F)
(G)
0.855∗ 0.817 -0.709 -0.738 0.257∗∗ 0.131 -0.010 -0.011∗∗ 0.109∗∗ -0.030 -0.018 1.392∗∗
0.084 -0.019 -0.014 1.260∗∗
-0.053∗∗ -0.626∗∗ 0.000 -1.061∗∗ -0.036∗∗ -0.038∗∗ -0.035∗ -0.002 0.005 -0.007 1502 1502 1507 34.322 42.572 21.888 0.357 0.000 0.237 26.950 30.439 25.483 0.720 0.016 0.112
-0.041∗∗ -0.862∗∗ -0.002 -1.131∗∗
0.067 -0.023 -0.063 1.362∗∗ -0.040∗∗ -0.049∗∗ -0.850∗∗ -0.623∗∗ -0.001 -0.002 -1.160∗∗ -1.048∗∗
-0.029∗ -0.040∗∗ -0.035∗∗ 0.003 -0.002 0.003 1507 1502 1502 16.210 35.523 36.326 0.578 0.061 0.067 25.095 22.676 28.217 0.122 0.539 0.298
-0.026 -0.005 1507 21.534 0.761 24.478 0.604
The table shows estimates of GMM regression models where the dependent variable is the time demeaned Tobin’s Q, which we measure as the market value of the firm over its book value. The full specification in equation (4.1) is estimated as model (A), and models (B)-(G) are partial versions of (A). Besides the control variables, a partial model includes one or two of the three sets of board design mechanisms (alignment, information, and decisiveness). For each firm and each variable, time demeaning involves subtracting a given year’s observation from the firm’s overall mean. Significant results at the 5% (10%) level are marked with ∗∗ (∗). The instruments are the raw, the time-demeaned, and the squared time-demeaned explanatory variables, the average and standard deviation of firm-demeaned explanatory variables, and variables not included in the regressions.
For the alignment mechanisms, there is a positive, significant relationship between performance and insider ownership as measured by directors’ holdings. This is consistent with the extant literature, although the negative sign on the squared insider holdings is not statistically significant (McConnell and Servaes, 1990; Gugler, 2001). The insignificant effect of outside ownership concentration is consistent with several other studies summarized in Gugler (2001). Also, as discussed in section 2.1, it has often been found that when more board design mechanisms than just ownership are included in a regression model, the significant relationship between insider ownership and performance tends to disappear (Byrd and Hickman,
36
CHAPTER 4. STATISTICAL TESTS
1992; Cotter et al., 1997; Bhagat and Black, 2002). Yet, we are able to confirm the major findings in the ownership structure research. The negative, significant relationship between board independence and performance is consistent with the argument that although more independence may improve monitoring intensity, independent directors are less knowledgeable about the firm than dependent ones. The finding is also in line with Yermack (1996); Klein (1998); Bhagat and Black (2002), who use different independence measures than we do. The positive performance effect due to multiple directorships is the most significant information provision mechanisms. Thus, the higher the information centrality of the directors’ seats on other boards, the more the firm benefits from outside directorships. This finding shows that our information centrality measure, which reflects the direct and indirect information links created to other firms when our firm’s directors meet directors on other boards, does indeed pick up information sources with beneficial economic effects. The positive, significant sign for the CEO director variable is in line with results in Brickley et al. (1997). Moving on to the board’s decisiveness, every coefficient estimate except the one for age diversity is negative and significant. The finding that performance decreases with increasing board size is in line with the existing literature (Yermack, 1996; Eisenberg et al., 1998). It is remarkable that this relationship also turns up in our sample firms, which mostly have very small boards by international standards. Adding the finding that gender diversity is inversely associated with performance, it seems that homogeneous, small groups work better than large, heterogeneous ones. Finally, and consistent with the theoretical arguments of Williamson (1996) and Cadbury (2002), the use of employee directors is negatively associated with the firm’s market value. This result supports the idea that employee directors defend their benefits at the expense of owners and creditors. It is also consistent with recent Canadian evidence that when employees have a strong voice in corporate governance, the firm is less efficient (Falaye et al., 2004). The fact that the pattern in the full model (A) mostly survives in the simpler models (B)-(G) suggests that the three major classes of board design mechanisms (alignment, information, and decisiveness) are quite independently related to corporate performance.
4.3. ENDOGENEITY AND REVERSE CAUSATION
4.3
37
Endogeneity and reverse causation
The results in section 4.2 may be biased due to endogeneity and reverse causation. In order to explore this possibility, we estimate five different equations, where the dependent variables are Directors’ holdings, Independence, Network, and Size, respectively. The estimation is carried out equation-by-equation in a fixed effects model using GMM. That is, we do not build a system of equations and jointly estimate their parameters. Compared to this alternative, our approach is preferable for two reasons (Krishnakumar, 1996, p. 202). First, because the true system of simultaneous equations is unknown, estimated coefficients in a misspecified simultaneous system will be biased. In particular, if the system misspecifies one local equation, the estimates of the other equations in the system will be contaminated. Thus, estimating each regression separately helps us keep the misspecification local. Second, estimation per equation provides consistent estimates for the system when instruments are taken from the conditional moment restrictions, which are produced from the panel structure of the data (Woolridge, 2002, p. 310). As in section 4.2, we construct the instruments from the explanatory variables. Since firm performance is now an independent variable in four of the five regressions, we also use performance to construct instruments. Table 4.3 shows our findings. For ease of comparison, column (A) reproduces the results from table 4.2. The table shows that there is two-way causation between governance on the one hand and independence, network, and board size on the other. Thus, more independence and larger boards both reduce performance (seen from the performance equation), whereas better performance produces more dependent boards and reduced board size (from the independence equation and size equation, respectively). Finally, the internal, two-way feedback between performance and network is positive. Thus, directors with a strong information network both improve performance and tend to be attracted to well-performing firms.
38
CHAPTER 4. STATISTICAL TESTS
Table 4.3 Reverse causation and endogenous board design mechanisms estimated in separate GMM regressions of four fixed effects models. The instruments correspond to those used in table 4.2. Dependent variable Independent Directors’ Indevariable Performance holdings pendence Network Alignment Directors’ holdings 0.924∗ 1.378 0.064 Directors’ holdings sqrd -0.712 -1.669 -0.061 Herfindahl index 0.192 0.048∗ -0.381 -0.065∗∗ ∗ Independence -0.011 -0.001 -0.001 Information CEO director 0.081∗ -0.018∗∗ -0.355∗∗ -0.014∗∗ Exported CEO -0.030 0.005 -0.234∗∗ 0.007∗∗ Imported CEO -0.055 -0.020 -0.322 -0.033∗ ∗∗ Network 1.385 0.025 -0.792 Decisiveness Size -0.05∗∗ 0.009∗∗ -0.245∗∗ 0.008∗∗ ∗∗ Gender -0.626 0.067 0.868 -0.108∗∗ ∗∗ Board age dispersion 0.000 -0.003 0.077∗∗ -0.001 Employee directors -1.061∗∗ 0.028 -0.915 0.004 Controls Firm size -0.036∗∗ 0.002 0.060 -0.002 Risk -0.002 -0.008 0.146∗ 0.004∗∗ Performance Tobin’s Q 0.000 -0.094∗ ∗ 0.012∗∗ N 1502 1502 1502 1502 J statistic 34.322 28.557 141.691 32.238 J’s p-value 0.357 0.435 0.000 0.310 Over ID test 26.915 21.460 171.026 33.620 ID test p-value 0.720 0.806 0.000 0.254
Size 0.823 -0.351 -1.088∗∗ -0.034∗∗ 0.024 -0.044 -0.505∗∗ 1.023∗∗
0.691∗ 0.038∗ -3.838∗∗ 0.061∗∗ 0.072∗∗ -0.085∗∗ 1502 67.849 0.000 86.605 0.000
The table shows estimates of reverse causation and mechanism endogeneity using five different dependent variables. Firm performance is measured as the time demeaned Tobin’s Q, which we operationalize as the market value of the firm over its book value. Model (A) is identical to model (A) in table 4.2. The other models use a governance mechanism as the dependent variable. For each firm and each variable, time demeaning involves subtracting a given year’s observation from the firm’s overall mean across the years. Significant results at the 5% (10%) level are marked with ∗∗ (∗).
Overall, these findings support the hypothesis of Hermalin and Weisbach (1998) that performance drives independence, and also the Raheja (2005) argument that board size will decrease as performance improves. Nevertheless, the coefficient of firm performance is rather low compared to governance variables in every regression. Thus, we cannot conclude that reverse causation is a serious problem in our regressions. The coefficient estimates of the four models to the right in the table show
39
4.4. THE DYNAMIC MODEL
that mechanism endogeneity primarily occurs in the information and decisiveness variables. However, the coefficient estimates are rather low when network is the dependent variable, suggesting that the impact of the other mechanisms on network is quite moderate. The significant signs are mostly negative across all four models, reflecting that the mechanisms are substitutes rather than complements. Moreover, the finding that several board design mechanisms are endogeneous rather than independent is consistent with the equilibrium argument of Demsetz and Lehn (1985). Finally, several board design mechanisms are significantly related to exogenous determinants, such as firm size and risk. For instance, board size grows with firm size, and the directors’ information network is richer the more risky the firm’s environment. To summarize, the evidence in table 4.3 supports the claim that both reverse causation and mechanism endogeneity exists in our data. However, the reverse causation is quite moderate, and endogeneity is mostly found among the information and decisiveness mechanisms. Neither result invalidates the finding from our basic model, where we assume that the endogenous performance variable is driven by the exogenous board design mechanisms.
4.4
The dynamic model
Reverse causation can also be partially captured by including lagged performance as an independent variable in (4.1). The required assumption is that lagged performance is predetermined (Arellano, 2003, p. 144). Such a variable is potentially correlated to lagged values of the error term, but uncorrelated with present and future error terms. This assumption is the so-called sequential moment condition, which can be expressed as E (uit |Xi1 , . . . , Xit , ci ) = 0 when (t = 1, . . . , T ), where lagged performance is one of the explanatory variables. Since this assumption allows for feedback from the lagged firm performance to the current board mechanisms, it may capture the potential reverse causation. If lagged performance is significant, it suggests board design is at least partially driven by performance. Thus, we will add lagged firm performance to our basic equation (4.1): Qt = θ + αQt−1 + β(Governance mechanisms)t + γ(Controls)t + uit
(4.5)
where α is the coefficient of lagged performance and β and γ are the coefficient vectors of the governance mechanisms and control variables, respectively.
40
CHAPTER 4. STATISTICAL TESTS
However, including Qt−1 in a fixed effects GLS model will bias the estimate of α (Hsiao, 1986, p. 73-76). The solution is to use a fixed effects GMM estimation. Thus, we estimate (4.5) with GMM and include lagged performance in the list of instruments. Table 4.4 Dynamic relationships between performance, board design mechanisms and lagged performance, using GMM to estimate seven fixed effects models. The estimation uses lagged performance and the instruments from table 4.2. Variable (A) (B) (C) Alignment Directors’ holdings 1.076∗∗ 1.022∗∗ Directors’ holdings sqrd -0.905∗ -0.915∗ Herfindahl index 0.096 0.153 Independence 0.000 -0.001 Information CEO director 0.026 0.036 Exported CEO -0.022 -0.015 Imported CEO -0.263 -0.208 Network 1.144∗∗ 1.140∗∗ Decisiveness Size -0.063∗∗ Gender -0.494∗∗ Board age dispersion -0.001 Employee directors -0.911∗∗ Past performance Tobin’s Q lagged 0.095∗ 0.108∗∗ 0.119∗∗ Controls Firm size -0.028∗ -0.037∗∗ -0.032∗∗ Risk -0.020∗ -0.022∗ -0.033∗∗ N 1283 1283 1286 J statistic 26.030 23.024 23.028 J’s p-value 0.250 0.060 0.060 Over ID test 27.810 25.693 29.353 ID test p-value 0.182 0.028 0.009
(D)
(E)
(F)
1.103∗∗ -0.953∗ 0.198 0.001
1.035∗∗ -0.900∗ 0.052 -0.002
0.033 -0.019 -0.215 1.099∗∗ -0.052∗∗ -0.680∗∗ 0.000 -0.885∗∗ 0.102∗∗
(G)
0.027 -0.017 -0.270 1.205∗∗ -0.055∗∗ -0.056∗∗ -0.636∗∗ -0.510∗∗ 0.000 -0.002 -0.888∗∗ -0.905∗∗
0.111∗∗
0.092∗
0.107∗∗
-0.033∗∗ -0.034∗∗ -0.032∗∗ -0.027∗∗ -0.020∗ -0.026∗∗ -0.017 -0.024∗∗ 1286 1283 1283 1286 16.079 27.416 22.065 21.241 0.309 0.072 0.229 0.267 25.415 34.160 30.473 27.538 0.031 0.002 0.033 0.069
The table shows estimates of regression models where the dependent variable is the time demeaned Tobin’s Q, which we measure as the market value of the firm over its book value. Model A, which is the full specification, is equation (4.1) augmented by Tobin’s Q lagged one period, and models (B)-(G) are partial versions of (A). Besides the control variables and past performance, a partial model includes one or two of the three sets of board design mechanisms (alignment, information, and decisiveness). For each firm and each variable, time demeaning involves subtracting a given year’s observation from the firm’s overall mean. Significant results at the 5% (10%) level are marked with ∗∗ (∗).
The results in table 4.4 mostly support the findings from the static models. We should compare these results to those in table 4.2, since both use the GMM technique. Focusing on the full model (A) and estimates which are significant
4.5. SUMMARY
41
at the 10% level, the three decisiveness mechanisms size, gender, and employee directors are fully consistent. For the information mechanisms, the network variable is consistent, whereas the positive performance effect of CEO directors is no longer significant. Under alignment, the loss of significance for Independence when lagged firm performance variable is included supports the Hermalin and Weisbach (1998) hypothesis that good performance makes boards less independent. That is, the performance effect of independent boards is not driven by independence per se, but by lagged performance and the CEO’s power to influence board composition. This feedback effect from the statistically significant past performance supports the reverse causation due to contemporaneous performance in table 4.3. Similarly, directors’ ownership becomes more significant, both regarding its linear and quadratic terms. This is consistent with the finding by Palia (2001) that high performance increases the probability that directors increase their shareholdings. These results also show that compared to the basic model in table 4.2, past performance has a role to play because it influences current performance directly and also changes the relationship between current performance and the board mechanisms. This pattern supports our early findings on reverse causation in section 4.3.
4.5
Summary
Our empirical tests in chapter 4 have shown that independently of model richness (full vs simplified), estimation method (GLS vs GMM) and model type (static vs dynamic), the information access created by the network of multiple directorships is always positively related to performance in a statistically significant way. In contrast, more diversity produced by larger board size, more gender diversity, and more employee directors are all negatively and significantly associated with performance. As for interest alignment, outside ownership concentration never enters the models in a significant way, whereas insider ownership does in the predicted manner under GMM estimation. More independence goes along with lower performance in the static models, but the relationship becomes insignificant when past performance is included. Reverse causation between past performance and current board design does not justify the use of dynamic as opposed to static models. Finally, our findings from models which explicitly consider reverse causation and endogeneity do not invalidate the results from our basic model estimated with GMM, as this method implicitly controls for such effects.
Chapter 5
Robustness This chapter first analyzes the sensitivity of our findings in chapter 4 to using differenced rather than time demeaned data to control for fixed effects. Second, we explore the impact of operationalizing board independence and director information network in alternative ways. Third, we investigate what happens when we include employee directors in the proxies for independence, gender, and board size. Finally, using the fixed effects model as the point of reference, we explore whether our findings can be generalized to models which ignore the panel structure of the data set.
5.1
A differenced model
An alternative method for removing the unobserved, individual firm effect is to time difference the data in (4.2). Thus, the dependent variable is differenced as ∆Qit = Qit − Qi,t−1 , and the independent variables are transformed in the same manner. Differencing the variables in (4.1) and also introducing the lagged, differenced dependent variable as a new independent variable (see section 4.4) transforms the static equation into a dynamic model: ∆Qt = Constant+α∆Qt−1 +β∆(Governance mechanisms)t +γ∆(Controls)t +∆uit (5.1) The constant is now time differenced. Notice that, just as with the time42
5.1. A DIFFERENCED MODEL
43
demeaning we have used up to now, the individual firm effect disappears through the differencing. Arellano and Bond (1991) suggest using GMM to estimate (5.1). The argument is that instruments may be constructed from the fact that lagged explanatory variables in levels are orthogonal to the residuals at each level.1 An advantage of this change model compared to a levels model is that differencing the lagged performance produces a dynamic model with less reverse causation problems, as the change in performance is less likely to influence the change in board design mechanisms. However, this procedure turns out to be unsuccessful in our case, possibly because the differencing is not suitable for our data set. Because board mechanisms are quite persistent over time, they may contain insufficient variation in the differenced series. Another drawback of the Arellano-Bond procedure is the large loss of observations due to the lagging. Because of these problems, we estimate a modified Arellano-Bond model. We first tried to follow the Arellano and Bond (1991) procedure and use instruments from the set of lagged independent variables in each period. This approach was unsuccessful, as the differencing and subsequent lagging of the dependent variable and the instruments made us lose too many observations. Also, because the instruments were often linearly dependent, the estimates were unstable. Therefore, we decided instead to choose instruments the way we did in section 4.4, i.e., by using raw and differenced explanatory variables. Table 5.1 shows the results of estimating (5.1). Just like in table 4.1, the full specification is estimated as model (A), whereas (B)-(G) are partial versions. In addition to the lagged performance difference and the control variable, a partial model includes either one or two of the three sets of board design mechanisms.
1 Specifically, Arellano and Bond (1991) assume that each explanatory variable lagged two periods, xi,(t−2) , is uncorrelated with the error term at time t. The first time this happens is at t = 3, which constitutes the first moment and hence produces the first year of moment conditions. In general, the moment condition for time period t is: ( �� t = 3, . . . , T ′ =0 E xij(t−2) ∆Qit − Constant − α∆Qi,(t−1) − βXit j = 1, . . . , K
Thus, GMM estimators may be developed that use all available lags in each period as instruments for (5.1). Every explanatory variable produces (T − 2)(T − 1)/2 moment conditions, and each explanatory variable may be used to construct instruments.
44
CHAPTER 5. ROBUSTNESS
Table 5.1 Dynamic relationships between firm performance and board design mechanisms estimated in a modified Arellano and Bond (1991) approach and GMM. Instruments are squared, differenced explanatory variables, including the lagged, differenced Tobin’s Q. Each regression uses only instruments belonging to the same class of explanatory variables. Variable Constant Alignment ∆ Directors’ holdings ∆ Directors’ holdings sqrd ∆ Herfindahl index ∆ Independence Information CEO director ∆ Exported CEO ∆ Imported CEO ∆ Network Decisiveness ∆ Size ∆ Gender ∆ Board age dispersion ∆ Employee directors Past performance ∆ Tobin’s Q lagged Controls ∆ Firm size ∆ Risk N J statistic J’s p-value Over ID test ID test p-value
(A) (B) (C) (D) (E) (F) (G) -0.092∗∗ -0.094∗∗ -0.099∗∗ -0.085∗∗ -0.099∗∗ -0.087∗∗ -0.092∗∗ 1.020∗ -1.068∗ 0.084 -0.015
1.018∗ -1.088∗ 0.128 -0.012
0.032 0.022 -0.219 0.996∗∗ -0.050∗ 0.046 0.003 -1.144∗∗
0.968∗ -1.040∗ 0.142 -0.013 0.034 0.027 -0.233 0.920∗∗
0.029 0.023 -0.214 0.954∗∗ -0.032 -0.065 0.003 -1.106∗∗
1.055∗ -1.104∗ 0.076 -0.013 0.036 0.026 -0.235 0.959∗∗ -0.039 -0.044∗ 0.016 -0.034 0.003 0.003 -1.121∗∗ -1.132∗∗
-0.248∗∗ -0.253∗∗ -0.244∗∗ -0.256∗∗ -0.244∗∗ -0.257∗∗ -0.247∗∗ -0.027 -0.032∗ -0.021 -0.014 1051 1051 233.245 104.476 0.000 0.000 236.851 105.277 0.000 0.000
-0.027∗ -0.026 -0.031∗ -0.028∗ -0.024 -0.024 -0.012 -0.026 -0.011 -0.022 1057 1057 1051 1051 1057 95.692 212.336 234.914 225.979 220.002 0.000 0.000 0.000 0.000 0.000 96.422 213.956 237.627 228.589 222.528 0.000 0.000 0.000 0.000 0.000
The table shows the results for regressions where the dependent variable is the differenced Tobin’s Q, which we measure as the market value of the firm over its book value. Except for the dummy variable (CEO director), every independent variable is differenced. Differencing involves subtracting the value at time t from the value at time t − 1. The full specification in expression (5.1) is estimated as model (A), and models (B)-(G) are partial versions of (A). In addition to the control and the differenced, lagged performance variable, a partial model includes either one or two of the three sets of board design mechanisms as independent variables. Significant results at the 5% (10%) level are marked with ∗∗ (∗).
5.2. EMPIRICAL PROXIES
45
Sample size is reduced from 1510 in table 4.1 to 1051 firm-years in the full specification (A). Compared to earlier estimates, the results in table 5.1 are disappointing. Even though we recognize all the qualitative results for the board mechanisms from earlier, except that gender, fewer coefficients are significant. Moreover, the significant lagged performance now has a negative sign throughout. This may suggest that differencing is unsuitable for this data set. As mentioned in section 4.2, differencing instead of time-demeaning a rather persistent time series may easily produce a time series with very low volatility. When this happens, there are less significant results with differenced as opposed to time-demeaned data. Furthermore, we notice that the statistics on overall model performance is quite poor. Thus, we choose not to question our earlier results based on the findings in table 5.1.
5.2
Empirical proxies
Every regression model in chapter 4 operationalizes the theoretical concepts in the same way. However, table 3.1 specifies alternative ways of measuring several theoretical concepts that we have not used yet. This section explores the robustness of our findings to alternative ways of measuring the theoretical constructs of board independence, director network, gender mix, and board size. The independence measure defined in (2.1), which we developed from the Hermalin and Weisbach (1998) logic, is based on the tenure of the CEO vs. the tenure of non-CEO directors. As noted in section 2.1, however, some argue that board independence is a matter of absolute rather than relative tenure, and that independence decreases rather than increases as tenure grows (Carter and Lorsch, 2004). We test this competing hypothesis by alternatively operationalizing independence by board tenure, CEO tenure, and chairman tenure, respectively. Under the Carter-Lorsch hypothesis, the expected relationship to performance is negative for board and chairman tenure. The second alternative operationalization is for the information network variable. Unlike our quite sophisticated proxy, every existing paper simply uses the average number of outside directorships (Hallock, 1997; Fich and White, 2000). Based on the arguments in section 2.2, we expect that the estimated coefficient of this alternative measure will have the same sign as our proxy, but will be less significant both economically and statistically.
46
CHAPTER 5. ROBUSTNESS
Table 5.2 The fixed effects model estimated with GMM under alternative empirical proxies for board independence and director network. The regressions use the same instrument set as in table 4.2, but with new variable definitions.
Alignment Directors’ holdings Directors’ holdings sqrd Herfindahl index Independence Information CEO director Exported CEO dummy Imported CEO Network Decisiveness Size Gender dummy Board age dispersion Employee directors Controls Firm size Risk N J statistic J’s p-value Over ID test ID test p-value
(1) Board tenure
(2) CEO tenure
(3) Chair tenure
(4)
0.975∗ -0.782 0.180 -0.038∗∗
0.911∗ -0.694 0.197 -0.004
0.879∗ 0.903∗ 0.976∗ -0.658 -0.691 -0.781 0.203 0.179 0.180 -0.010 -0.014∗∗ -0.050∗∗
0.716∗∗ -0.601 0.127 -0.012∗
0.924∗ -0.712 0.192 -0.011∗
0.090∗ -0.030 -0.158 1.327∗∗
0.084∗ -0.028 -0.055 1.358∗∗
0.088∗ 0.077 0.092∗ -0.029 -0.065∗∗ -0.066∗∗ -0.082 -0.341∗ -0.488∗∗ 1.371∗∗ 0.249∗∗ 0.276∗∗
0.071 -0.016 -0.032 1.457∗∗
0.081∗ -0.030 -0.055 1.385∗∗
OD
(5) (6) BT No OD controls
(7) Model (A)
-0.051∗∗ -0.048∗∗ -0.047∗∗ -0.036∗∗ -0.036∗∗ -0.072∗∗ -0.053∗∗ -0.600∗∗ -0.643∗∗ -0.622∗∗ -0.696∗∗ -0.636∗∗ -0.586∗∗ -0.626∗∗ -0.004 -0.002 -0.001 0.000 -0.003 0.001 0.000 -0.974∗∗ -1.002∗∗ -1.027∗∗ -0.927∗∗ -0.800∗∗ -1.164∗∗ -1.061∗∗ -0.022 0.006 1502 30.677 0.533 27.988 0.670
-0.030∗ 0.000 1502 32.942 0.421 28.298 0.655
-0.028 0.002 1502 31.296 0.451 27.598 0.689
-0.032∗ 0.001 1502 32.297 0.402 24.845 0.812
-0.013 0.009 1502 26.243 0.710 27.636 0.687
1612 30.385 0.297 15.849 0.956
-0.036∗∗ -0.002 1502 34.322 0.357 26.950 0.720
The table shows the results of using alternative empirical proxies for board independence in models (1)-(3), director network in model (4), and a combination of the two in model (5). Model (6) is our base-case model (G) from table 4.1 with Firm size and Risk removed. ’OD’ is the average number of outside directorships held by the board members, and ’BT’ is the board tenure proxy from model (1). Model (7) is model (A) from table 4.1. Significant results at the 5% (10%) level are marked with ∗∗ (∗).
Table 5.2 shows the results of re-estimating the fixed effects model (4.1) under alternative proxies for independence (models (1)-(3)), director network (model (4)) and for one combination of the two (model (5)). Model (6) is our full model (A) from table 4.2, except that we remove the control variables to check if they influence the results for the board mechanisms. Model (7) is the full model (A) from table 4.2. The estimates for model (6) are very close to those obtained in table 4.2. Thus, the control variable has no material effect on the estimated relationship
5.2. EMPIRICAL PROXIES
47
between board design mechanisms and performance. This also illustrates how the fixed effects model removes firm heterogeneity, and thereby makes control variables relatively less important. Comparing the estimates of the base-case full model in table 4.2 to those using alternative empirical proxies in models (1)-(5), the first impression is that the board mechanisms influencing information access and decisiveness are very robust to alternative operationalizations. The estimated sign, the economic significance, and the statistical significance are very close across the models. Under the alignment mechanisms, the coefficient estimates and the significance of the relationship between performance and ownership is insensitive to how board independence and director network are operationalized. This is not always the case for the interaction between performance and independence when independence is defined in terms of absolute rather than relative tenure (models (1)-(3)). Using CEO tenure or chairman tenure (models (2) and (3)), the estimated sign of the independence variable is no longer significant. In model (1), however, longer board tenure is associated with weaker performance in a significant way. This is consistent with the Carter and Lorsch (2004) hypothesis that less independence operationalized as longer board tenure produces lower performance. Thus, directors should not sit too long on the board. In our base case model, however, which is based on the Hermalin and Weisbach (1998) logic that independence is driven by relative and not absolute tenure, longer board tenure makes independence grow rather than decline. Therefore, given our earlier result that performance falls as independence grows, it is not surprising to find the opposite under the Carter and Lorsch (2004) definition. This shows that the theoretical rationale and the empirical operationalization of board independence are crucial. We prefer the Hermalin and Weisbach (1998) definition, both due to its stronger theoretical backing and because our results using this definition are consistent with most existing evidence. Therefore, we maintain that according to our analysis, board independence and firm performance are inversely associated.
48
CHAPTER 5. ROBUSTNESS
Table 5.3 The fixed effects model and GMM estimation under alternative operationalizations of independence, board size, and gender. The instrument set is as in table 4.2, except for new variable definitions. Alignment Directors’ holdings Directors’ holdings sqrd Herfindahl index Independence Information CEO director Exported CEO Imported CEO Network Decisiveness Size Gender Board age dispersion Employee directors Controls Firm size Risk N J statistic J’s p-value Over ID test ID test p-value
(A)
(B)
0.777 -0.734 0.254∗∗ -0.014∗∗
0.989∗ -0.806 0.287∗∗ -0.012∗
0.061 -0.016 -0.033 1.300∗∗
0.102∗∗ -0.025 -0.015 1.388∗∗
-0.031∗∗ -0.198 0.002 -0.581∗∗ -0.035∗ -0.043∗∗ 0.019 0.037 1498 1498 40.801 33.200 0.137 0.120 29.583 27.701 0.589 0.273
(C)
0.071 -0.021 -0.068 1.330∗∗
(D)
(E)
0.691 -0.795 0.189 -0.014∗∗
0.924∗ -0.712 0.192 -0.011∗ 0.081∗ -0.030 -0.055 1.385∗∗
-0.041∗∗ -0.019 -0.053∗∗ -0.147 -0.472∗ -0.626∗∗ -0.003 0.001 0.000 -0.648∗ -0.716∗∗ -1.061∗∗ -0.024 0.002 1511 20.075 0.453 23.198 0.279
-0.035∗ -0.036∗∗ 0.021 -0.002 1498 1502 39.404 34.322 0.018 0.357 20.583 26.950 0.422 0.720
Including employee directors in the definition of board size, gender, and independence, the table shows estimates of five regression models where the dependent variable is the time demeaned Tobin’s Q, which we measure as the market value of the firm over its book value. Model (E) reproduces the results from the full model in table 4.2. Model (A) is the full model when Employee directors are included in the measures of Independence, Size, and Gender. Partial versions of (A) are shown in (B)-(D). Besides the control variables, a partial model includes one or two of the three sets of board design mechanisms (alignment, information, and decisiveness). For each firm and each variable, time demeaning involves subtracting a given year’s observation from the firm’s overall mean. Significant results at the 5% (10%) level are marked with ∗∗ (∗).
Models (4) and (5) use the average number of outside directorships to proxy for the information network. The relationship between performance and the information network is positive and significant, but is much smaller economically than under our more sophisticated information centrality measure used in model (7). This is as expected. Whereas the outside directorship measure only counts all outside directorships held, our network proxy avoids double counting, includes indirect network effects, and recognizes the relative position of each firm in the network.
5.3. THE POOLED SAMPLE
49
We pointed out in section 2.3 that if we are concerned with the performance effect of board size or gender diversity, it seems irrelevant whether or not the directors are elected by shareholders or employees. Due to potential multicollinearity, however, we have so far removed employee directors from the gender and board size variables. To explore the effect of lifting this restriction, we reestimate the full model from table 4.2 in table 5.3, letting size and gender reflect the full board rather than only those elected by stockholders. Moreover, we include employee directors in our independence measure. All estimated signs are maintained in the table except for the insignificant board age dispersion under model (C) and the insignificant risk in (A)-(D). Focusing on the two full models (A) and (E), the coefficients for the alignment mechanisms change somewhat under the new measures. Ownership concentration becomes significant, insider holdings are not significant anymore, and independence is slightly more negative and more significant. While the CEO director variable becomes insignificant under information mechanisms, the coefficient for gender as a decisiveness mechanism is reduced by two thirds and is insignificant. Notice also that the revised definition of these three variables increases the significant performance effect of one of them (independence) and maintains the significance of another (size). For the third variable (gender), however, the association to performance is no longer significant. Overall, these results increase our confidence in models where employee directors are ignored in the definition of independence, board size, and gender.
5.3
The pooled sample
To explore whether panel data estimation is required in our setting, we estimate (4.1) with the pooled sample using OLS. Unlike panel data methods, this approach ignores both individual effects and time effects, assuming that the error term is identical across all firms and time periods. In order to compensate for the ignored consideration of heterogeneity, researchers often use a battery of control variables. The idea is that good control variables reduce the firm-specific background noise, making it easier to estimate the robust relationship between the variables of interest. If this approach is successful, we would also expect control variables to be more significant than in panel data models. Also, unlike panel data methods, the OLS approach allows for time invariant control variables in the regressions. Table 5.4 shows the results of the estimation, where we have added the firm’s
50
CHAPTER 5. ROBUSTNESS
Table 5.4 Firm performance explained by board design mechanisms, using the pooled sample and OLS estimation. Variable (A) (B) (C) (D) Constant 1.855∗∗ 1.851∗∗ 1.612∗∗ 2.117∗∗ Alignment Directors’ holdings 1.896∗∗ 1.977∗∗ Directors’ holdings sqrd -1.433∗∗ -1.520∗∗ Herfindahl index -0.635∗∗ -0.734∗∗ Independence 0.000 0.002 Information CEO director -0.006 -0.025 Exported CEO -0.069∗ -0.060∗ Imported CEO -0.080 -0.054 Network 2.002∗∗ 2.234∗∗ Decisiveness Size -0.029 -0.013 Gender -0.224 -0.658∗∗ Board age dispersion -0.011 -0.017∗∗ ∗ Employee directors 0.309 0.335∗ Controls Industry 0.000∗∗ 0.000∗∗ 0.000∗∗ 0.000∗∗ Firm size -0.098∗∗ -0.087∗∗ -0.102∗∗ -0.095∗∗ Risk 0.236∗∗ 0.260∗∗ 0.248∗∗ 0.270∗∗ N 1510 1510 1520 1520 R2 0.184 0.162 0.150 0.137 F (p-value) 0.000 0.000 0.000 0.000 Breusch-Pagan 0.000 0.000 0.000 0.000
(E) (F) 1.610∗∗ 2..094∗∗
(G) 1.879∗∗
1.900∗∗ 1.953∗∗ -1.433∗∗ -1.498∗∗ -0.659∗∗ -0.710∗∗ 0.000 0.002 -0.036 -0.073∗∗ -0.075 1.998∗∗
0.002 -0.054 -0.086 2.198∗∗ -0.022 -0.311 -0.013 0.345∗∗
-0.021 -0.540∗ -0.016∗ 0.303∗
0.000∗∗ 0..000∗∗ 0.000∗∗ -0.096∗∗ -0.091∗∗ -0.104∗∗ 0.241∗∗ 0.258∗∗ 0.239∗∗ 1510 1510 1520 0.178 0.168 0.156 0.000 0.000 0.000 0.000 0.000 0.000
The table shows estimates of OLS regression models on the pooled smaple where the dependent variable is Tobin’s Q, which we measure as the market value of the firm over its book value. The full specification in expression equation (4.1) is estimated as model (A), and models (B)-(G) are partial versions of (A). Besides the control variables, a partial model includes either one or two of the three sets of board design mechanisms (alignment, information, and decisiveness). Significant results at the 5% (10%) level are marked with ∗∗ (∗).
industry as a control variable. We compare the findings with those under GLS in table 4.1, since the OLS methodology is closer to GLS than to GMM. As the results are quite consistent across models within each table, we compare the estimates of the full pooled sample model (A) in table 5.4 to those of the full fixed effects model (A) in table 4.1. There are some noticeable differences. First, unlike the panel data model, the pooled model reproduces the classic result in the ownership structure literature of a positive and quadratic relationship between insider holdings and corporate performance (McConnell and Servaes, 1990; Gugler, 2001). Also, outside ownership concentration is now inversely related to performance in a significant way. Second,
5.4. SUMMARY
51
the negative exported CEO effect becomes significant, and the significant coefficient of the network effect is smaller. Third, only employee directors is significant among the decisiveness mechanisms. However, its sign is reversed, and the significance weakens. Fourth, the importance of the control variables has increased considerably. Finally, the R2 values are much smaller with pooled data. These findings show very clearly that unless we can ignore the panel data structure in our data set, the pooled model is seriously misspecified. Table 5.5 clarifies this issue by analyzing the error terms of the OLS model. Table 5.5 Individual effects and time effects in the error term in an OLS regression of model (4.1) under the pooled sample. Sum of Mean Source squares Degrees square F -statistic p-value Individual 899.576 259 3.473 7.373 0.000 Time 67.690 13 5.207 11.054 0.000 Joint 995.755 272 3.661 7.772 0.000 Error 591.184 1255 0.471 Total 1586.939 1527 The table shows the results for an analysis of variance (ANOVA) test of the null hypothesis that the mean error term from the OLS estimation is identical across individual companies, across time, or both. The total variance of the OLS error term is decomposed in the Sum of squares column. These figures are used to construct the F-statistics, which reflect the differences between the common mean the mean error in each source of variation. The sample size is 1527.
The ANOVA test splits the total variance of the OLS error term into individual, time, and random components. The table shows that panel effects are very prevalent in our data. Also, the firm-specific component is very large relative to the firm-independent time component. Both characteristics show that the pooling approach is infeasible and should be replaced by a methodology that recognizes the panel structure, such as the model in section 4.2.
5.4
Summary
The robustness tests in this chapter have shown that due to the panel nature of our data set, estimation models which ignore this property and instead rely on pooled data are grossly misspecified. Among the alternative panel data approaches, we find that individual firm effects are better taken care of by time demeaning the variables rather than by differencing them. As for empirical proxies for theoretical concepts, alternative ways of operationalizing information network, gender
52
CHAPTER 5. ROBUSTNESS
diversity, and board size have no fundamental effect on the interaction between performance and board composition. When we measure independence by board tenure (longer tenure reflects less independence) rather than the relative tenure of the directors vs the CEO (longer tenure reflects more independence, given constant CEO tenure), performance is again negatively associated with tenure. This is as expected from the two independence definitions. Because we think the relative tenure definition based on Hermalin and Weisbach (1998) has stronger theoretical backing and is more consistent with existing evidence, we maintain that board independence and firm performance are inversely associated in our sample firms.
Chapter 6
Summary and conclusions The basic question we ask in this study is how the composition of the board influences the firm’s ability to create economic value. Our approach differs from existing ones by exploring board design in a new regulatory environment, analyzing a wider set of board design mechanisms including gender diversity and employee directors, using time-series data rather than a single-period cross-section, measuring board independence and directors’ information network in a novel way, and by showing how conclusions change if we ignore the multi-period nature of the data and replace our panel data methods by the more common pooled sample and OLS estimation techniques. Studying all non-financial firms listed on the Oslo Stock Exchange over the period 1989-2002, we find that both inside and outside ownership concentration are low and are complements rather than substitutes. This means ownership is often separated from control, such that potential agency costs are high. This setting makes the board’s monitoring function critical, particularly in firms where low inside ownership produces both weak value maximization incentives for management and low monitoring incentives for directors. The board’s independence of the CEO is medium in the Hermalin and Weisbach (1998) sense, as the CEO and the average director have roughly the same tenure. The CEO is a director in the firm he runs in less than one third of the cases, but those who are also sit more often on other boards. Nevertheless, the typical CEO does not play the double roles of being both a monitor and the monitored. Our director network measure, which picks up both the direct and indirect effects of holding multiple board seats, shows that firms differ widely in their director-driven access to information from other boards. 53
54
CHAPTER 6. SUMMARY AND CONCLUSIONS
If homogeneity fosters decisiveness, the remarkably small size and the low gender diversity in our sample firms’ boards suggest that they are effective decisionmaking units. In contrast, director age produces much more diversity. The typical director is forty seven years old, average age per board varies by almost fifty years across the sample, and there are often large age differences within the board. Less than half the firms have employee directors, which is mandated when the firm employs more than 200 people. Over the sample period, the CEO is gradually less often a director, female directors become much more common, and the use of employee directors declines. Thus, although each separate component changes over time, the dynamics of overall board diversity is unclear. We test the empirical relationship between board design and economic performance with both static and dynamic panel data models, using GLS and particularly GMM estimation techniques. Regardless of model type and estimation method, we find that performance is significantly higher in firms where the directors sit on several boards. Thus, multiple directorships produce information networks whose value more than offsets the cost of having busy, overstretched directors. In contrast, higher board diversity produced by larger board size, stronger gender mix, and more employee directors are all negatively and often significantly related to performance. This may happen because more diversity reduces the board’s effectiveness as a decision-making unit. In addition, the negative association between market value and the use of employee directors may reflect a fundamental conflict of interest between owners and employees. Whereas outside ownership concentration is very seldom a significant determinant of firm performance, insider ownership often is. Thus, monitoring by non-director owners is an ineffective disciplining device, whereas directors with ownership stakes produce valuable disciplining and support functions. Correspondingly, investors benefit if managers have ownership-driven incentives to maximize market value. Moreover, economic performance improves when the directors are dependent rather than independent of the CEO. Thus, the longer the directors’ arm’s length distance to the CEO, the less value they produce. This conclusion is strengthened by our finding that boards perform better when the CEO is a member. Causation does not just run both from board design mechanisms to performance, but also from performance to board design. Moreover, mechanisms are endogenous because they jointly determine each other. Although neither reverse causation nor mechanism endogeneity invalidates our conclusions, it sometimes
55 reduces our ability to separate causes from effects in board design, which is a general problem in corporate governance research. Finally, our robustness tests show that estimation models which ignore the panel structure of the data are grossly misspecified. Alternative ways of measuring information network, gender diversity, and board size have only moderate effects on the estimated interaction board composition and economic performance. A recent survey concludes that the formal board literature is surprisingly thin, given the wide attention paid in public policy debates to this core component of a firm’s corporate governance system (Becht et al., 2002). Correspondingly, research on the relationship between board composition and economic performance is still in its infancy. This paper tries to improve on this situation by searching for the characteristics of value-creating boards, using a comprehensive and rigorous empirical framework. Our findings suggest that designers of value-creating boards should encourage insider stock ownership, ensure the CEO is a member even if it reduces independence, hire directors with professional business competence rather than arms-length monitoring capacity, recognize the network value of directors with multiple seats rather than worry about potential overstretching, and construct boards that are homogeneous rather than diverse. Some of these conclusions are politically incorrect, run counter to key recommendations of most countries’ corporate governance codes, and pull board design into opposite directions than those implied by conventional wisdom. We think this may reflect a situation where practical board design has been shaped by practitioners and regulators based on their limited personal experience, political agendas, and recently also by a concern with scandal prevention rather than firm value maximization. Our findings support the claim that much more academic research is needed in order to ensure a well-founded economic rationale for the regulation of board design.
Appendix A
Definitions Table A.1: Definition of variables used in the empirical analysis Variable Alignment Insider ownership CEO holdings Directors’ holdings Herfindahl index
Definition
Fraction of equity owned by the firm’s officers Fraction of equity owned by the firm’s CEO Fraction of equity owned by the board of directors A measure of the concentration of ownership, defined as the sum of the squares of the shares of each individual owner divided by the squared sum of individual shares Three largest own- Fraction of equity owned by the firm’s three largest owners ers Largest outsider Fraction of equity owned by largest non-director CEO tenure The tenure of the CEO Board tenure The average tenure of the board of directors, employee directors excluded Chair tenure The chairman’s tenure Independence The board’s Independence, that is, the average tenure of the board minus the tenure of the CEO Information CEO director Dummy variable which is 1 if the CEO is a member of the board of his company and zero otherwise Exported CEO The number of board directorships in other companies held by the CEO Imported CEO The proportion of CEOs from other companies on the board Outside director- Average number of outside directorships per board member ships Network Information centrality, (defined in the text) continued on next page 56
57 Table A.1: continued Variable Decisiveness Size Size1 Gender Gender1
Definition
Board size measured as the number of directors Board size, exclusive of employee directors The proportion of female directors on the board The proportion of female directors in boards without employee directors Gender2 The proportion of female directors in boards with employee directors Gender3 The proportion of female directors on the board, excluding the employee directors Gender4 The proportion of female directors among employee directors, when employee directors are represented Board age The average age of the board CEO age The CEO’s age Board age disper- The standard deviation of board age sion Employee directors The number of employee directors Fraction employee The number of employee directors divided by the total number directors of directors (Size) Employee directors Dummy variable which is 1 if employees’ representatives are dummy on the board and zero otherwise Controls Firm size The natural logarithm of accounting income Industry GICS industry classification code Risk The firm’s equity beta, estimated as the standardized covariance with the Oslo Stock Exchange Index (OBX), using two years of daily returns Performance Q Tobin’s Q; measured as market value divided by book value of assets
Bibliography Aarbakke, M., J. Sk˚ are, G. Knudsen, T. Ofstad, and A. Aarbakke (1999). Aksjeloven og Allmennaksjeloven. Oslo: Tano Aschehoug. Agrawal, A. and C. R. Knoeber (1996). Firm performance and mechanisms to control agency problems between managers and shareholders. Journal of Financial and Quantitative Analysis 31 (3), 377–397. Agresti, A. (1990). Categorical Data Analysis. New York: John Wiley & Sons. Amemiya, T. and T. E. MaCurdy (1986). Instrumental-variable estimation of an error-components model. Econometrica 54, 869–880. Arellano, M. (2003). Panel Data Econometrics. Oxford, UK: Oxford University Press. Arellano, M. and S. Bond (1991). Some tests of specification for panel data: Monte Carlo evidence and an application to employment equations. Review of Economic Studies 58, 277–297. Barca, F. and M. Becht (2001). The Control of Corporate Europe. Oxford, UK: Oxford University Press. Baysinger, B. D. and H. N. Butler (1985). Corporate governance and the board of directors: Performance effects of changes in board composition. Journal of Law, Economics, and Organization 1 (1), 101–124. Becht, M., P. Bolton, and A. R¨oell (2002). Corporate governance and control. In G. Constantinides, M. Harris, and R. Stulz (Eds.), Handbook of the Economics of Finance. North-Holland. Bhagat, S. and B. Black (1999). The uncertain relationship between board composition and firm performance. The Business Lawyer 54, 921–963. Bhagat, S. and B. Black (2002). The non-correlation between board independence and long term firm performance. Journal of Corporation Law 27 (2), 231–274. Bøhren, Ø. and B. A. Ødegaard (2001a). Patterns of corporate ownership: Insights from a unique data set. Nordic Journal of Political Economy 27, 57–88. 58
BIBLIOGRAPHY
59
Bøhren, Ø. and B. A. Ødegaard (2001b). The relationship between corporate governance and economic performance in Norwegian listed firms. Research Report no. 11, Norwegian School of Management BI. Bøhren, Ø. and B. A. Ødegaard (2006). Governance and performance revisited. In International Corporate Governance after Sarbanes-Oxley. New York: Wiley. Breusch, T. S., G. E. Mizon, and P. Schmidt (1989). Efficient estimation using panel data. Econometrica 57 (3), 695–700. Brickley, J. A., J. L. Coles, and G. Jarrell (1997). Leadership structure: Separating the CEO and chairman of the board. Journal of Corporate Finance 3 (3), 189– 220. Buchanan, J. M. and G. Tullock (1962). The Calculus of Consent. Logical Foundations of Constitutional Democracy. The University of Michigan Press. Byrd, J. W. and K. A. Hickman (1992). Do outside directors monitor managers? Journal of Financial Economics 32, 195–221. Cadbury, A. (2002). Corporate Governance and Chairmanship. A Personal View. Oxford: Oxford University Press. Carter, C. B. and J. W. Lorsch (2004). Back to the Drawing Board. Boston, Mass.: Harvard Business School Press. Carter, D. A., B. J. Simkins, and W. G. Simpson (2003). Corporate governance, board diversity and firm value. Financial Review 38, 33–53. Cotter, J. F., A. Shivdasani, and M. Zenner (1997). Do independent directors enhance target shareholder wealth during tender offers? Journal of Financial Economics 43, 195–218. Dalton, D. R., C. M. Daily, A. E. Ellstrand, and J. L. Johnson (1998). Metaanalytic reviews of board composition, leadership structure, and financial performance. Strategic Management Journal 19 (3), 269–290. Dalton, D. R., C. M. Daily, J. L. Johnson, and A. E. Ellstrand (1999). Number of directors and financial performance: A meta-analysis. Academy of Management Journal 42 (6), 674–686. Demsetz, H. and K. Lehn (1985). The structure of corporate ownership: Causes and consequences. Journal of Political Economy 93 (6), 1155–1177. Eisenberg, T., S. Sundgren, and M. T. Wells (1998). Larger board size and decreasing firm value in small firms. Journal of Financial Economics 48, 35–54. Falaye, O., V. Mehrotra, and R. Morck (2004). When labor has a voice in corporate governance. http://papers.ssrn.com=498962.
60
BIBLIOGRAPHY
Fama, E. F. (1980). Agency problems and the theory of the firm. Journal of Political Economy 88 (2), 288–307. Fama, E. F. and M. C. Jensen (1983). Separation of ownership and control. Journal of Law and Economics 26, 301–325. Ferris, S. P., M. Jagannathan, and A. Pritchard (2003). Too busy to mind the business? Monitoring by directors with multiple board appointments. Journal of Finance 58 (3), 1087–1111. Fich, E. M. and L. J. White (2000). Why do CEOs reciprocally sit on each other’s boards? Working paper, Stern School of Business, New York University. Finkelstein, S. and D. C. Hambrick (1989). Chief executive compensation: A study of the intersection of markets and political processes. Strategic Management Journal 10 (2), 121–134. FitzRoy, F. R. and K. Kraft (1993). Economic effects of codetermination. Scandinavian Journal of Economics 95 (3), 365–375. Freeman, R. E. and D. L. Reed (1983). Stockholders and stakeholders: A new perspective on corporate governance. California Management Review 25, 88– 106. Gilson, R. J. and R. Kraakman (1991). Reinventing the outside director: An agenda for institutional investors. Stanford Law Review 43. Gjølberg, O. and O. Nordhaug (1996). Optimal investment committee size. Journal of Portfolio Management 22 (2), 87–94. Green, W. H. (1993). Econometric Analysis (3rd ed.). New York: Prentice Hall. Gugler, K. (2001). Corporate governance and performance: The research questions. In K. Gugler (Ed.), Corporate Governance and Economic Performance, Chapter 1, pp. 1–67. Oxford, UK: Oxford University Press. Hallock, K. F. (1997). Reciprocally interlocking boards of directors and executive compensation. Journal of Financial and Quantitative Analysis 32 (3), 331–344. Hermalin, B. E. and M. S. Weisbach (1991). The effect of board composition and direct incentives on firm performance. Financial Management 21 (4), 101–112. Hermalin, B. E. and M. S. Weisbach (1998). Endogenously chosen boards of directors and their monitoring of the CEO. American Economic Review 88 (1), 96–118. Hermalin, B. E. and M. S. Weisbach (2003). Boards of directors as an endogenously determined institution: A survey of the economic literature. Economic Policy Review 9 (1), 7–26.
BIBLIOGRAPHY
61
Hopt, K. J. (1998). The German two-tier board: Experience, theories, reform. See Hopt et al. (1998), Chapter 4(a), pp. 227–258. Hopt, K. J., H. Kanda, M. J. Roe, E. Wymeersch, and S. Prigge (Eds.) (1998). Comparative Corporate Governance: The State of the Art and Emerging Research. Oxford: Oxford University Press. Hsiao, C. (1986). Analysis of Panel Data. Cambridge: Cambridge University Press. Jensen, M. C. and W. Meckling (1976). Theory of the firm: Managerial behavior, agency costs, and ownership structure. Journal of Financial Economics 3, 305– 360. Kiel, G. C. and G. J. Nicholson (2003). Board composition and corporate performance: How the Australian experience informs contrasting theories of corporate governance. Corporate Governance 11 (3), 189–205. Klein, A. (1998). Firm performance and board committee structure. Journal of Law and Economics 46, 275–303. Krishnakumar, J. (1996). Simultaneous equations. In L. M´aty´as and P. Sevestre (Eds.), The Econometrics of Panel Data: A Handbook of the Theory with Applications, Chapter 9, pp. 196–235. Kluwer Academic Publishers. La Porta, R., F. L. de Silanes, A. Shleifer, and R. Vishny (2000). Investor protection and corporate governance. Journal of Political Economy 58 (1-2), 3–28. McConnell, J. and H. Servaes (1990). Additional evidence on equity ownership and corporate value. Journal of Financial Economics 27, 595–612. Mizruchi, M. S. and L. B. Stearns (1988). A longitudinal study of the formation of interlocking directorates. Administrative Science Quarterly 33, 194–210. Mørck, R., A. Shleifer, and R. Vishny (1988). Management ownership and market valuation: An empirical analysis. Journal of Financial Economics 20, 293–315. Mueller, D. C. (2003). Public Choice III. Cambridge, UK: Cambridge University Press. Noe, T. H. and M. J. Rebello (1997). The design of corporate boards: Composition, compensation, factions, and turnover. Working paper. Palia, D. (2001). The endogeneity of managerial compensation in firm valuation: A solution. Review of Financial Studies 14 (3), 735–764. Perry, T. and U. C. Peyer (2005). Board seat accumulation by executives: A shareholder’s perspective. Journal of Finance 60 (4), 2083–2123.
62
BIBLIOGRAPHY
Pfeffer, J. (1972). Size and composition of corporate boards of directors: The organization and its environment. Administrative Science Quarterly 17, 218– 228. Raheja, C. G. (2005). Determinants of board size and composition: A theory of corporate boards. Journal of Financial and Quantitative Analysis 40 (2). Rediker, K. J. and A. Seth (1995). Boards of directors and substitution effects of alternative governance mechanisms. Strategic Management Journal 16, 85–99. Schmid, F. A. and F. Seger (1998). Arbeitnehmermitbestimmung, Allokation von Entscheidungsrechten und Shareholder Value. Zeitschrift fur Betriebswirtschaft 68 (5), 453–473. Shivdasani, A. (1993). Board composition, ownership structure and hostile takeovers. Journal of Accounting and Economics 16, 167–198. Shleifer, A. and R. W. Vishny (1986). Large shareholders and corporate control. Journal of Political Economy 94 (3), 461–486. Shrader, C. B., V. B. Blackburn, and P. Iles (1997). Women in management and firm financial performance: An exploratory study. Journal of Managerial Issues 9 (3), 355–372. Smith, N., V. Smith, and M. Verner (2005). Do women in top management affect firm performance? A panel study of 2500 Danish firms. Technical Report 1708, Institute for the Study of Labor (IZA). Wasserman, S. and K. Faust (1994). Social Network Analysis: Methods and Applications. Cambridge, UK: Cambridge University Press. Welbourne, T. M. (1999). Wall Street likes its women: An examination of women in the top management teams of initial public offerings. Working Paper 99-07, CAHRS, Cornell University. Westphal, J. D. and J. W. Fredrickson (2001). Who directs strategic change? Director experience, the selection of new CEOs, and change in corporate strategy. Strategic Management Journal 22 (12), 1113–1137. Williamson, O. E. (1996). The Mechanisms of Governance. Oxford, UK: Oxford University Press. Woolridge, J. M. (2002). Econometric Analysis of Cross Section and Panel Data. Cambridge, Mass.: The MIT Press. Wymeersch, E. (1998). A status report on corporate governance rules and practices in some continental European states. See Hopt et al. (1998), Chapter 12(d), pp. 1045–1200. Yermack, D. (1996). Higher market valuation of companies with a small board of directors. Journal of Financial Economics 40, 185–212.