Glenn Franck and Colin Ware. Reprinted with permission) ... 6. Ware, C. (1999) Information Visualization: Perception for Design. Morgan. Kaufman. December.
The Visual Representation of Information Structures Colin Ware Data Visualization Research Lab Center for Coastal and Ocean Mapping University of New Hampshire Durham, NH 03924.
Abstract. It is proposed that research into human perception can be applied in designing ways to represent structured information. This idea is illustrated with four case studies. (1) How can we design a graph so that paths can be discerned? Recent results in the perception of contours can be applied to make paths easier to perceive in directed graphs. (2) Should we be displaying graphs in 3D or 2D space? Research suggests that larger graphs can be understood if stereo and motion parallax depth cues are available. (3) How can heterogeneous information structures be best represented? Experiments show using structured 3D shape primitives make diagrams that are easier to discover and remember. (4) How can causal relationships be displayed? Michotte’s work on the perception of causality suggests that causal relationships can be represented using simple animations. The general point of these examples is that data visualization can become a science based on the mapping of data structures to visual representations. Scientific methods can be applied both in the development of theory and testing the value of different representations.
1 Introduction The human visual system provides by far the highest bandwidth channel into the brain (70% of all receptors, more than 40% of cortex devoted to vision). However, the visual machinery does not analyze all patterns equally well. This paper illustrates ways in which we may apply what is known about human perception to data representation.
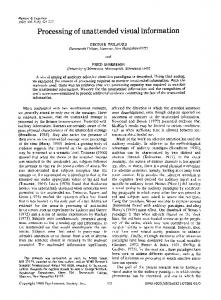
2 Finding Paths in Directed Graphs Recent work on the gestalt concept of “good continuity” provides us with a detailed description of the conditions under which continuous contours are perceived [2]. These results can be applied directly to the problem of emphasizing important paths in graphs. For example paths drawn so that edge curvature is minimized will be easier to be perceived. This is illustrated in Figure 1. In addition nodes should be placed in rough alignment and should consist of oriented elongated symbols.
J. Marks (Ed.): GD 2000, LNCS 1984, pp. 1-4, 2001. © Springer-Verlag Berlin Heidelberg 2001
2
C. Ware
Fig. 1. Different paths are emphasized on the same graph.
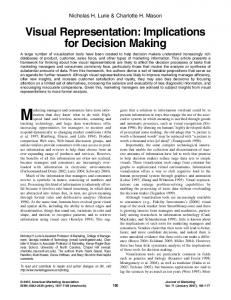
3 Visualizing Graphs in 3D There is a debate about whether information should be displayed in 3D or in 2D. A study by Ware and Franck examined the value of different depth cues in a task relating to tracing paths in graphs [8]. The results showed that over a wide range of graph sizes using stereopsis allowed about 60% more to be seen and using motion parallax allowed about 130% more to be seen. As expected, the perspective depth cue was not important for this particular task.
Fig. 2. This large graph represents the structure of a 6 million line program. (Image copyright Glenn Franck and Colin Ware. Reprinted with permission)
The Visual Representation of Information Structures
3
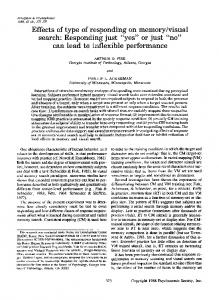
4 Using Geons to Represent Structured Information Research by Marr [5] and by Biederman [1] suggests that complex objects are broken down by the visual system into 3d “geon” primitives. Irani and Ware have shown that diagrams constructed using these primitives are much easier to analyze and recognize in comparison with conventional box-line diagrams [3]. Figure 3. illustrates a “geon” diagram [3].
Fig. 3. Geons are 3D primitives of object perception. Diagrams constructed from geon elements may be both more accurately interpreted and recalled (image copyright Pourang Irani: reprinted with permission)
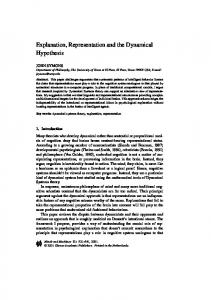
5 Simple Animation for Representing Causal Relations The work of Michotte [4] suggests that given simple animations and the appropriate timing of events people can “directly” perceive causality in the same sense that they directly perceive a connection between two objects linked by a line. Ware et al [7] applied this phenomenon of causality perception to the representation of causal relationships in statistical graphs. One of the methods for representing causality was to have a ball move, striking a “node” in a graph apparently causing it to vibrate (Figure 4).
4
C. Ware
Fig. 4. Causality can be represented by a ball striking a node “causing” it to oscillate.
6 Conclusion Semiotics is the study of symbols and the way in which they display meaning. With advances in the science of human perception we can lay the foundation for a science of semiotics. This science allows us to develop testable theories relating to the mapping for information structures to visual representations. The ultimate goal is to map data in ways that take full advantage of the huge processing power inherent in the human visual system [6].
References 1. Biederman, I. (1987) Recognition-by-Components: A Theory of Human Image Understanding, Psychological Review, Vol. 94, No. 2, 115-147. 2. Field, D.J., Hayes, A., and Hess, R.F. (1992) Contour integration by the human visual system: evidence for a local “association field”, Vision Research, 33(2) 173193. 3. Irani, P and Ware, C, (2000) Diagrams based on structured object perception. Advanced Visual Interfaces, AVI'2000, Palermo, Italy, May. Proceedings, 61-67. 4. Michotte, A. (1963) The perception of causality. Translated by T. Miles and E. Miles. Methuen. 5. Marr, D. (1982) Vision: A computational investigation into the human representation and processing of visual information. San Fransisco, CA: Freeman. 6. Ware, C. (1999) Information Visualization: Perception for Design. Morgan Kaufman. December. 7. Ware, C, Neufeld, E., and Bartram, L., (1999) Visualizing Causal Relations, IEEE Information Visualization. Proceeding Late Breaking Hot Topics, 39-42. 8. Ware, C. and Franck, G. (1996) Evaluating Stereo and Motion Cues for Visualizing Information Nets in Three Dimensions. ACM Transactions on Graphics.15(2) 121-139..